| Param | Original file | Final file |
|---|---|---|
| Filename | modeM0/AS1T05_105T01_9000005658_41353cztM0_level2.fits | modeM0/AS1T05_105T01_9000005658_41353cztM0_level2_quad_clean.evt |
| Size (bytes) | 360,123,840 | 92,914,560 |
| Size | 343.4 MB | 88.6 MB |
| Events in quadrant A | 3,015,008 | 640,182 |
| Events in quadrant B | 2,566,442 | 648,936 |
| Events in quadrant C | 3,355,531 | 591,129 |
| Events in quadrant D | 3,955,223 | 539,756 |
| Mode M9 | |||
|---|---|---|---|
| Quadrant | BADHDUFLAG | Total packets | Discarded packets |
| A | 0 | 26 | 0 |
| B | 0 | 26 | 0 |
| C | 0 | 26 | 0 |
| D | 0 | 27 | 0 |
| Mode SS | |||
|---|---|---|---|
| Quadrant | BADHDUFLAG | Total packets | Discarded packets |
| A | 0 | 114 | 0 |
| B | 0 | 114 | 0 |
| C | 0 | 114 | 0 |
| D | 0 | 114 | 0 |
| Mode M0 | |||
|---|---|---|---|
| Quadrant | BADHDUFLAG | Total packets | Discarded packets |
| A | 0 | 12535 | 3 |
| B | 0 | 11502 | 2 |
| C | 0 | 13409 | 2 |
| D | 0 | 15629 | 2 |
| Quadrant | Total seconds | Saturated seconds | Saturation percentage |
|---|---|---|---|
| A | 5627 | 14 | 0.248800% |
| B | 5627 | 15 | 0.266572% |
| C | 5627 | 260 | 4.620579% |
| D | 5627 | 360 | 6.397725% |
Noise dominated data is calculated using 1-second bins in cleaned event files. If a bin has >2000 counts, and if more than 50% of those come from <1% of pixels, then it is considered to be noise-dominated and hence unusable.
| Quadrant | # 1 sec bins | Bins with >0 counts | Bins with >2000 counts | High rate bins dominated by noise | Noise dominated (total time) | Noise dominated (detector-on time) | Marked lightcurve |
|---|---|---|---|---|---|---|---|
| A | 7180 | 5628 | 7 | 7 | 0.10% | 0.12% | 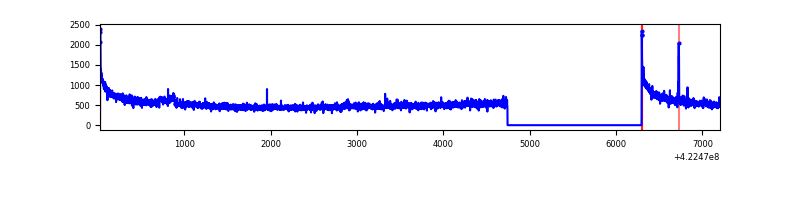 |
| B | 7179 | 5627 | 1 | 1 | 0.01% | 0.02% | 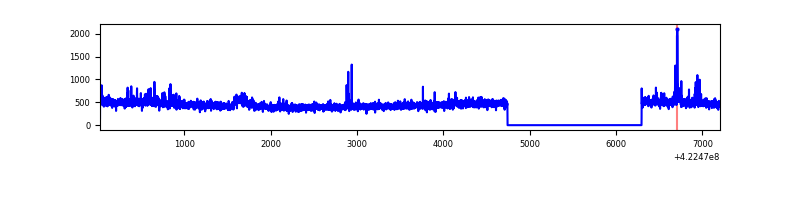 |
| C | 7179 | 5626 | 238 | 238 | 3.32% | 4.23% | 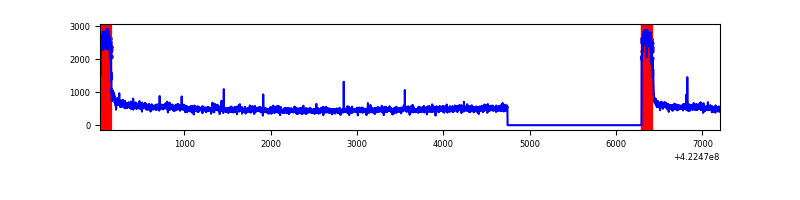 |
| D | 7179 | 5626 | 339 | 339 | 4.72% | 6.03% | 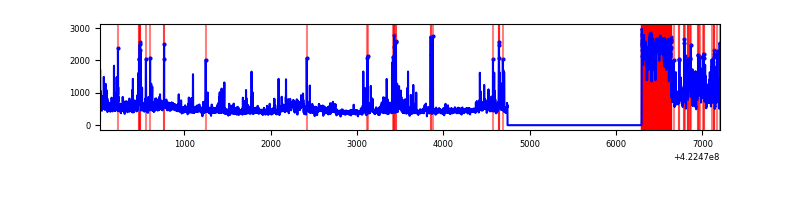 |
Top three noisy pixels from each quadrant. If the there are fewer than three noisy pixels in the level2.evt file, extra rows are filled as -1
| Pixel properties | Quadrant properties | ||||||
|---|---|---|---|---|---|---|---|
| Quadrant | DetID | PixID | Counts | Sigma | Mean | Median | Sigma |
| A | 10 | 83 | 541907 | 4147.55 | 628 | 615 | 130.5 |
| A | 12 | 189 | 36411 | 274.28 | 628 | 615 | 130.5 |
| A | 13 | 248 | 7882 | 55.68 | 628 | 615 | 130.5 |
| B | 0 | 190 | 65551 | 528.59 | 622 | 605 | 122.9 |
| B | 0 | 229 | 30910 | 246.65 | 622 | 605 | 122.9 |
| B | 12 | 111 | 15567 | 121.77 | 622 | 605 | 122.9 |
| C | 0 | 10 | 808511 | 5755.85 | 591 | 596 | 140.4 |
| C | 15 | 214 | 229864 | 1633.38 | 591 | 596 | 140.4 |
| C | 12 | 249 | 5245 | 33.12 | 591 | 596 | 140.4 |
| D | 12 | 217 | 937809 | 6336.85 | 596 | 580 | 147.9 |
| D | 1 | 52 | 234577 | 1582.11 | 596 | 580 | 147.9 |
| D | 13 | 249 | 217739 | 1468.27 | 596 | 580 | 147.9 |
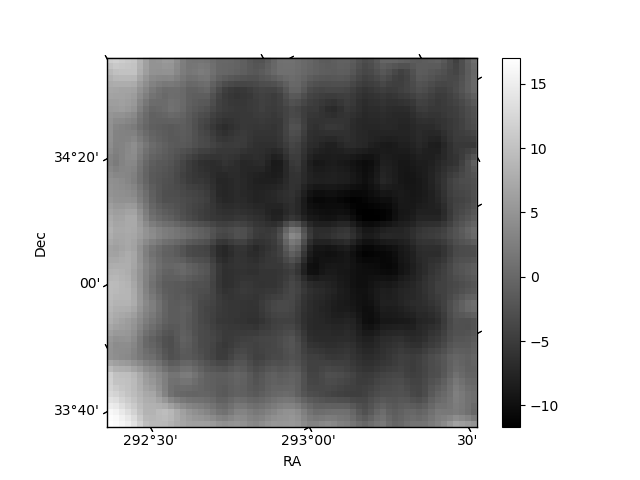
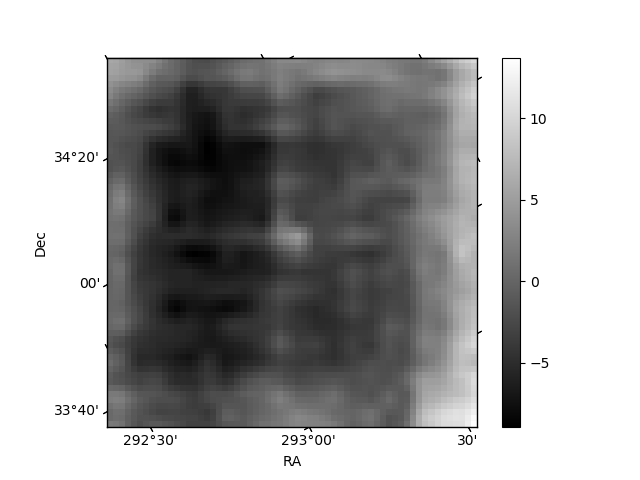
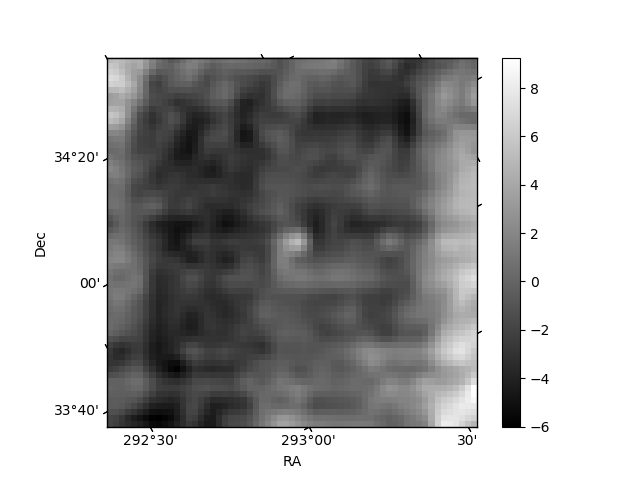
Histogram calculated using DETX and DETY for each event in the final _common_clean file
| Quadrant A | 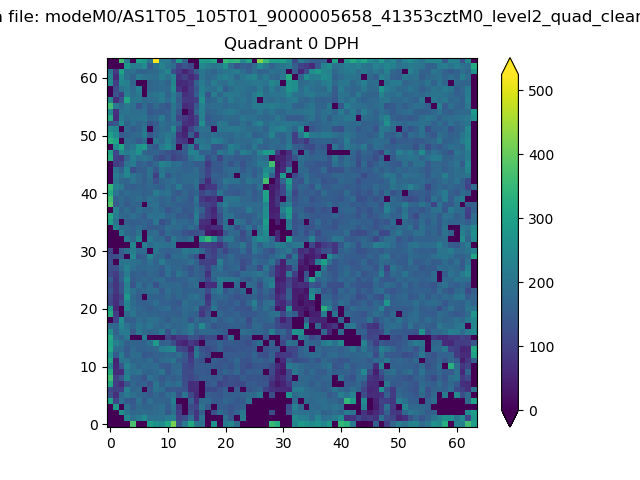 |
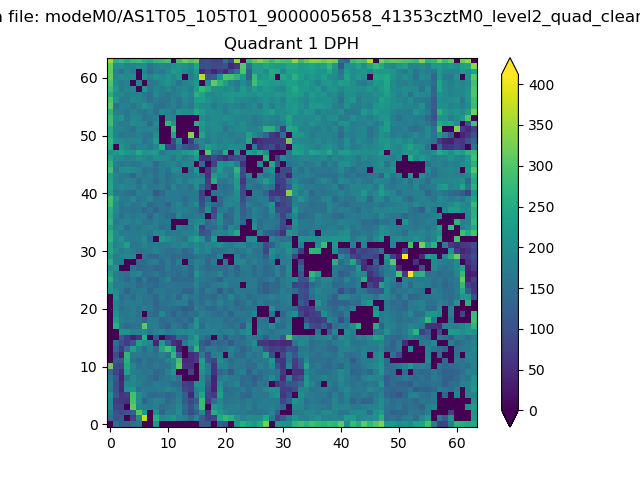 |
Quadrant B |
|---|---|---|---|
| Quadrant D | 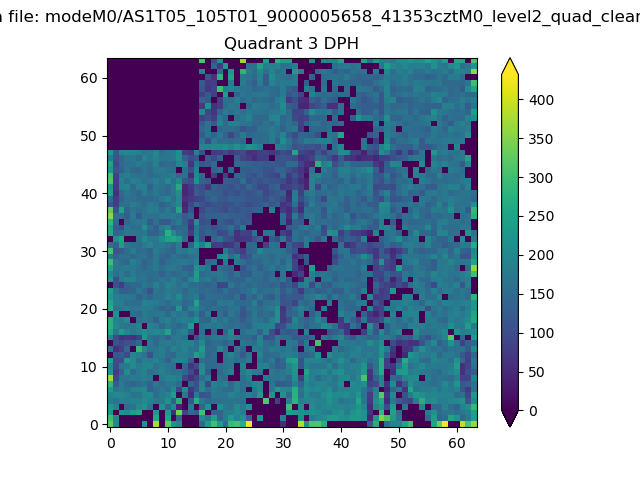 |
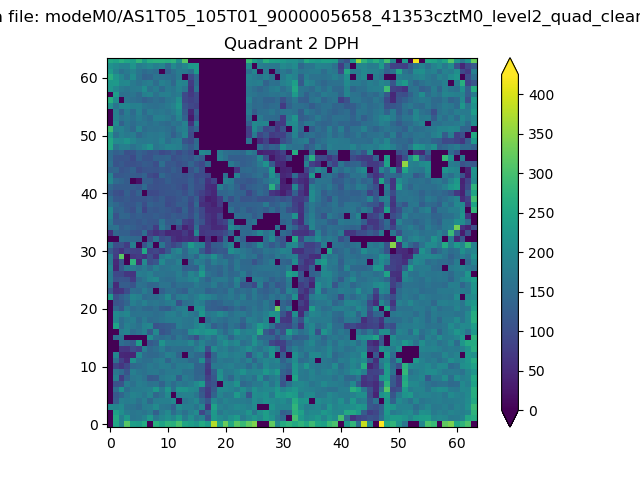 |
Quadrant C |
| Plot type | Count rate plots | Images |
|---|---|---|
| Comparison with Poisson distribution Blue bars denote a histogram of data divided into 1 sec bins. Red curve is a Poisson curve with rate = median count rate of data. |
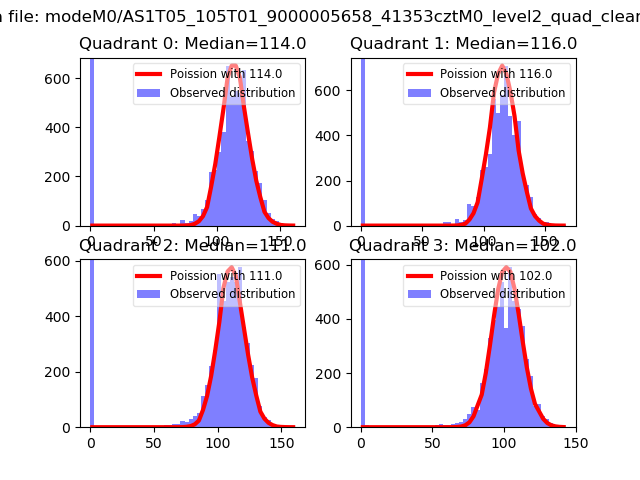 |
 |
| Quadrant-wise count rates Data is divided into 100 sec bins |
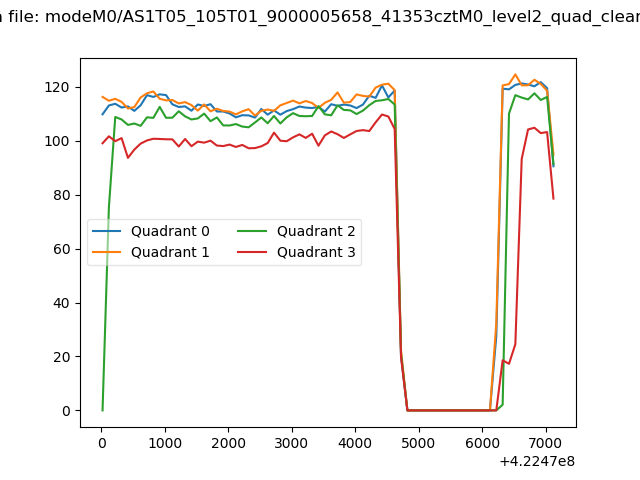 |
|
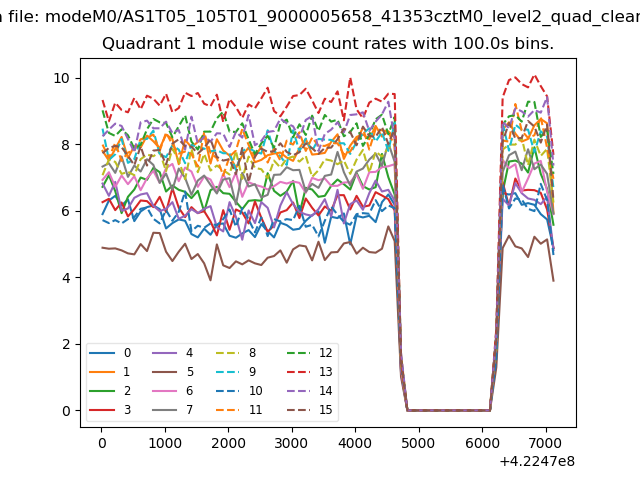
| Module-wise count rates for Quadrant A Data is divided into 100 sec bins |
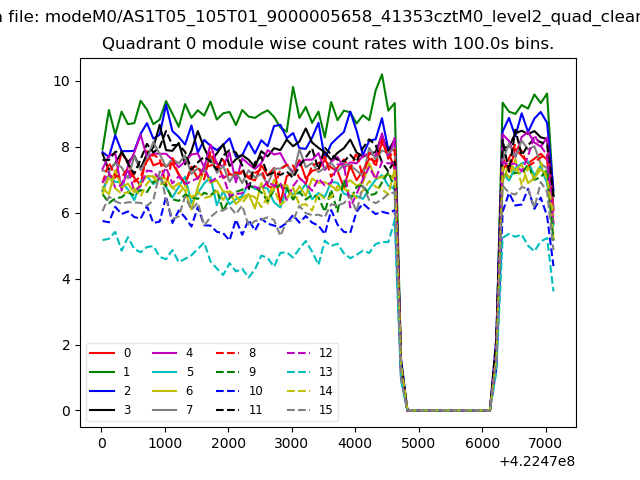 |
 |
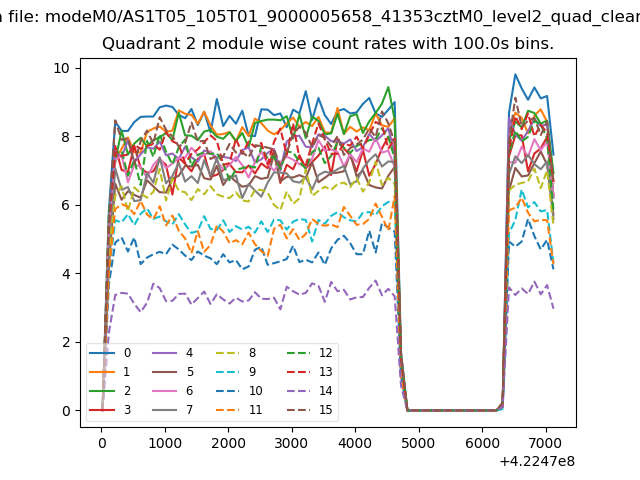
| Module-wise count rates for Quadrant B Data is divided into 100 sec bins |
 |
 |
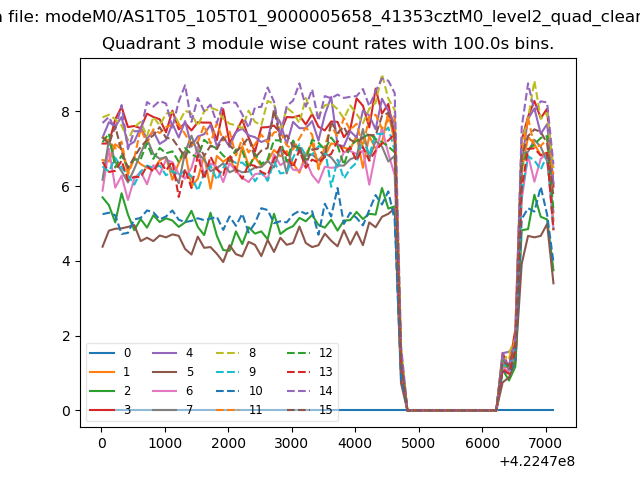
| Module-wise count rates for Quadrant C Data is divided into 100 sec bins |
 |
 |
| Module-wise count rates for Quadrant D Data is divided into 100 sec bins |
 |
 |
| Parameter | Plot |
|---|---|
| CZT HV Monitor | 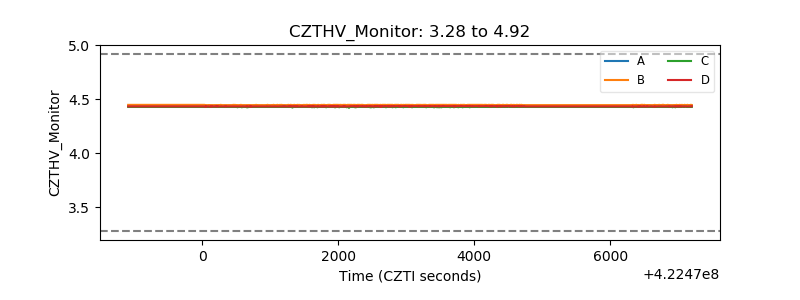 |
| D_VDD | 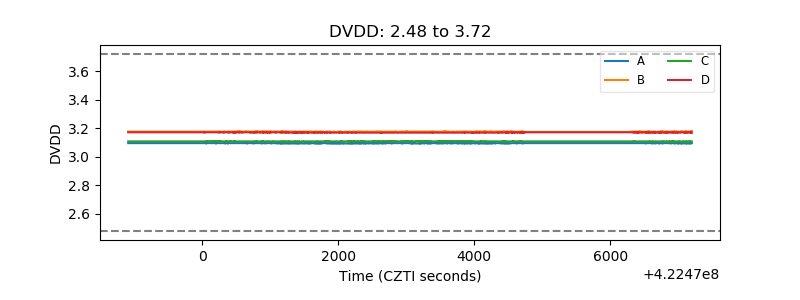 |
| Temperature 1 | 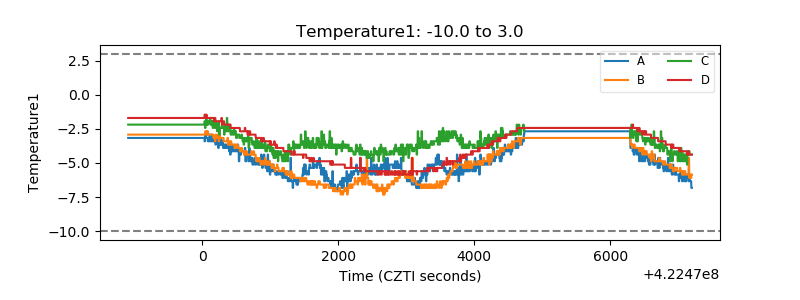 |
| Veto HV Monitor | 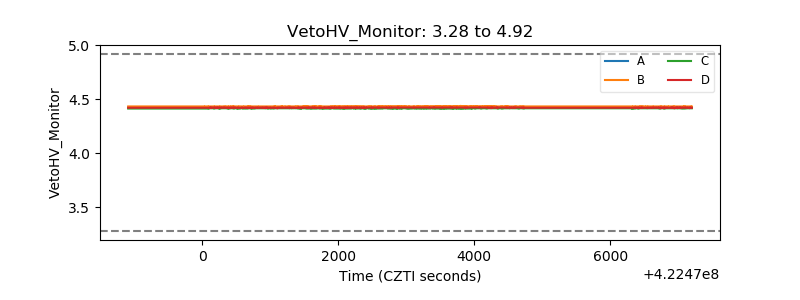 |
| Veto LLD | 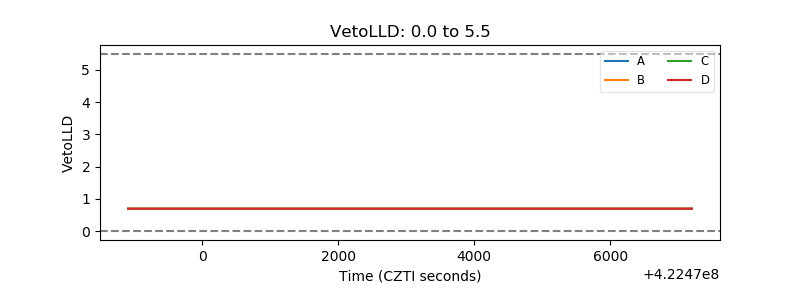 |
| Alpha Counter | 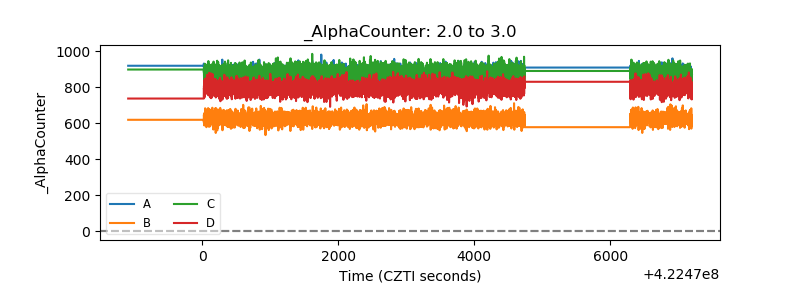 |
| _CPM_Rate | 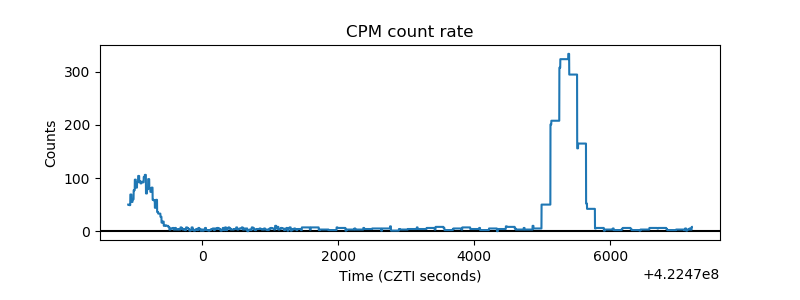 |
| CZT Counter | 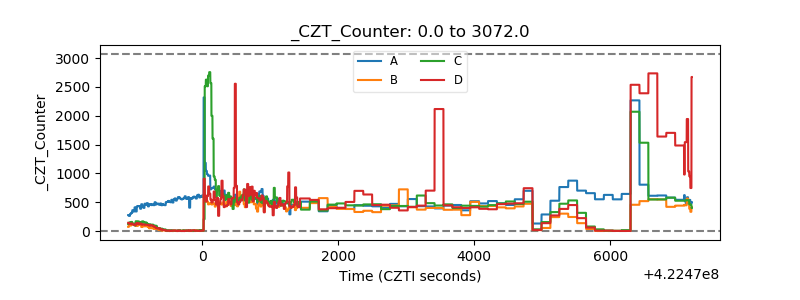 |
| +2.5 Volts monitor | 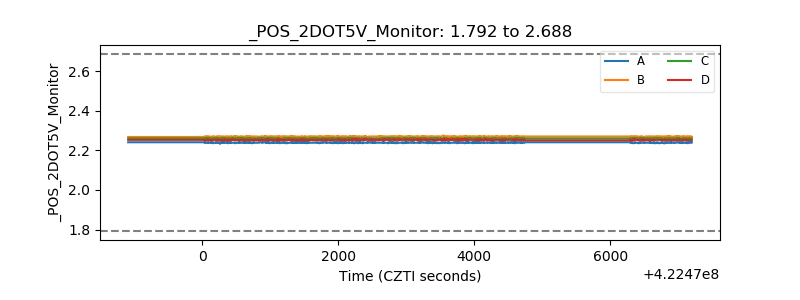 |
| +5 Volts monitor | 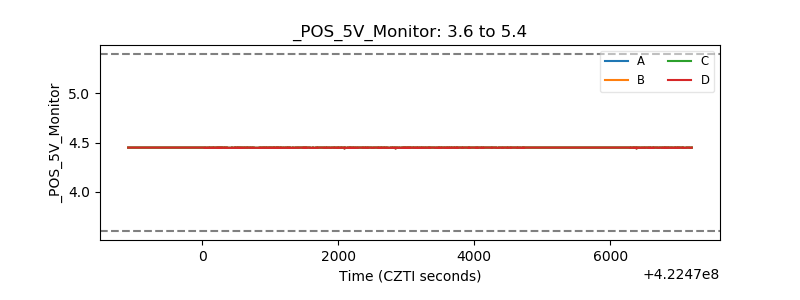 |
| _ROLL_ROT | 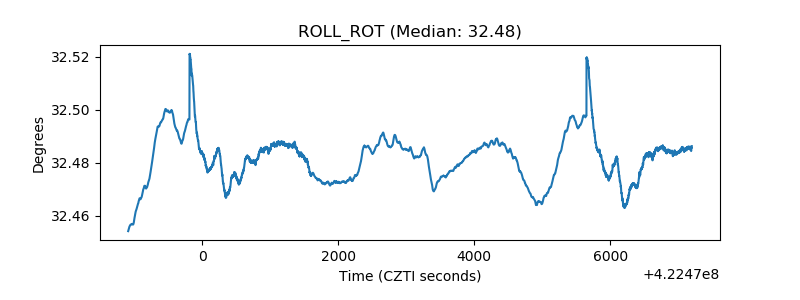 |
| _Roll_DEC |  |
| _Roll_RA | 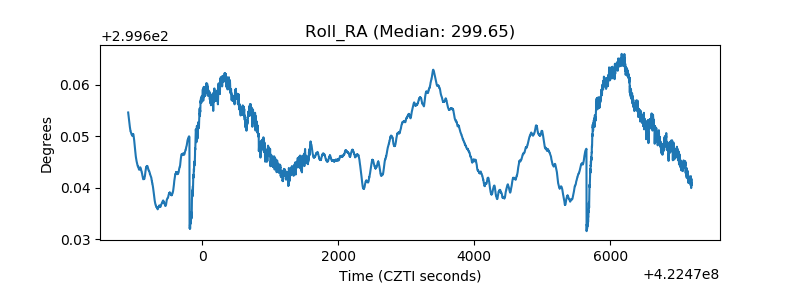 |
| Veto Counter | 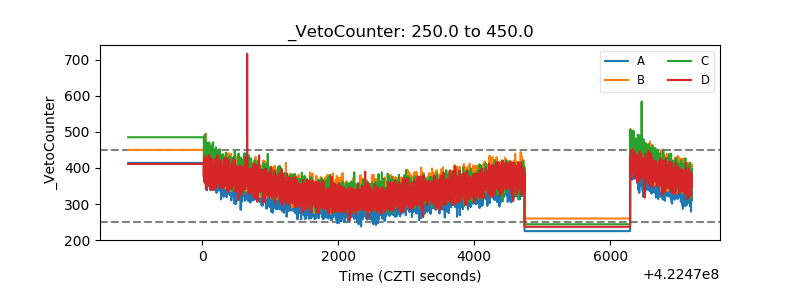 |