| Param | Original file | Final file |
|---|---|---|
| Filename | modeM0/AS1T05_105T01_9000005658_41354cztM0_level2.fits | modeM0/AS1T05_105T01_9000005658_41354cztM0_level2_quad_clean.evt |
| Size (bytes) | 396,446,400 | 100,512,000 |
| Size | 378.1 MB | 95.9 MB |
| Events in quadrant A | 3,173,253 | 692,550 |
| Events in quadrant B | 2,722,541 | 705,937 |
| Events in quadrant C | 3,562,706 | 644,495 |
| Events in quadrant D | 4,750,204 | 581,467 |
| Mode M9 | |||
|---|---|---|---|
| Quadrant | BADHDUFLAG | Total packets | Discarded packets |
| A | 0 | 32 | 0 |
| B | 0 | 32 | 0 |
| C | 0 | 32 | 0 |
| D | 0 | 32 | 0 |
| Mode SS | |||
|---|---|---|---|
| Quadrant | BADHDUFLAG | Total packets | Discarded packets |
| A | 0 | 126 | 0 |
| B | 0 | 126 | 0 |
| C | 0 | 126 | 0 |
| D | 0 | 126 | 0 |
| Mode M0 | |||
|---|---|---|---|
| Quadrant | BADHDUFLAG | Total packets | Discarded packets |
| A | 0 | 13091 | 3 |
| B | 0 | 12241 | 2 |
| C | 0 | 14110 | 2 |
| D | 0 | 18289 | 2 |
| Quadrant | Total seconds | Saturated seconds | Saturation percentage |
|---|---|---|---|
| A | 5995 | 15 | 0.250209% |
| B | 5995 | 17 | 0.283570% |
| C | 5995 | 273 | 4.553795% |
| D | 5995 | 456 | 7.606339% |
Noise dominated data is calculated using 1-second bins in cleaned event files. If a bin has >2000 counts, and if more than 50% of those come from <1% of pixels, then it is considered to be noise-dominated and hence unusable.
| Quadrant | # 1 sec bins | Bins with >0 counts | Bins with >2000 counts | High rate bins dominated by noise | Noise dominated (total time) | Noise dominated (detector-on time) | Marked lightcurve |
|---|---|---|---|---|---|---|---|
| A | 9250 | 5997 | 6 | 6 | 0.06% | 0.10% | 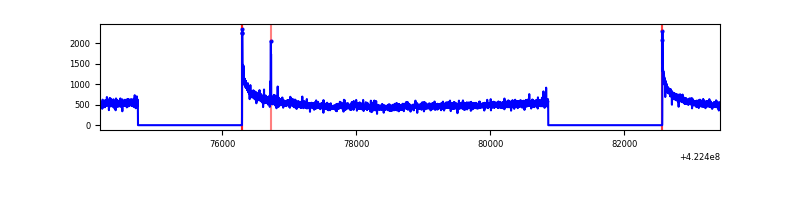 |
| B | 9249 | 5995 | 3 | 3 | 0.03% | 0.05% | 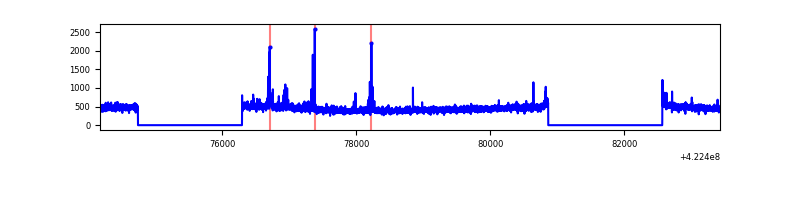 |
| C | 9250 | 5995 | 253 | 253 | 2.74% | 4.22% | 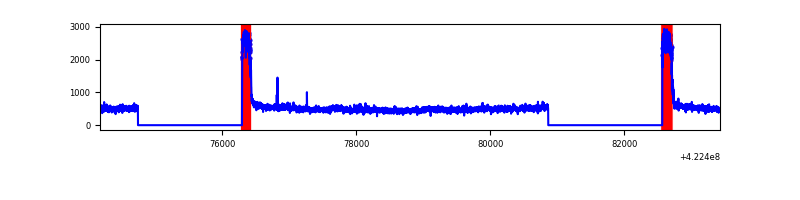 |
| D | 9250 | 5996 | 457 | 457 | 4.94% | 7.62% | 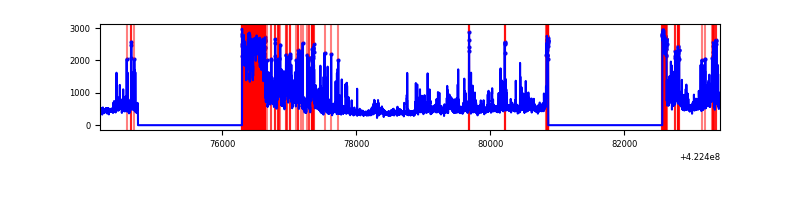 |
Top three noisy pixels from each quadrant. If the there are fewer than three noisy pixels in the level2.evt file, extra rows are filled as -1
| Pixel properties | Quadrant properties | ||||||
|---|---|---|---|---|---|---|---|
| Quadrant | DetID | PixID | Counts | Sigma | Mean | Median | Sigma |
| A | 10 | 83 | 543205 | 3916.41 | 670 | 657 | 138.5 |
| A | 12 | 189 | 24536 | 172.37 | 670 | 657 | 138.5 |
| A | 13 | 248 | 7969 | 52.78 | 670 | 657 | 138.5 |
| B | 0 | 190 | 49635 | 377.64 | 666 | 648 | 129.7 |
| B | 5 | 255 | 19856 | 148.07 | 666 | 648 | 129.7 |
| B | 0 | 189 | 17396 | 129.11 | 666 | 648 | 129.7 |
| C | 0 | 10 | 825662 | 5537.46 | 633 | 637 | 149.0 |
| C | 15 | 214 | 246451 | 1649.87 | 633 | 637 | 149.0 |
| C | 14 | 67 | 16906 | 109.2 | 633 | 637 | 149.0 |
| D | 12 | 217 | 1228380 | 7897.99 | 631 | 612 | 155.5 |
| D | 1 | 52 | 341012 | 2189.73 | 631 | 612 | 155.5 |
| D | 13 | 249 | 340269 | 2184.95 | 631 | 612 | 155.5 |
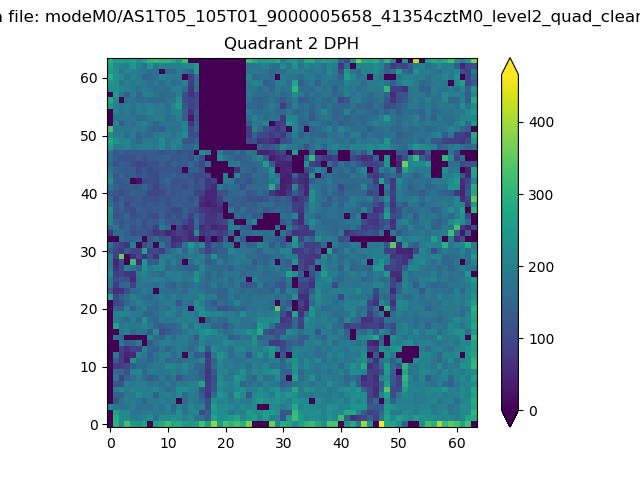
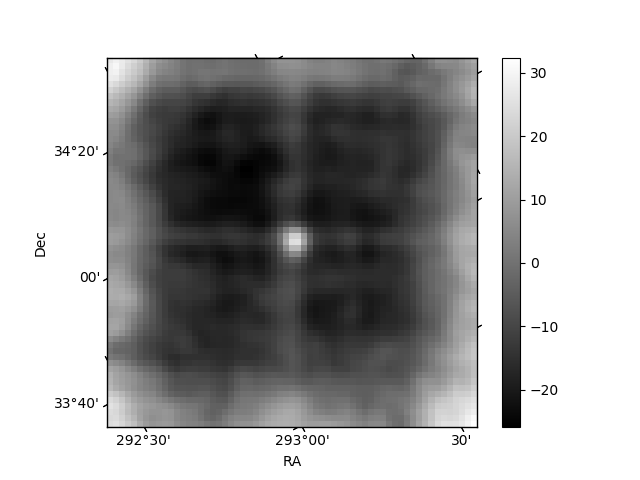
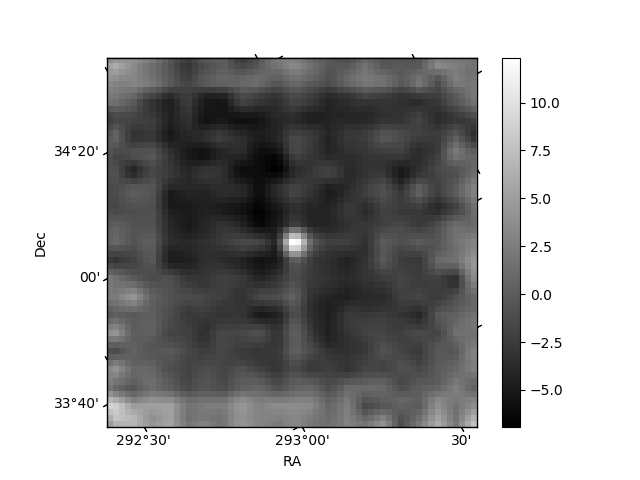
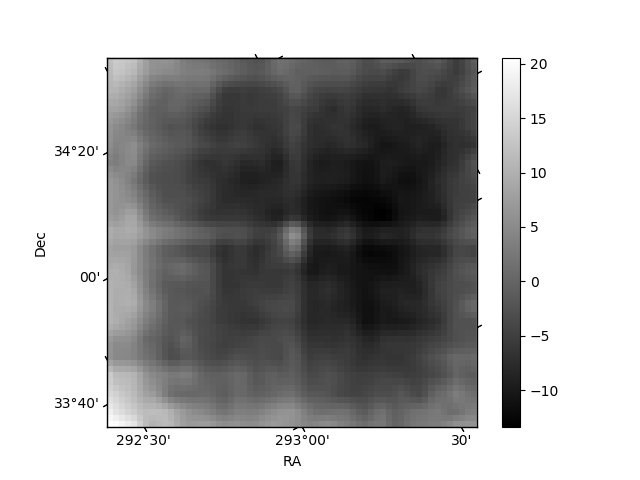
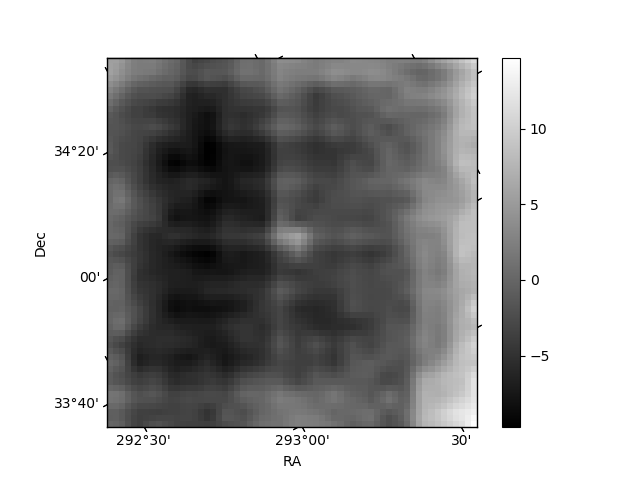
Histogram calculated using DETX and DETY for each event in the final _common_clean file
| Quadrant A | 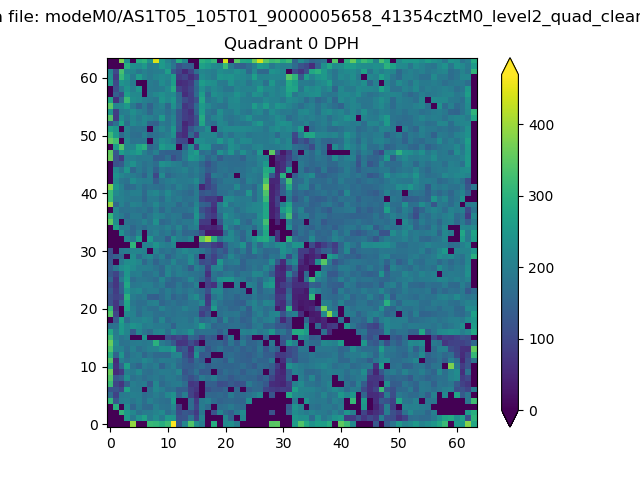 |
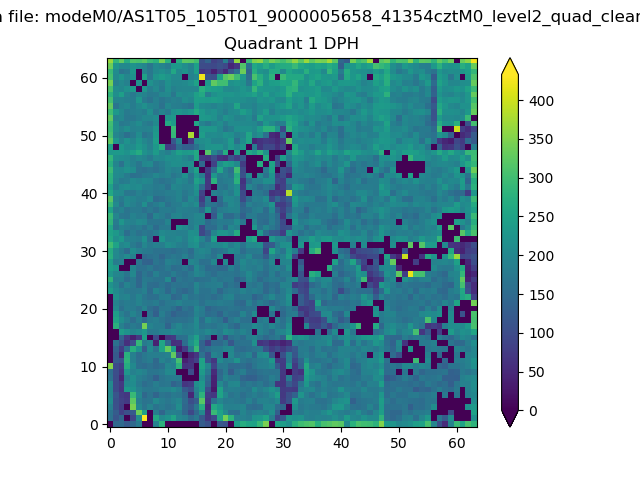 |
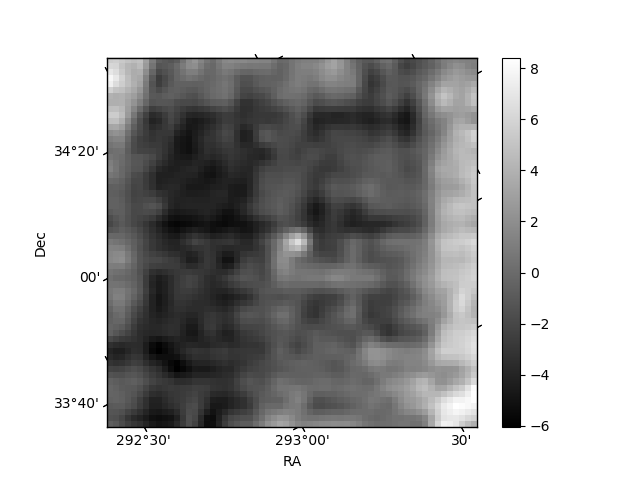
Quadrant B |
|---|---|---|---|
| Quadrant D | 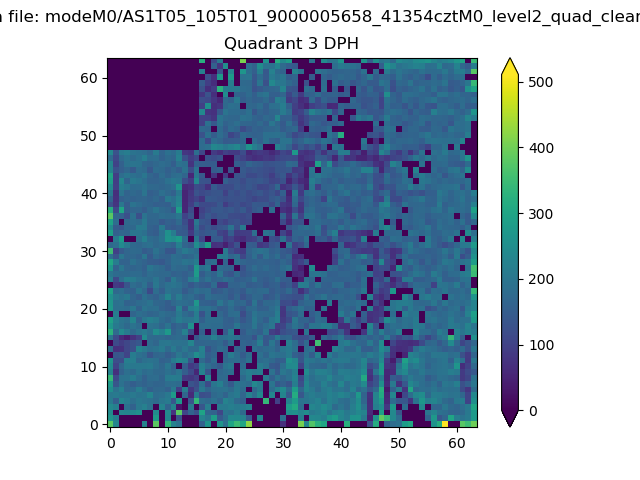 |
 |
Quadrant C |
| Plot type | Count rate plots | Images |
|---|---|---|
| Comparison with Poisson distribution Blue bars denote a histogram of data divided into 1 sec bins. Red curve is a Poisson curve with rate = median count rate of data. |
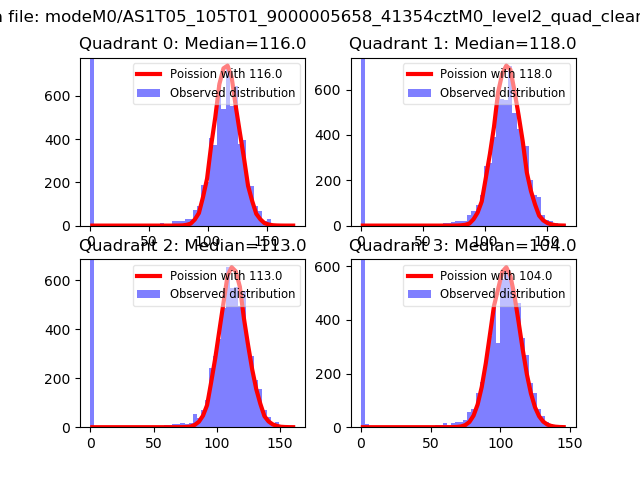 |
 |
| Quadrant-wise count rates Data is divided into 100 sec bins |
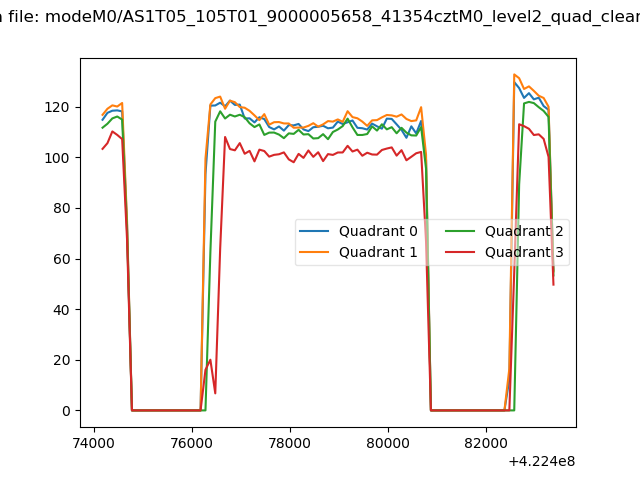 |
|
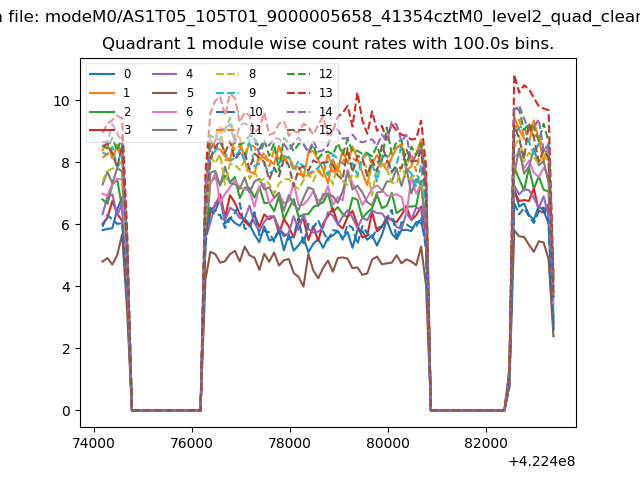
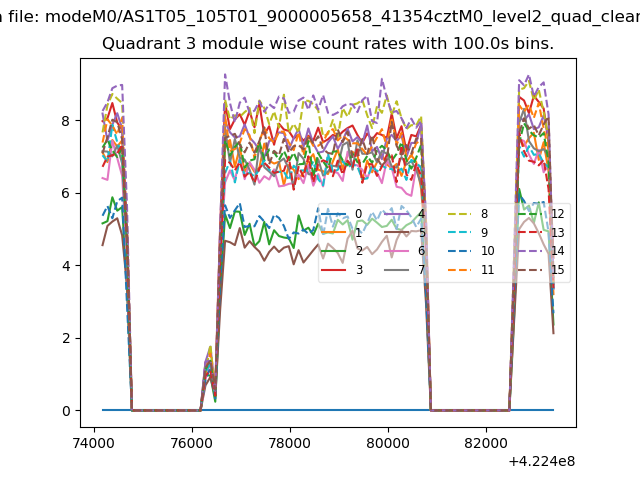
| Module-wise count rates for Quadrant A Data is divided into 100 sec bins |
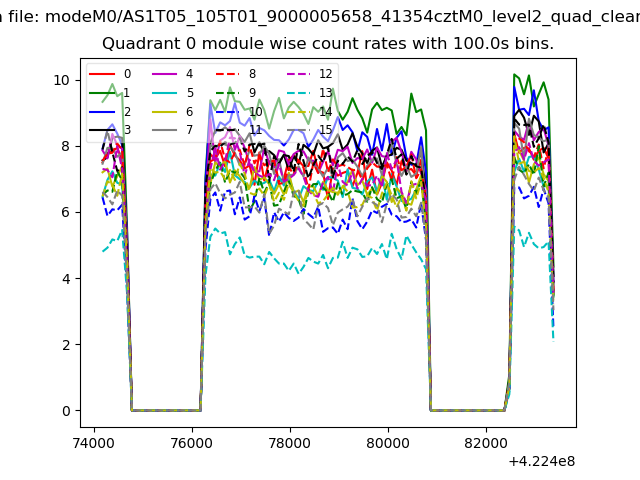 |
 |
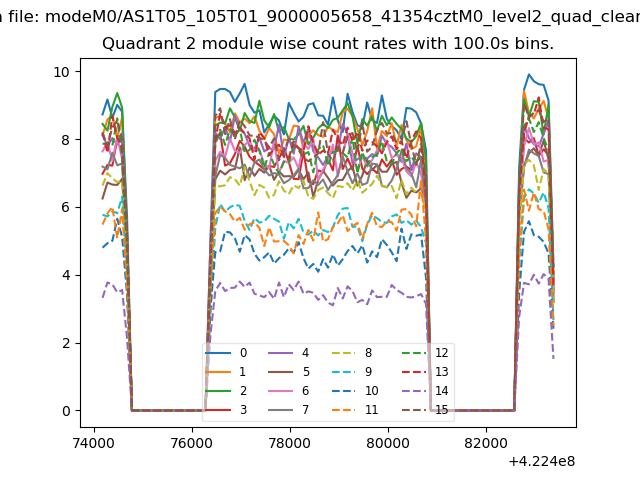
| Module-wise count rates for Quadrant B Data is divided into 100 sec bins |
 |
 |
| Module-wise count rates for Quadrant C Data is divided into 100 sec bins |
 |
 |
| Module-wise count rates for Quadrant D Data is divided into 100 sec bins |
 |
 |
| Parameter | Plot |
|---|---|
| CZT HV Monitor | 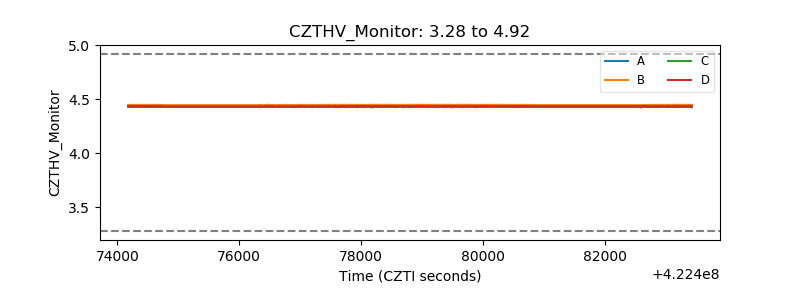 |
| D_VDD | 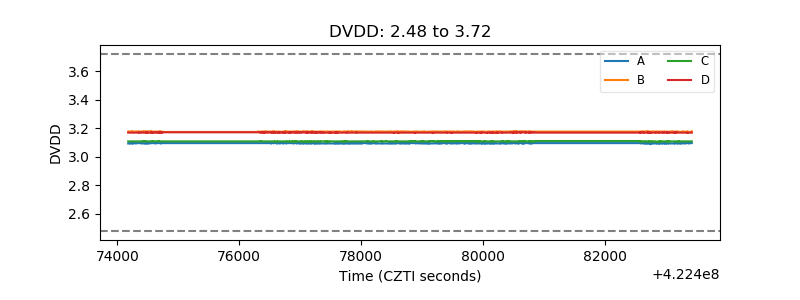 |
| Temperature 1 | 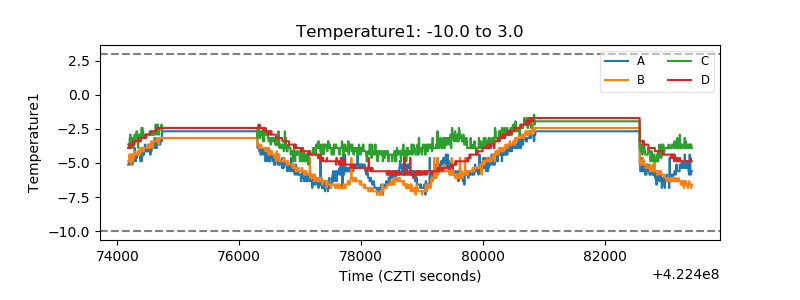 |
| Veto HV Monitor | 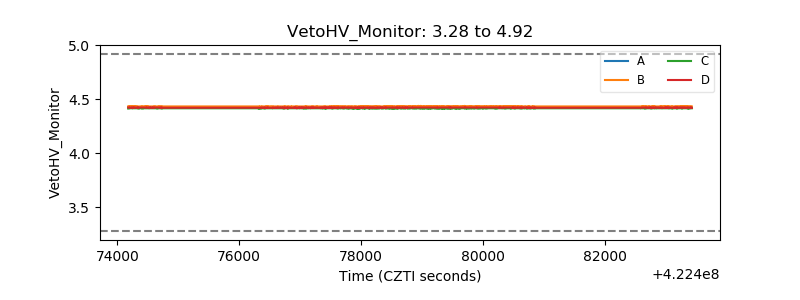 |
| Veto LLD | 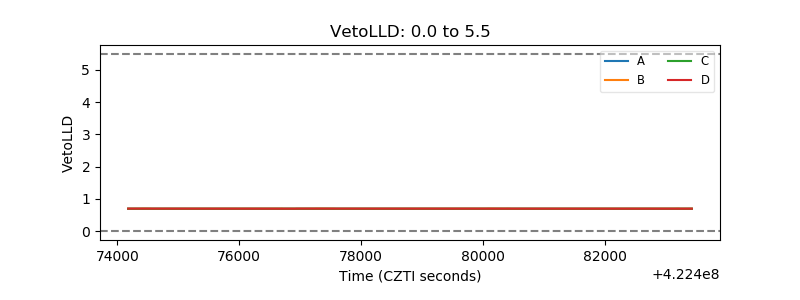 |
| Alpha Counter | 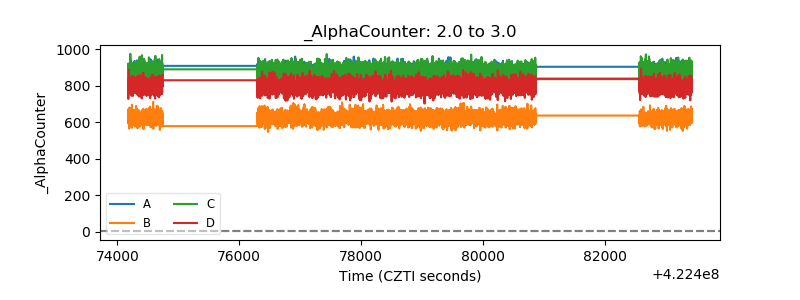 |
| _CPM_Rate | 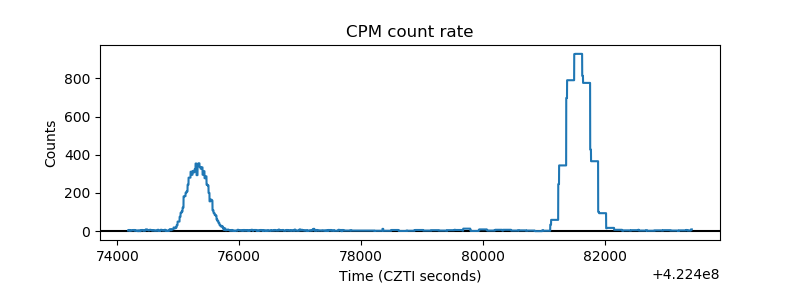 |
| CZT Counter | 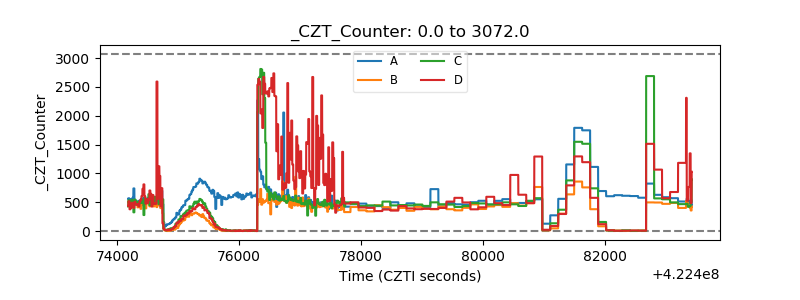 |
| +2.5 Volts monitor | 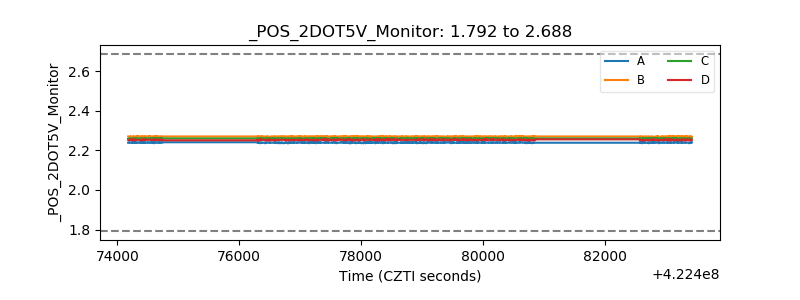 |
| +5 Volts monitor | 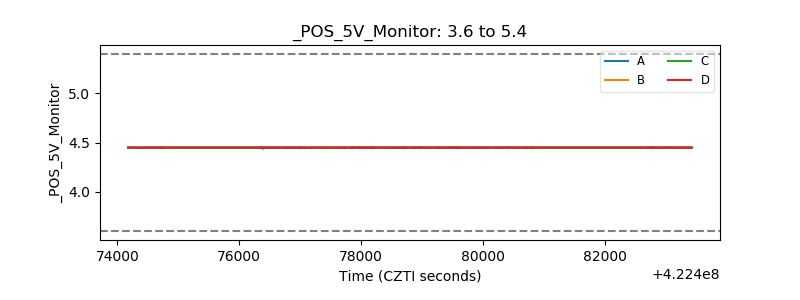 |
| _ROLL_ROT | 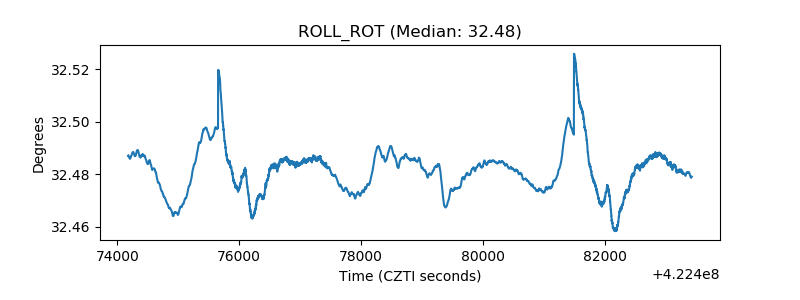 |
| _Roll_DEC | 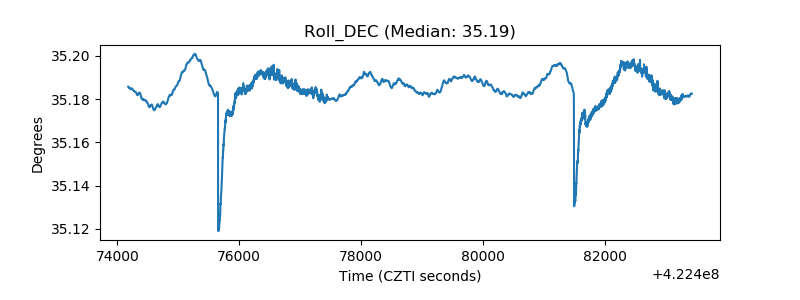 |
| _Roll_RA | 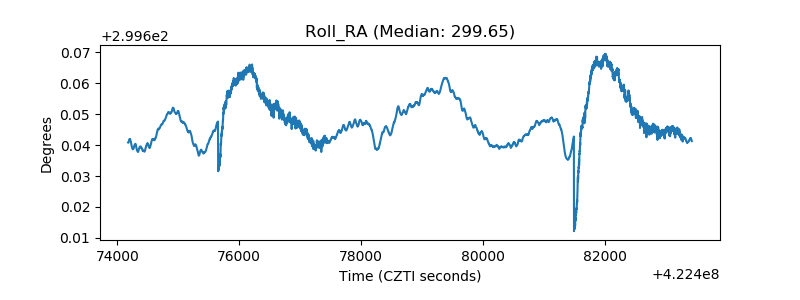 |
| Veto Counter | 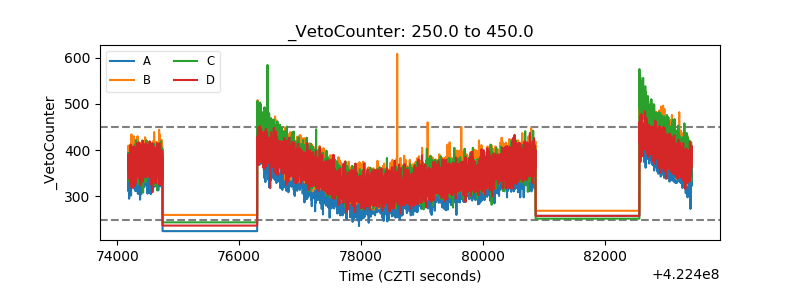 |