| Param | Original file | Final file |
|---|---|---|
| Filename | modeM0/AS1T05_105T01_9000005658_41356cztM0_level2.fits | modeM0/AS1T05_105T01_9000005658_41356cztM0_level2_quad_clean.evt |
| Size (bytes) | 383,160,960 | 96,600,960 |
| Size | 365.4 MB | 92.1 MB |
| Events in quadrant A | 2,965,921 | 662,514 |
| Events in quadrant B | 2,552,105 | 682,337 |
| Events in quadrant C | 3,337,827 | 616,138 |
| Events in quadrant D | 4,884,865 | 566,350 |
| Mode M9 | |||
|---|---|---|---|
| Quadrant | BADHDUFLAG | Total packets | Discarded packets |
| A | 0 | 34 | 0 |
| B | 0 | 34 | 0 |
| C | 0 | 34 | 0 |
| D | 0 | 34 | 0 |
| Mode SS | |||
|---|---|---|---|
| Quadrant | BADHDUFLAG | Total packets | Discarded packets |
| A | 0 | 118 | 0 |
| B | 0 | 118 | 0 |
| C | 0 | 118 | 0 |
| D | 0 | 118 | 0 |
| Mode M0 | |||
|---|---|---|---|
| Quadrant | BADHDUFLAG | Total packets | Discarded packets |
| A | 0 | 12326 | 3 |
| B | 0 | 11567 | 2 |
| C | 0 | 13384 | 2 |
| D | 0 | 18365 | 2 |
| Quadrant | Total seconds | Saturated seconds | Saturation percentage |
|---|---|---|---|
| A | 5689 | 18 | 0.316400% |
| B | 5689 | 12 | 0.210933% |
| C | 5689 | 269 | 4.728423% |
| D | 5689 | 367 | 6.451046% |
Noise dominated data is calculated using 1-second bins in cleaned event files. If a bin has >2000 counts, and if more than 50% of those come from <1% of pixels, then it is considered to be noise-dominated and hence unusable.
| Quadrant | # 1 sec bins | Bins with >0 counts | Bins with >2000 counts | High rate bins dominated by noise | Noise dominated (total time) | Noise dominated (detector-on time) | Marked lightcurve |
|---|---|---|---|---|---|---|---|
| A | 9185 | 5691 | 4 | 4 | 0.04% | 0.07% | 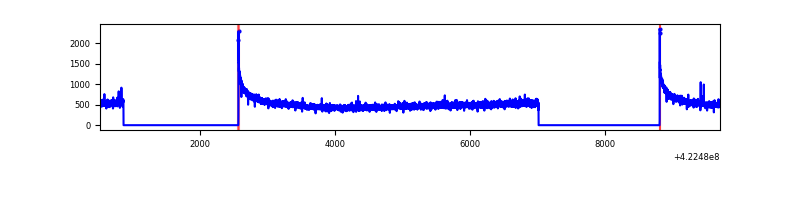 |
| B | 9185 | 5690 | 0 | 0 | 0.00% | 0.00% | 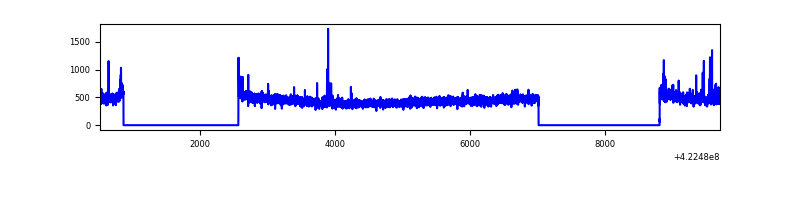 |
| C | 9185 | 5690 | 257 | 257 | 2.80% | 4.52% | 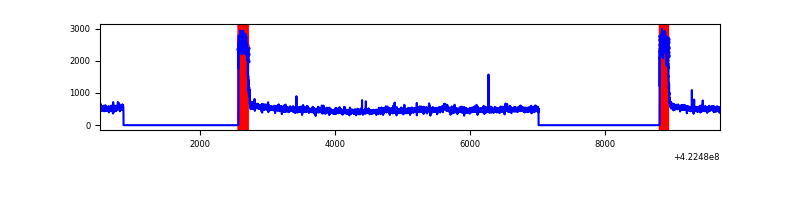 |
| D | 9185 | 5691 | 392 | 392 | 4.27% | 6.89% | 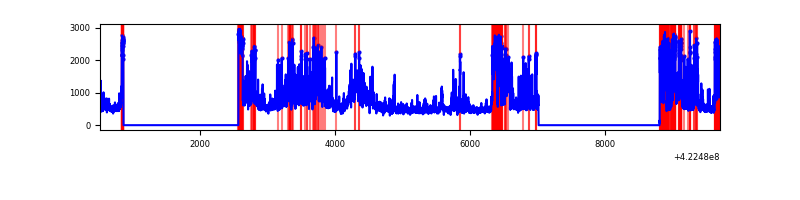 |
Top three noisy pixels from each quadrant. If the there are fewer than three noisy pixels in the level2.evt file, extra rows are filled as -1
| Pixel properties | Quadrant properties | ||||||
|---|---|---|---|---|---|---|---|
| Quadrant | DetID | PixID | Counts | Sigma | Mean | Median | Sigma |
| A | 10 | 83 | 515361 | 3939.98 | 632 | 619 | 130.6 |
| A | 13 | 6 | 7700 | 54.2 | 632 | 619 | 130.6 |
| A | 3 | 137 | 7136 | 49.88 | 632 | 619 | 130.6 |
| B | 5 | 255 | 31474 | 251.17 | 631 | 613 | 122.9 |
| B | 0 | 190 | 19257 | 151.74 | 631 | 613 | 122.9 |
| B | 12 | 111 | 15731 | 123.04 | 631 | 613 | 122.9 |
| C | 0 | 10 | 756160 | 5437.9 | 597 | 601 | 138.9 |
| C | 15 | 214 | 233858 | 1678.8 | 597 | 601 | 138.9 |
| C | 14 | 67 | 11086 | 75.46 | 597 | 601 | 138.9 |
| D | 5 | 222 | 800265 | 5439.42 | 599 | 583 | 147.0 |
| D | 1 | 47 | 756086 | 5138.91 | 599 | 583 | 147.0 |
| D | 13 | 249 | 267096 | 1812.82 | 599 | 583 | 147.0 |
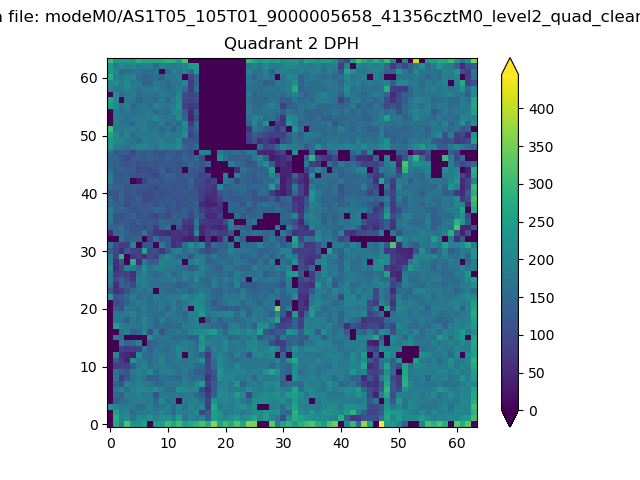
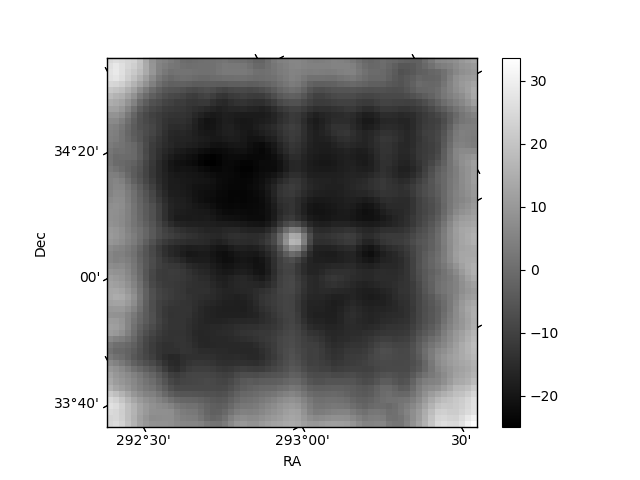
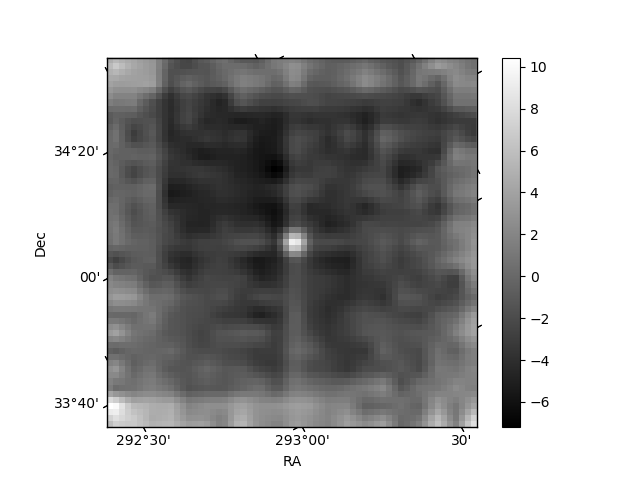
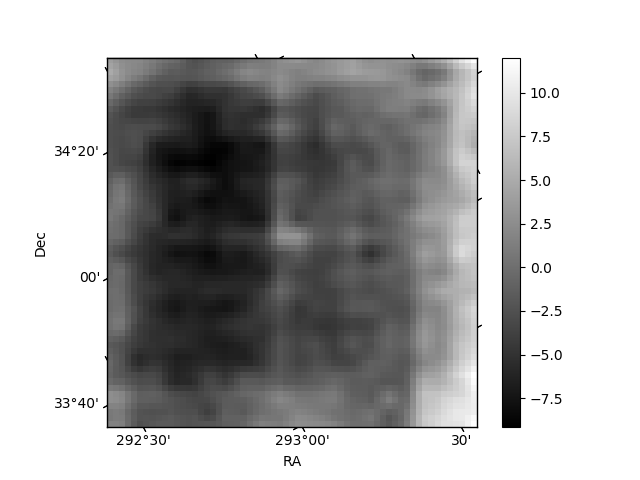
Histogram calculated using DETX and DETY for each event in the final _common_clean file
| Quadrant A | 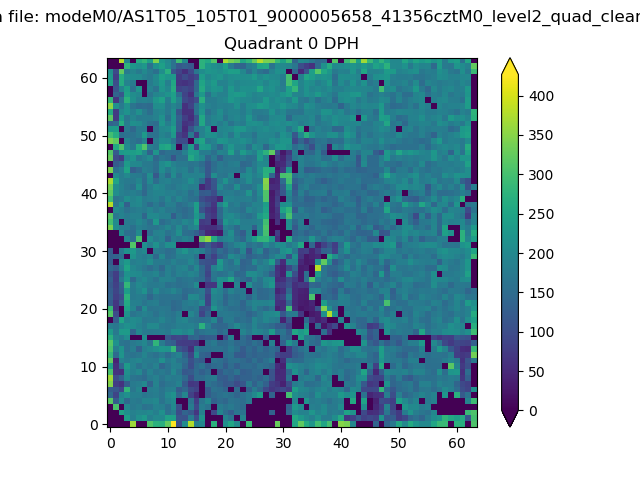 |
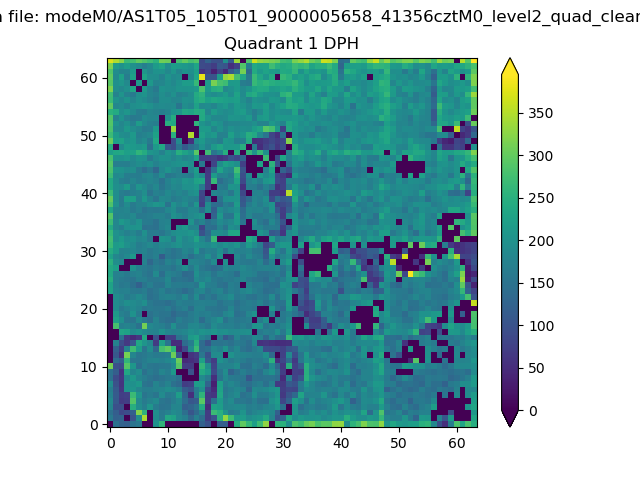 |
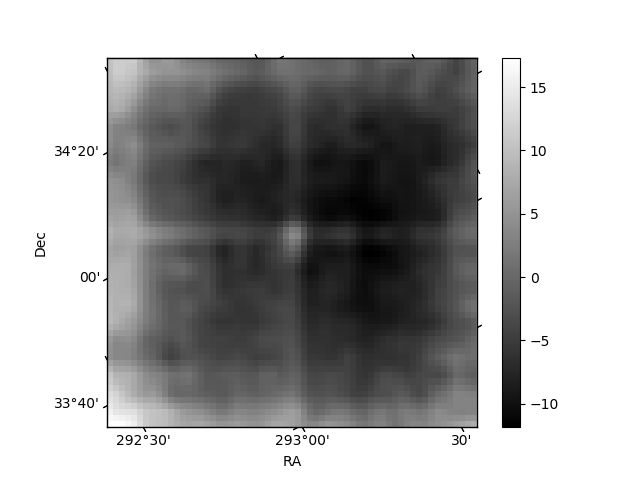
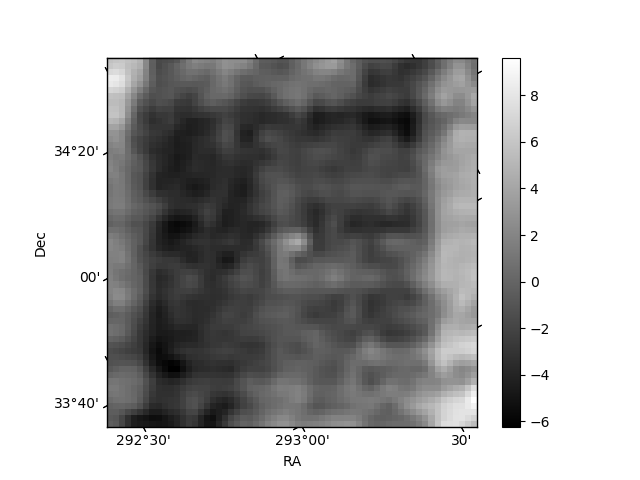
Quadrant B |
|---|---|---|---|
| Quadrant D | 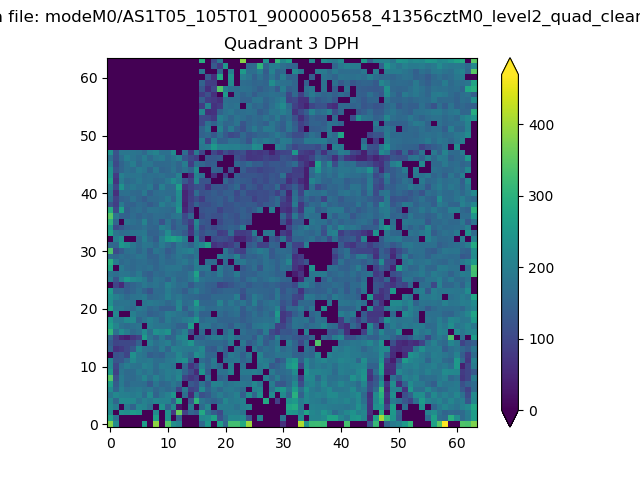 |
 |
Quadrant C |
| Plot type | Count rate plots | Images |
|---|---|---|
| Comparison with Poisson distribution Blue bars denote a histogram of data divided into 1 sec bins. Red curve is a Poisson curve with rate = median count rate of data. |
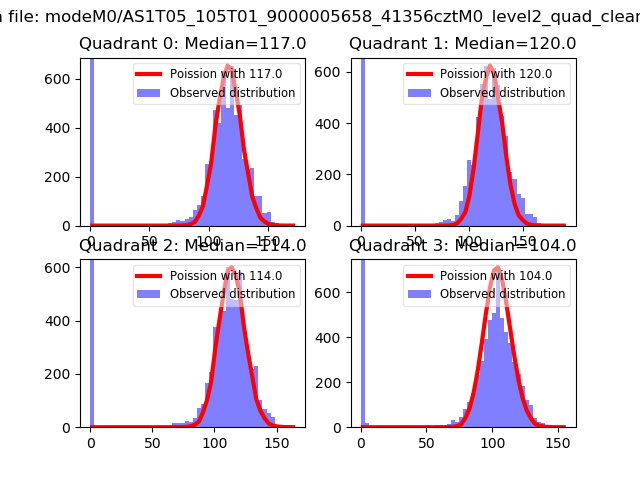 |
 |
| Quadrant-wise count rates Data is divided into 100 sec bins |
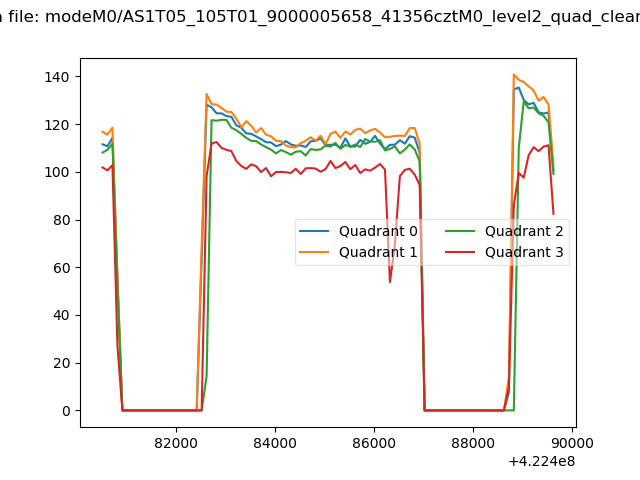 |
|
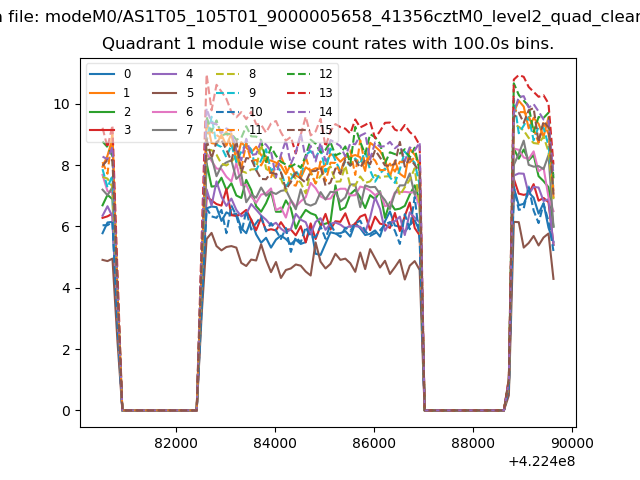
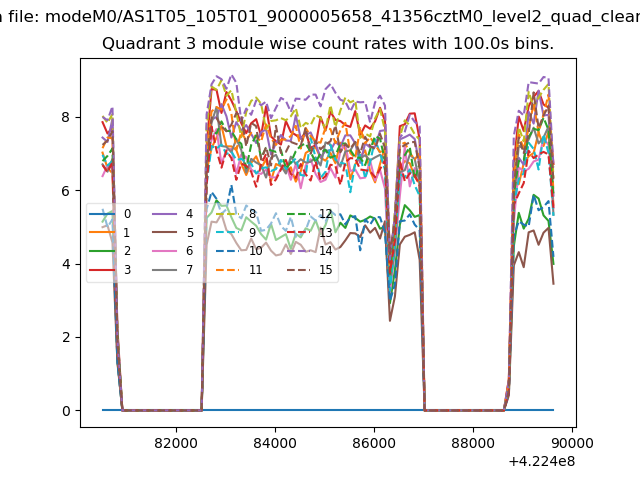
| Module-wise count rates for Quadrant A Data is divided into 100 sec bins |
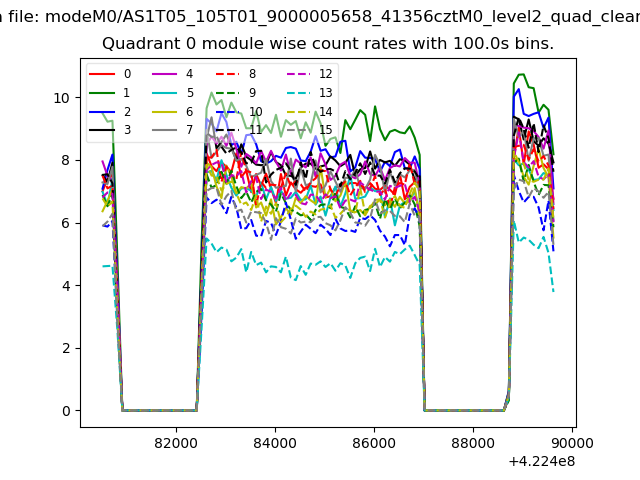 |
 |
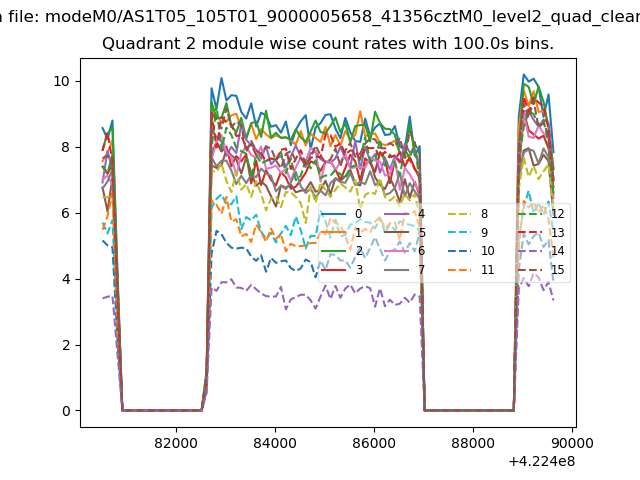
| Module-wise count rates for Quadrant B Data is divided into 100 sec bins |
 |
 |
| Module-wise count rates for Quadrant C Data is divided into 100 sec bins |
 |
 |
| Module-wise count rates for Quadrant D Data is divided into 100 sec bins |
 |
 |
| Parameter | Plot |
|---|---|
| CZT HV Monitor | 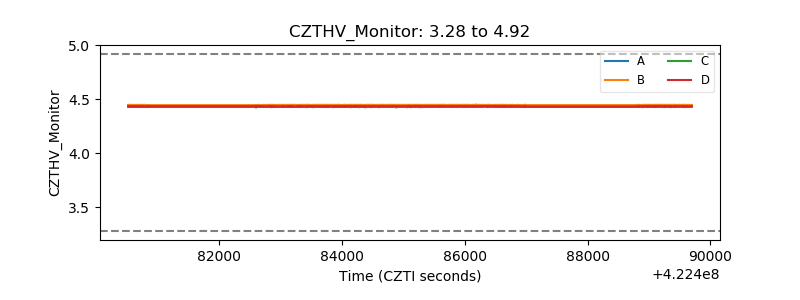 |
| D_VDD | 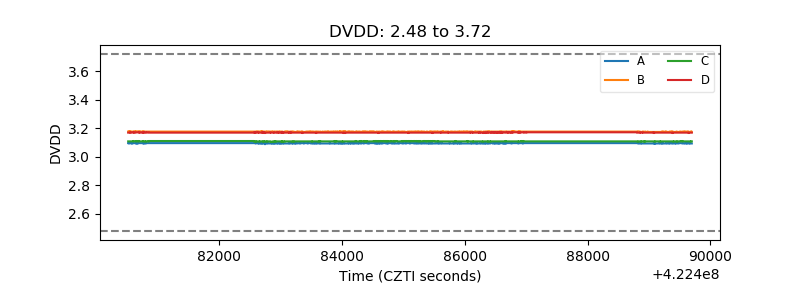 |
| Temperature 1 | 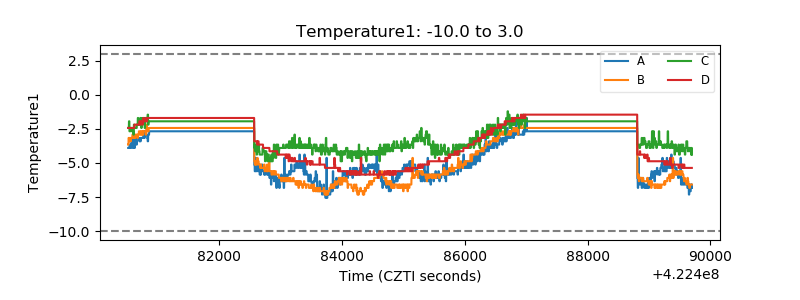 |
| Veto HV Monitor | 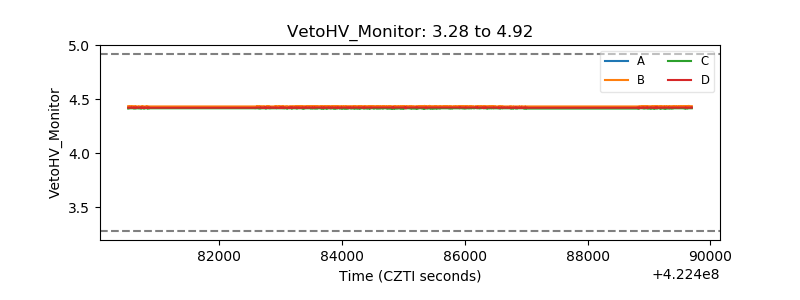 |
| Veto LLD | 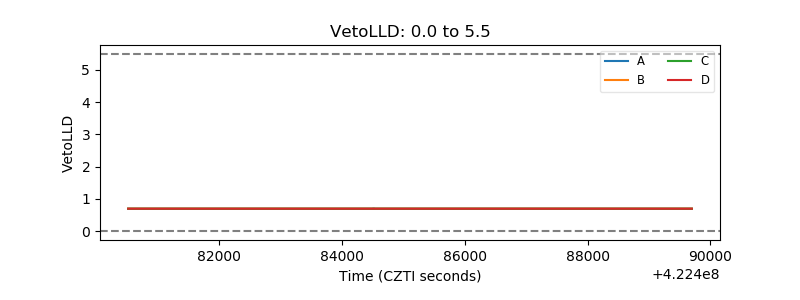 |
| Alpha Counter | 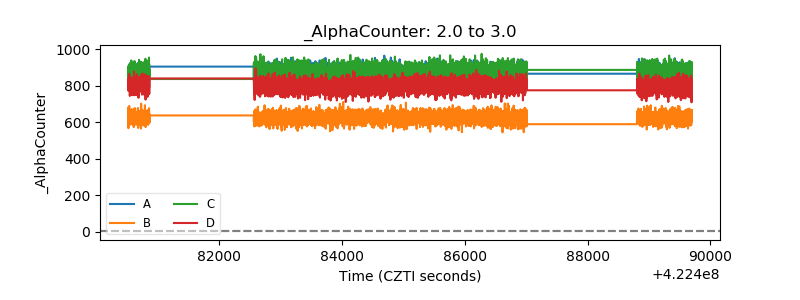 |
| _CPM_Rate | 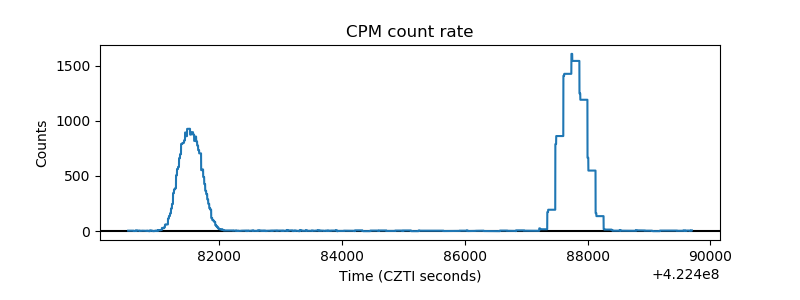 |
| CZT Counter |  |
| +2.5 Volts monitor |  |
| +5 Volts monitor |  |
| _ROLL_ROT | 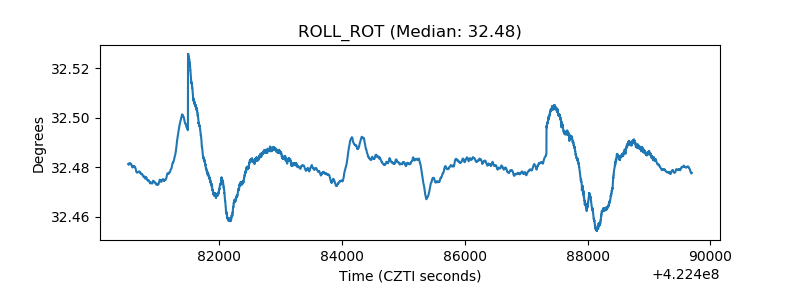 |
| _Roll_DEC |  |
| _Roll_RA | 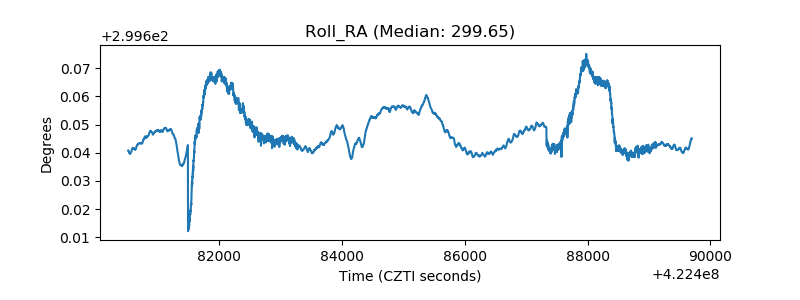 |
| Veto Counter | 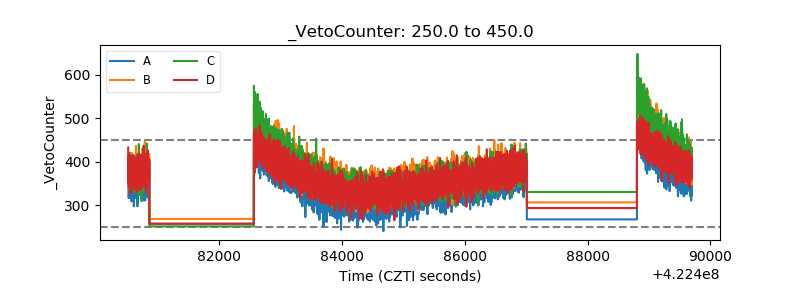 |