| Param | Original file | Final file |
|---|---|---|
| Filename | modeM0/AS1T05_105T01_9000005658_41357cztM0_level2.fits | modeM0/AS1T05_105T01_9000005658_41357cztM0_level2_quad_clean.evt |
| Size (bytes) | 332,337,600 | 89,328,960 |
| Size | 316.9 MB | 85.2 MB |
| Events in quadrant A | 2,720,937 | 614,177 |
| Events in quadrant B | 2,426,125 | 630,472 |
| Events in quadrant C | 3,026,499 | 571,576 |
| Events in quadrant D | 3,730,838 | 530,678 |
| Mode M9 | |||
|---|---|---|---|
| Quadrant | BADHDUFLAG | Total packets | Discarded packets |
| A | 0 | 28 | 0 |
| B | 0 | 28 | 0 |
| C | 0 | 28 | 0 |
| D | 0 | 29 | 0 |
| Mode SS | |||
|---|---|---|---|
| Quadrant | BADHDUFLAG | Total packets | Discarded packets |
| A | 0 | 106 | 0 |
| B | 0 | 106 | 0 |
| C | 0 | 106 | 0 |
| D | 0 | 106 | 0 |
| Mode M0 | |||
|---|---|---|---|
| Quadrant | BADHDUFLAG | Total packets | Discarded packets |
| A | 0 | 11177 | 3 |
| B | 0 | 10682 | 2 |
| C | 0 | 12100 | 2 |
| D | 0 | 14629 | 2 |
| Quadrant | Total seconds | Saturated seconds | Saturation percentage |
|---|---|---|---|
| A | 5105 | 12 | 0.235064% |
| B | 5105 | 37 | 0.724780% |
| C | 5105 | 249 | 4.877571% |
| D | 5105 | 233 | 4.564153% |
Noise dominated data is calculated using 1-second bins in cleaned event files. If a bin has >2000 counts, and if more than 50% of those come from <1% of pixels, then it is considered to be noise-dominated and hence unusable.
| Quadrant | # 1 sec bins | Bins with >0 counts | Bins with >2000 counts | High rate bins dominated by noise | Noise dominated (total time) | Noise dominated (detector-on time) | Marked lightcurve |
|---|---|---|---|---|---|---|---|
| A | 7048 | 5106 | 4 | 4 | 0.06% | 0.08% | 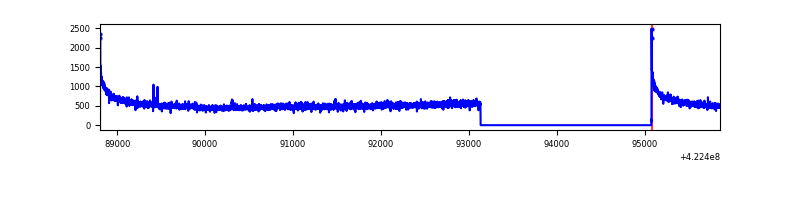 |
| B | 7048 | 5106 | 23 | 23 | 0.33% | 0.45% | 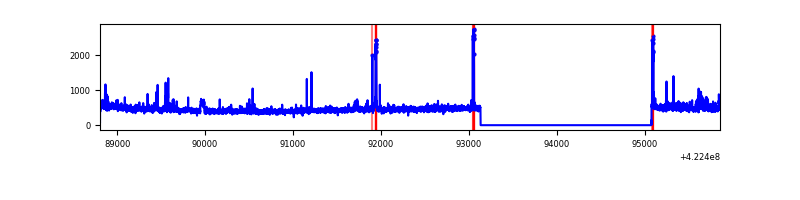 |
| C | 7048 | 5106 | 240 | 240 | 3.41% | 4.70% | 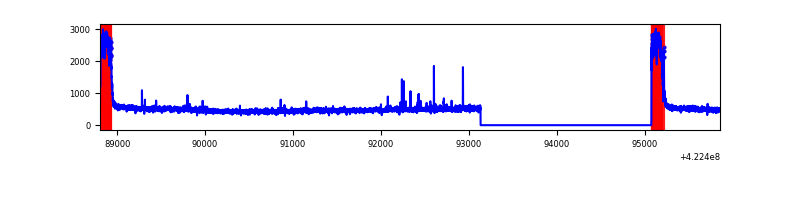 |
| D | 7048 | 5106 | 267 | 267 | 3.79% | 5.23% | 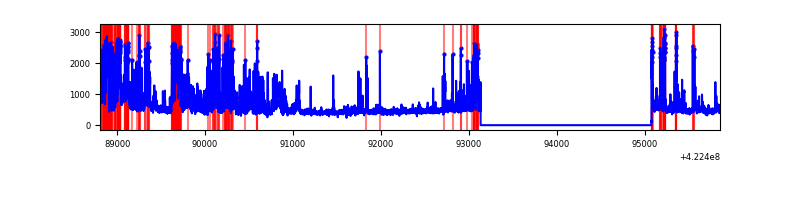 |
Top three noisy pixels from each quadrant. If the there are fewer than three noisy pixels in the level2.evt file, extra rows are filled as -1
| Pixel properties | Quadrant properties | ||||||
|---|---|---|---|---|---|---|---|
| Quadrant | DetID | PixID | Counts | Sigma | Mean | Median | Sigma |
| A | 10 | 83 | 484757 | 4169.88 | 569 | 559 | 116.1 |
| A | 12 | 189 | 31279 | 264.56 | 569 | 559 | 116.1 |
| A | 3 | 137 | 6376 | 50.1 | 569 | 559 | 116.1 |
| B | 5 | 255 | 117239 | 1074.78 | 569 | 554 | 108.6 |
| B | 0 | 190 | 47499 | 432.41 | 569 | 554 | 108.6 |
| B | 12 | 111 | 13788 | 121.9 | 569 | 554 | 108.6 |
| C | 0 | 10 | 686940 | 5425.91 | 540 | 545 | 126.5 |
| C | 15 | 214 | 210844 | 1662.4 | 540 | 545 | 126.5 |
| C | 15 | 111 | 15882 | 121.24 | 540 | 545 | 126.5 |
| D | 1 | 52 | 552065 | 4134.06 | 544 | 530 | 133.4 |
| D | 5 | 222 | 527013 | 3946.29 | 544 | 530 | 133.4 |
| D | 13 | 249 | 272581 | 2039.18 | 544 | 530 | 133.4 |
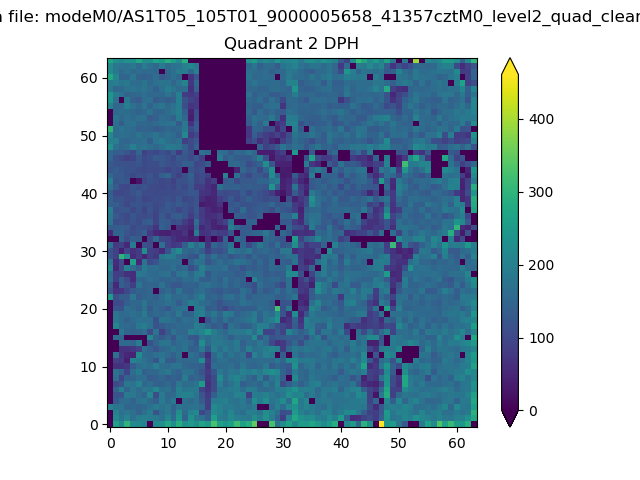
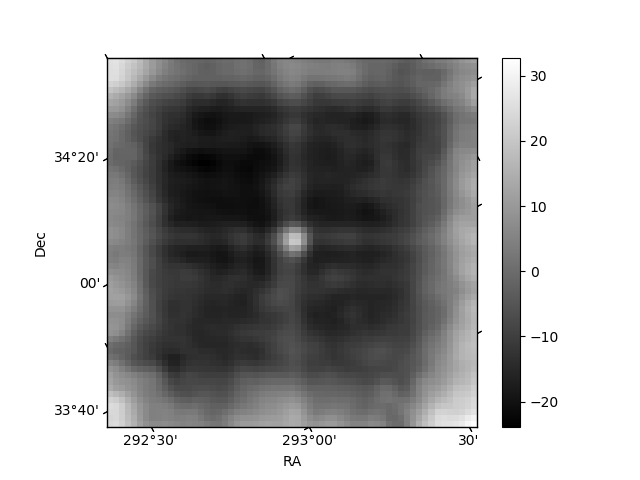
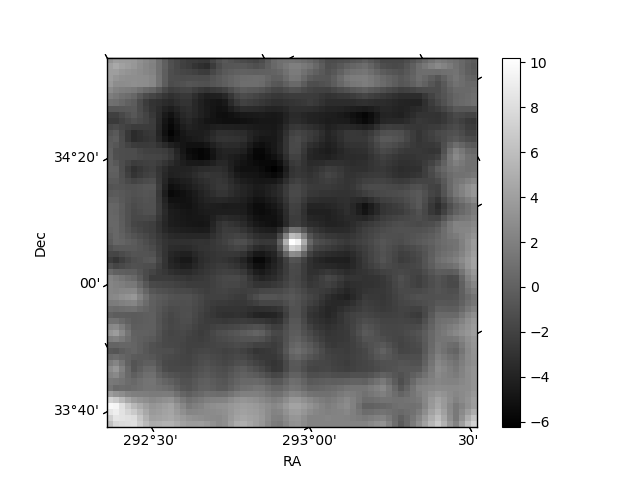
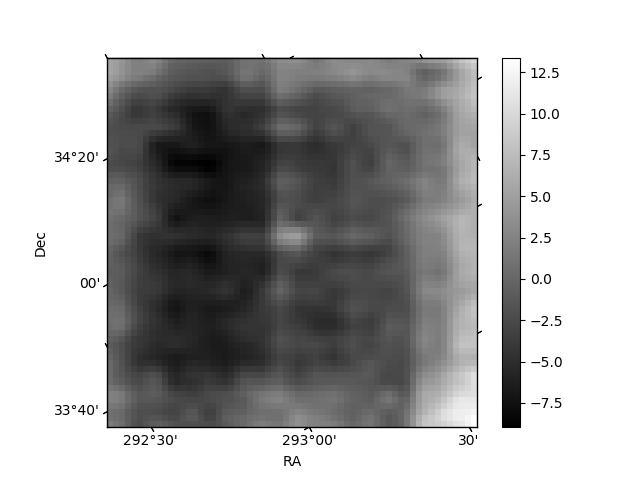
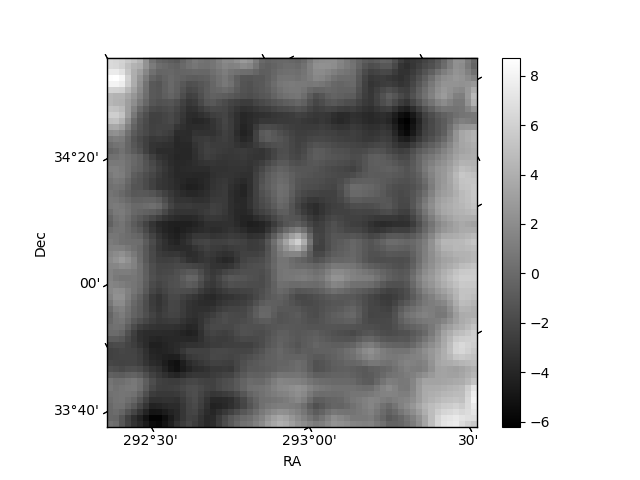
Histogram calculated using DETX and DETY for each event in the final _common_clean file
| Quadrant A | 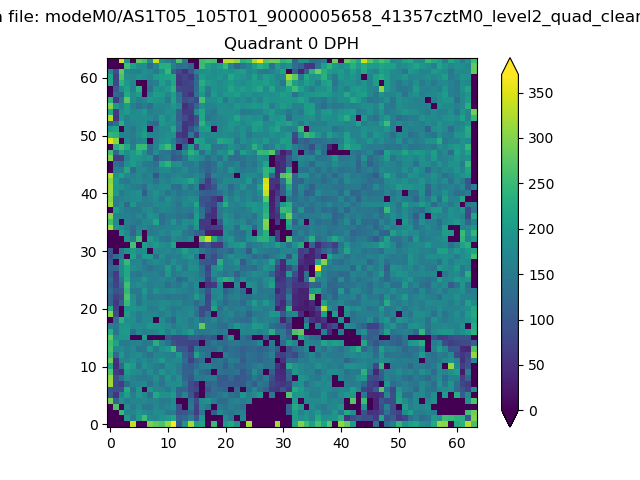 |
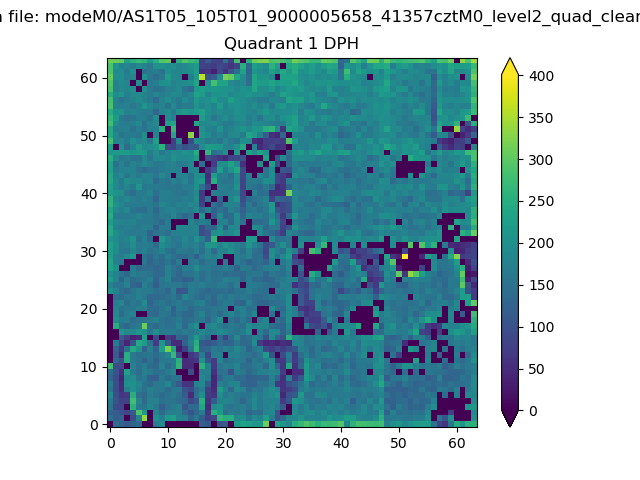 |
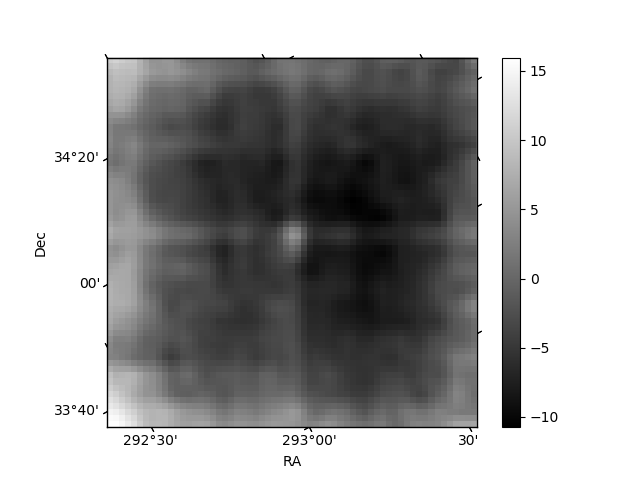
Quadrant B |
|---|---|---|---|
| Quadrant D | 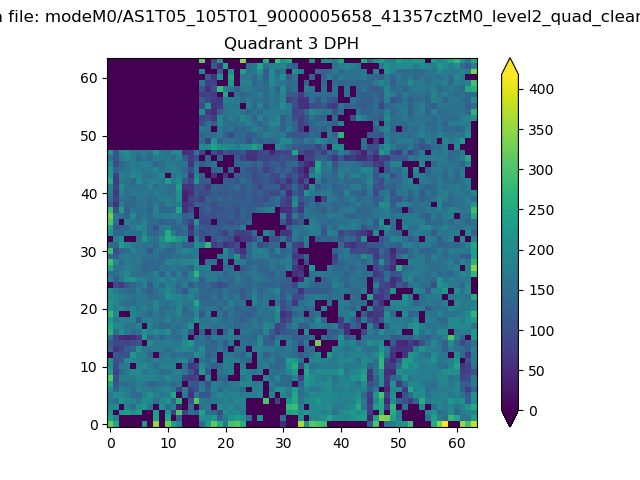 |
 |
Quadrant C |
| Plot type | Count rate plots | Images |
|---|---|---|
| Comparison with Poisson distribution Blue bars denote a histogram of data divided into 1 sec bins. Red curve is a Poisson curve with rate = median count rate of data. |
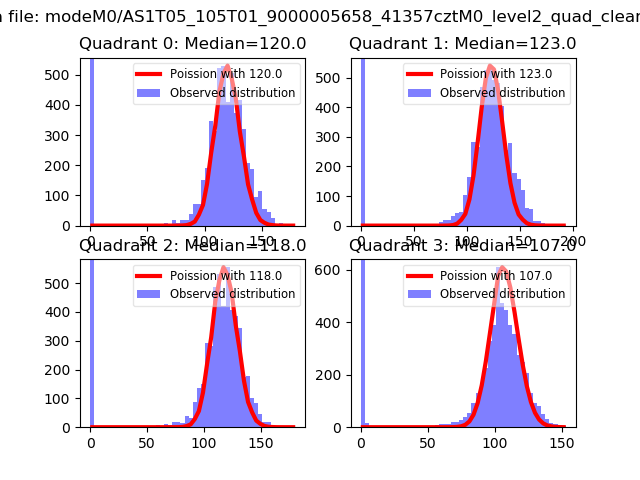 |
 |
| Quadrant-wise count rates Data is divided into 100 sec bins |
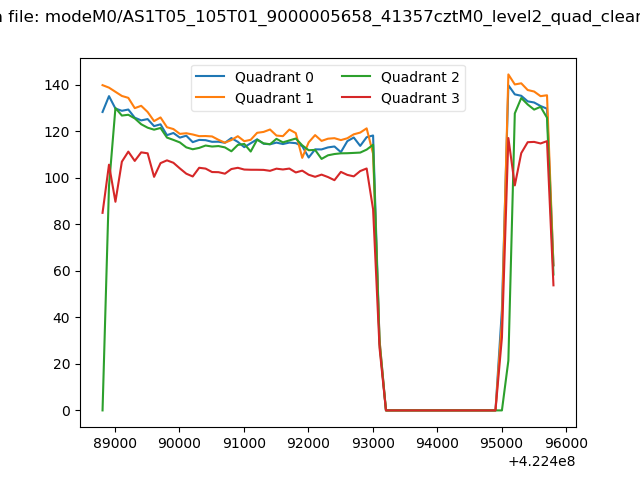 |
|
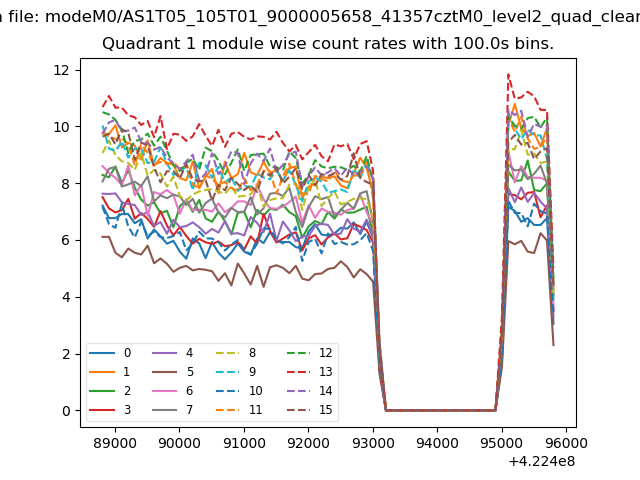
| Module-wise count rates for Quadrant A Data is divided into 100 sec bins |
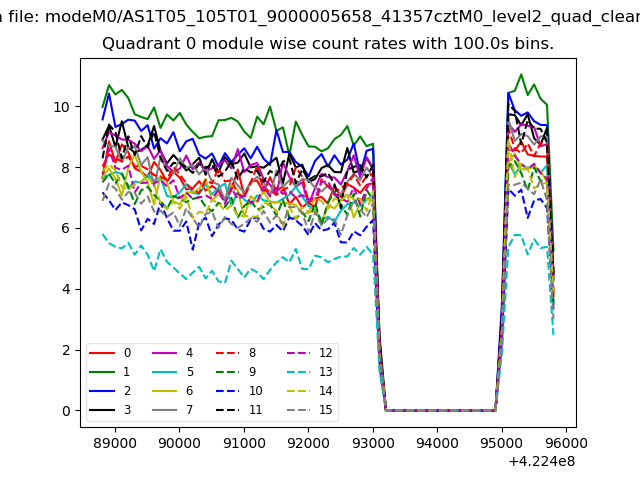 |
 |
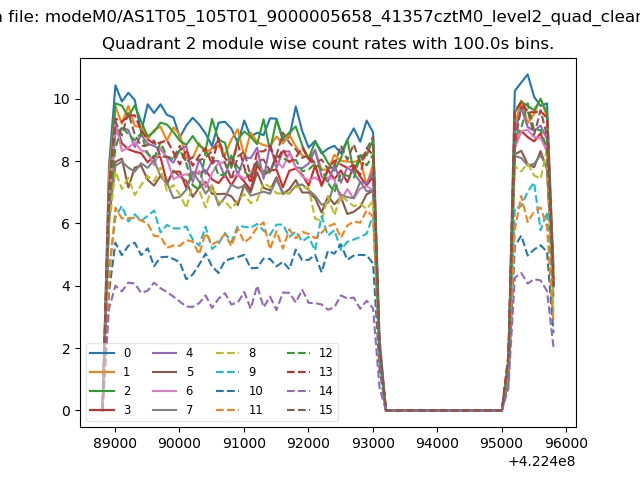
| Module-wise count rates for Quadrant B Data is divided into 100 sec bins |
 |
 |
| Module-wise count rates for Quadrant C Data is divided into 100 sec bins |
 |
 |
| Module-wise count rates for Quadrant D Data is divided into 100 sec bins |
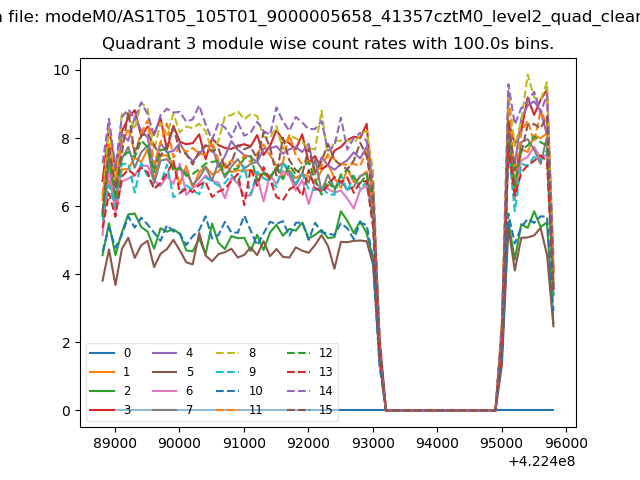 |
 |
| Parameter | Plot |
|---|---|
| CZT HV Monitor |  |
| D_VDD |  |
| Temperature 1 | 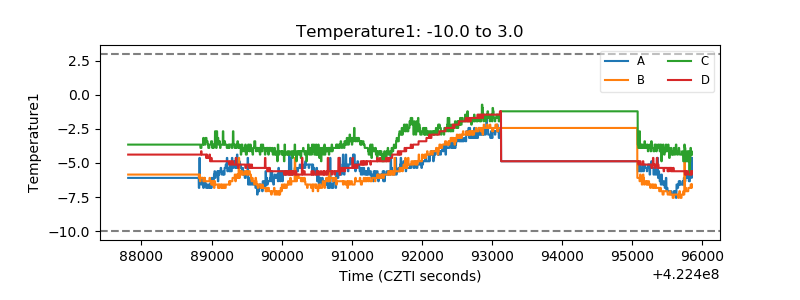 |
| Veto HV Monitor | 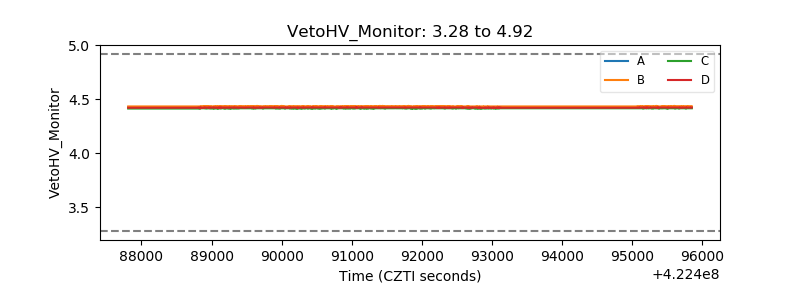 |
| Veto LLD | 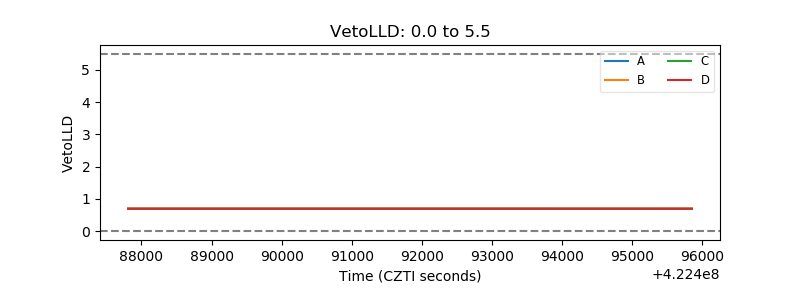 |
| Alpha Counter | 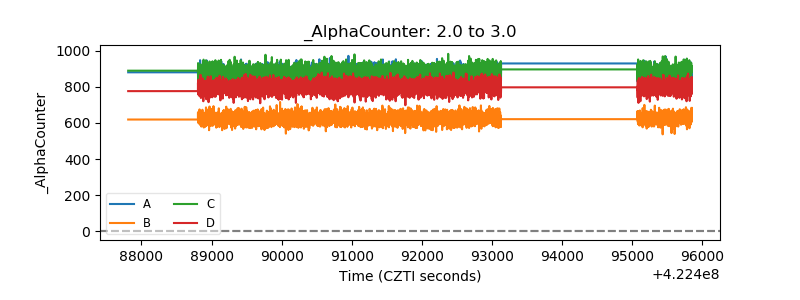 |
| _CPM_Rate | 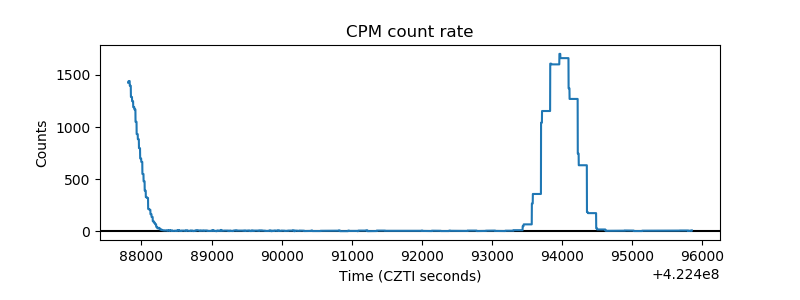 |
| CZT Counter | 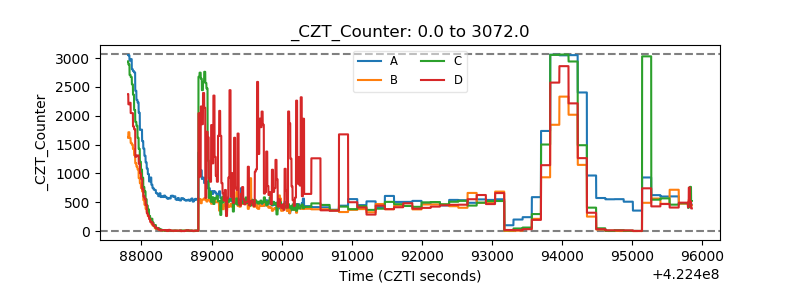 |
| +2.5 Volts monitor | 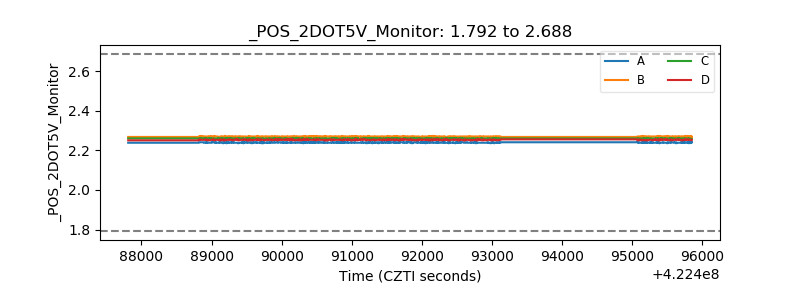 |
| +5 Volts monitor | 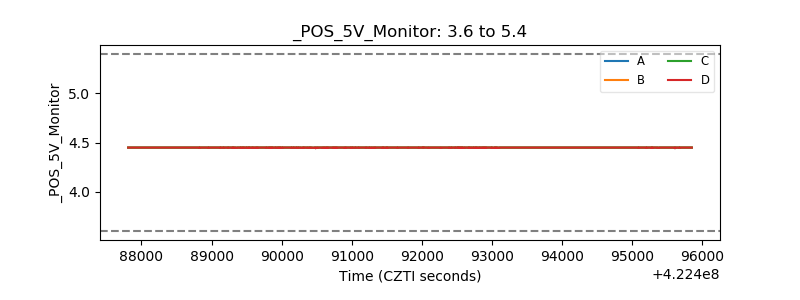 |
| _ROLL_ROT | 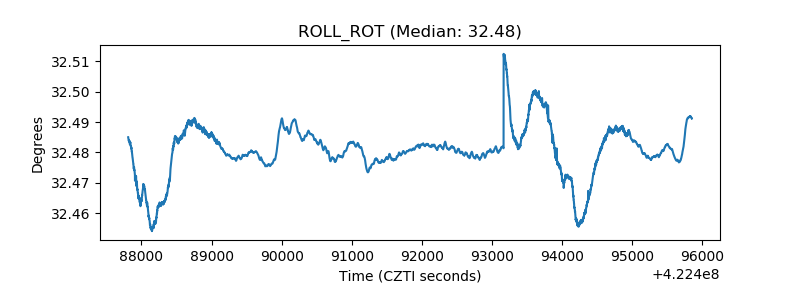 |
| _Roll_DEC | 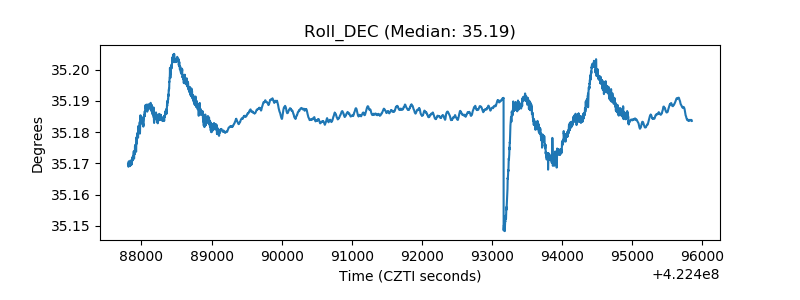 |
| _Roll_RA | 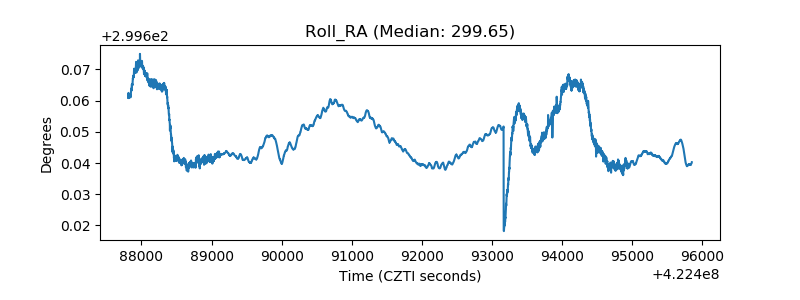 |
| Veto Counter |  |