| Param | Original file | Final file |
|---|---|---|
| Filename | modeM0/AS1T05_105T01_9000005658_41358cztM0_level2.fits | modeM0/AS1T05_105T01_9000005658_41358cztM0_level2_quad_clean.evt |
| Size (bytes) | 350,962,560 | 93,525,120 |
| Size | 334.7 MB | 89.2 MB |
| Events in quadrant A | 2,839,747 | 646,562 |
| Events in quadrant B | 3,021,776 | 657,749 |
| Events in quadrant C | 3,158,018 | 601,080 |
| Events in quadrant D | 3,560,956 | 557,285 |
| Mode M9 | |||
|---|---|---|---|
| Quadrant | BADHDUFLAG | Total packets | Discarded packets |
| A | 0 | 39 | 0 |
| B | 0 | 39 | 0 |
| C | 0 | 39 | 0 |
| D | 0 | 39 | 0 |
| Mode SS | |||
|---|---|---|---|
| Quadrant | BADHDUFLAG | Total packets | Discarded packets |
| A | 0 | 110 | 0 |
| B | 0 | 110 | 0 |
| C | 0 | 110 | 0 |
| D | 0 | 110 | 0 |
| Mode M0 | |||
|---|---|---|---|
| Quadrant | BADHDUFLAG | Total packets | Discarded packets |
| A | 0 | 11575 | 3 |
| B | 0 | 12399 | 2 |
| C | 0 | 12473 | 2 |
| D | 0 | 14184 | 2 |
| Quadrant | Total seconds | Saturated seconds | Saturation percentage |
|---|---|---|---|
| A | 5276 | 9 | 0.170584% |
| B | 5276 | 159 | 3.013647% |
| C | 5276 | 250 | 4.738438% |
| D | 5276 | 233 | 4.416224% |
Noise dominated data is calculated using 1-second bins in cleaned event files. If a bin has >2000 counts, and if more than 50% of those come from <1% of pixels, then it is considered to be noise-dominated and hence unusable.
| Quadrant | # 1 sec bins | Bins with >0 counts | Bins with >2000 counts | High rate bins dominated by noise | Noise dominated (total time) | Noise dominated (detector-on time) | Marked lightcurve |
|---|---|---|---|---|---|---|---|
| A | 9252 | 5278 | 4 | 4 | 0.04% | 0.08% | 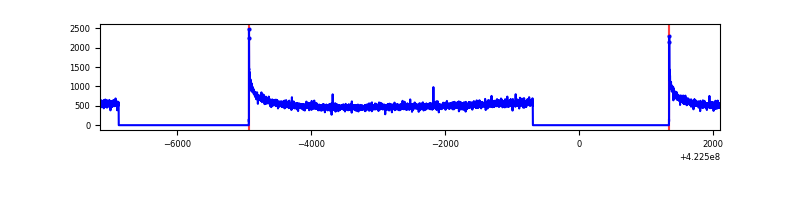 |
| B | 9252 | 5278 | 124 | 124 | 1.34% | 2.35% | 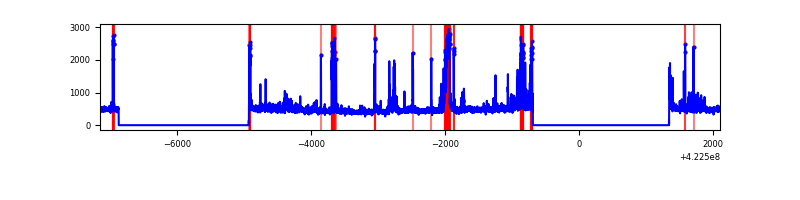 |
| C | 9252 | 5278 | 247 | 247 | 2.67% | 4.68% | 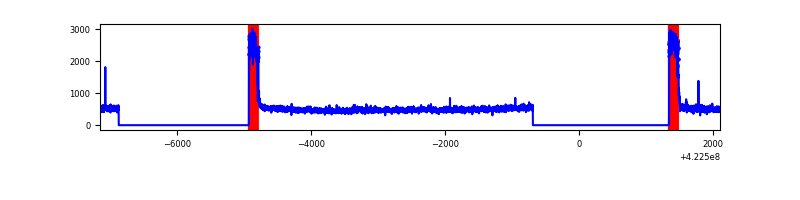 |
| D | 9252 | 5278 | 237 | 237 | 2.56% | 4.49% | 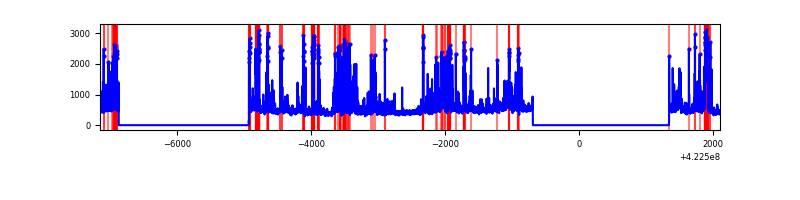 |
Top three noisy pixels from each quadrant. If the there are fewer than three noisy pixels in the level2.evt file, extra rows are filled as -1
| Pixel properties | Quadrant properties | ||||||
|---|---|---|---|---|---|---|---|
| Quadrant | DetID | PixID | Counts | Sigma | Mean | Median | Sigma |
| A | 10 | 83 | 502034 | 4086.91 | 600 | 589 | 122.7 |
| A | 12 | 189 | 15090 | 118.19 | 600 | 589 | 122.7 |
| A | 13 | 6 | 7047 | 52.63 | 600 | 589 | 122.7 |
| B | 5 | 255 | 590527 | 5218.71 | 593 | 577 | 113.0 |
| B | 0 | 155 | 53091 | 464.54 | 593 | 577 | 113.0 |
| B | 0 | 190 | 45987 | 401.7 | 593 | 577 | 113.0 |
| C | 0 | 10 | 719067 | 5442.25 | 566 | 570 | 132.0 |
| C | 15 | 214 | 219036 | 1654.77 | 566 | 570 | 132.0 |
| C | 15 | 111 | 7669 | 53.77 | 566 | 570 | 132.0 |
| D | 13 | 249 | 908453 | 6480.51 | 567 | 551 | 140.1 |
| D | 5 | 222 | 130153 | 925.09 | 567 | 551 | 140.1 |
| D | 1 | 52 | 115259 | 818.77 | 567 | 551 | 140.1 |
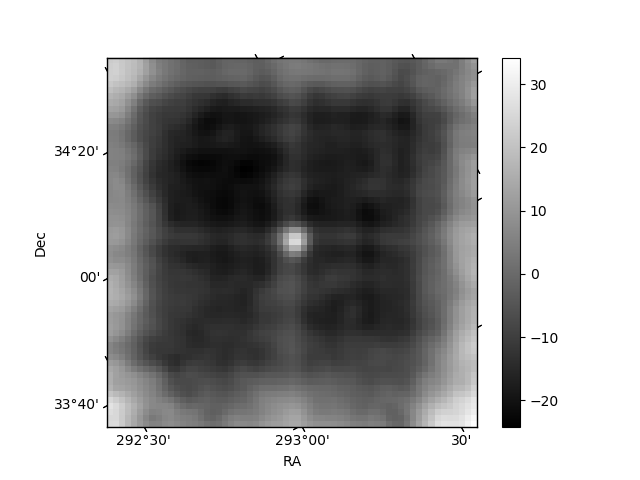
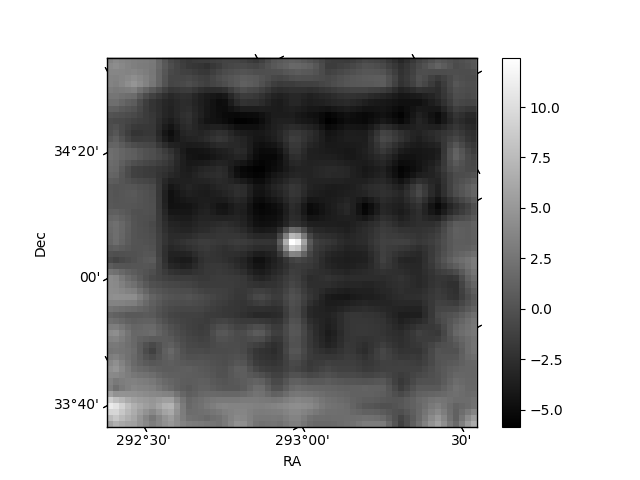
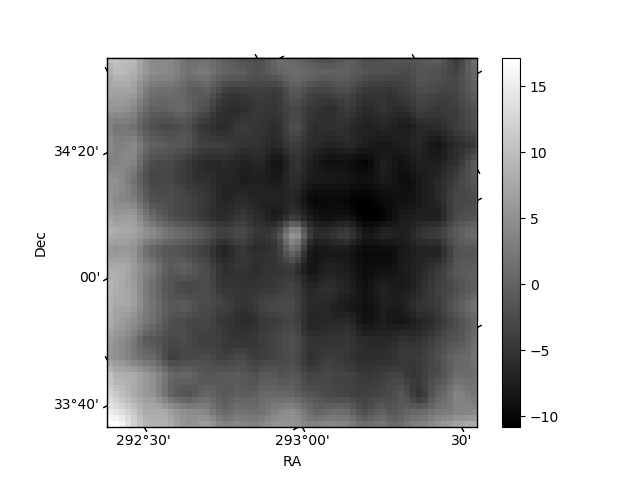
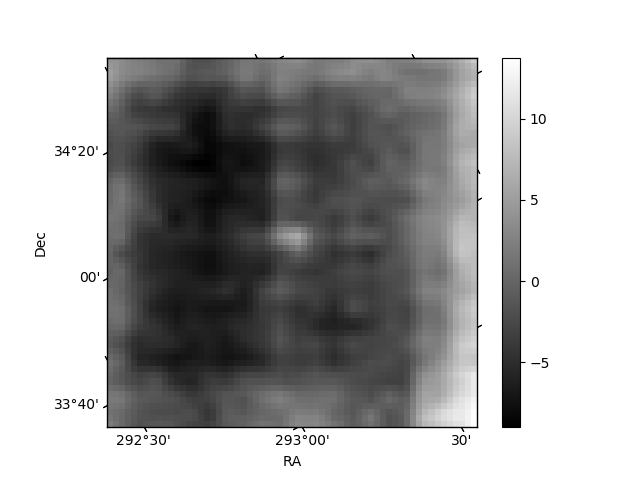
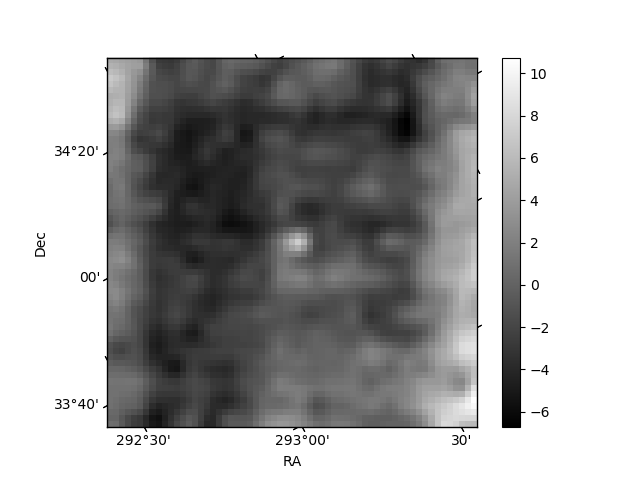
Histogram calculated using DETX and DETY for each event in the final _common_clean file
| Quadrant A | 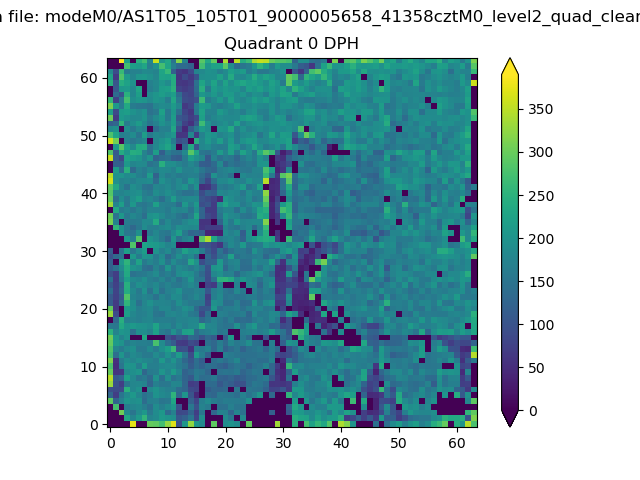 |
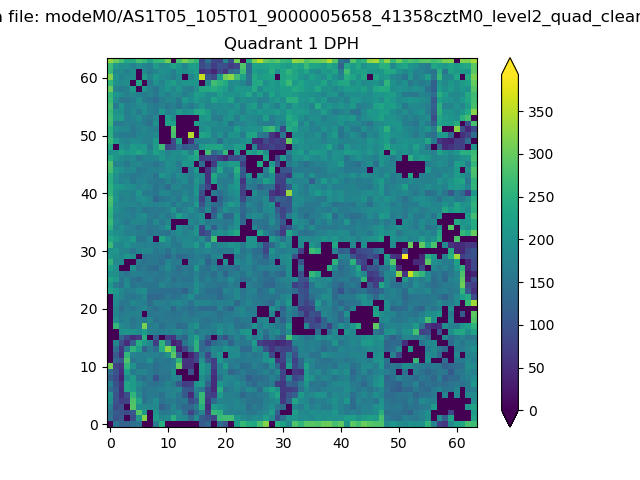 |
Quadrant B |
|---|---|---|---|
| Quadrant D | 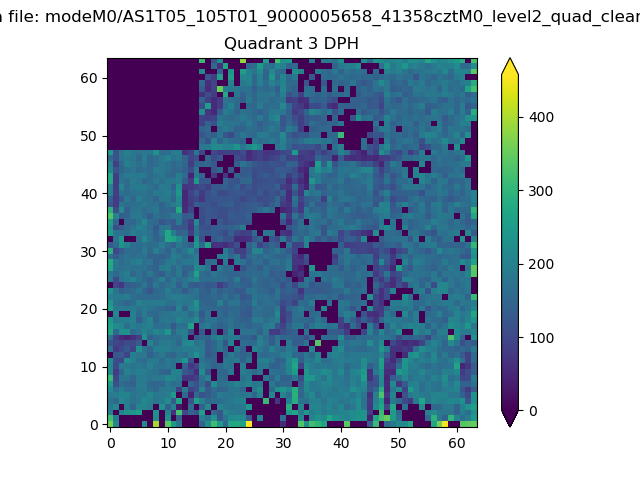 |
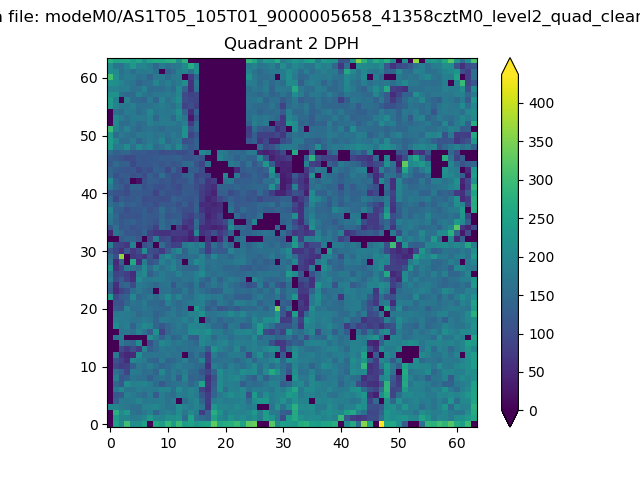 |
Quadrant C |
| Plot type | Count rate plots | Images |
|---|---|---|
| Comparison with Poisson distribution Blue bars denote a histogram of data divided into 1 sec bins. Red curve is a Poisson curve with rate = median count rate of data. |
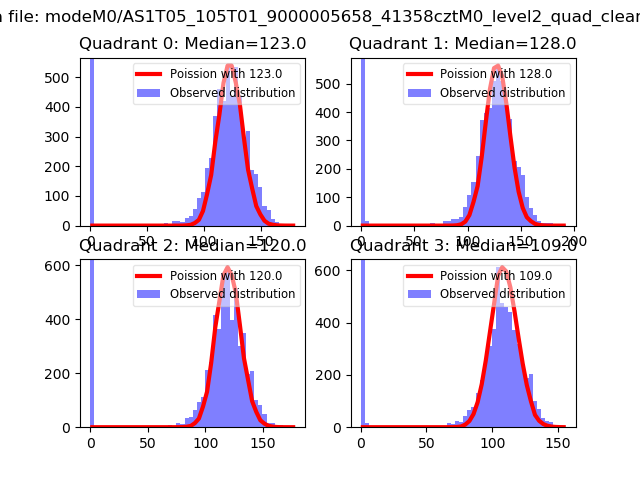 |
 |
| Quadrant-wise count rates Data is divided into 100 sec bins |
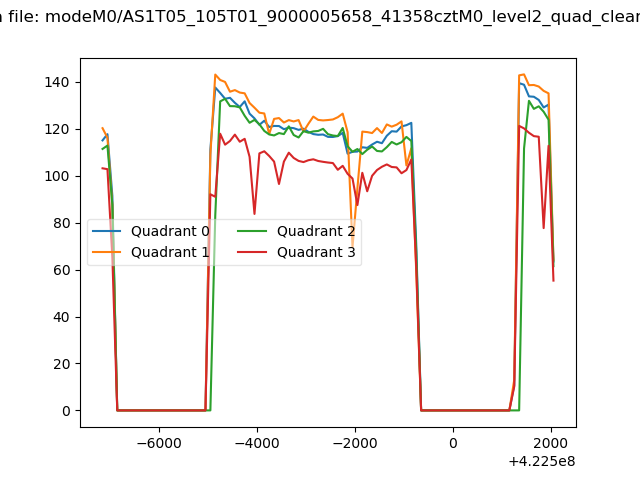 |
|
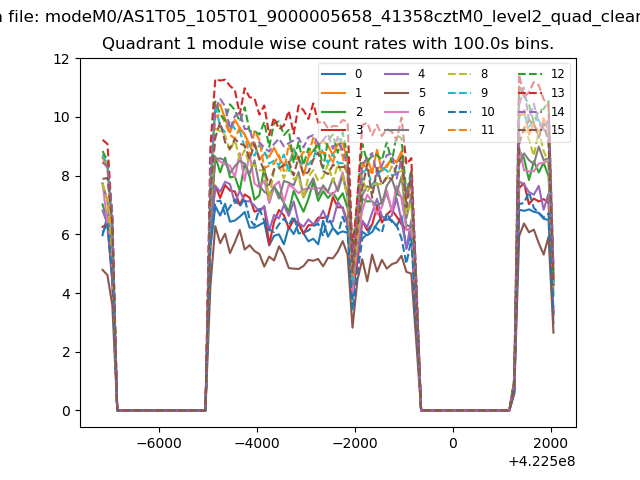
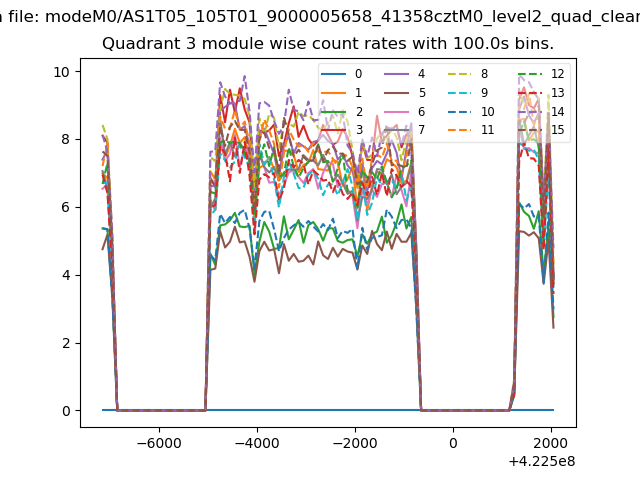
| Module-wise count rates for Quadrant A Data is divided into 100 sec bins |
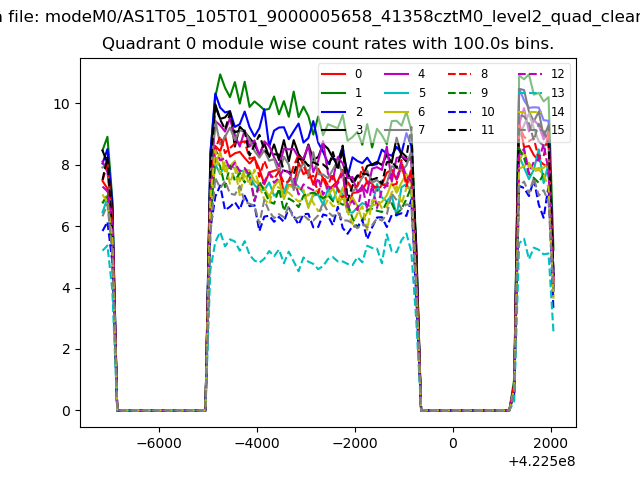 |
 |
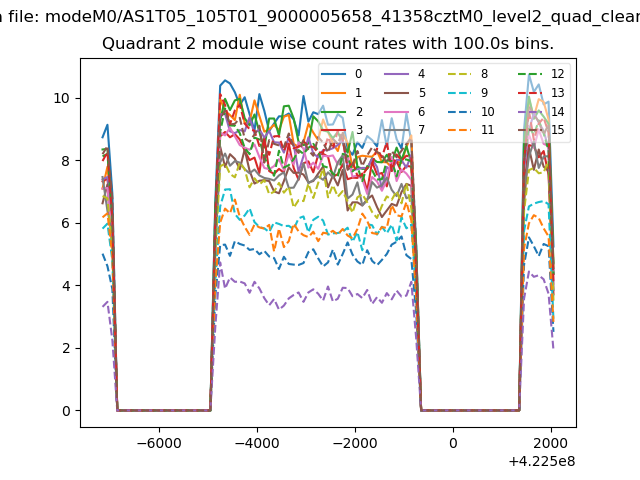
| Module-wise count rates for Quadrant B Data is divided into 100 sec bins |
 |
 |
| Module-wise count rates for Quadrant C Data is divided into 100 sec bins |
 |
 |
| Module-wise count rates for Quadrant D Data is divided into 100 sec bins |
 |
 |
| Parameter | Plot |
|---|---|
| CZT HV Monitor | 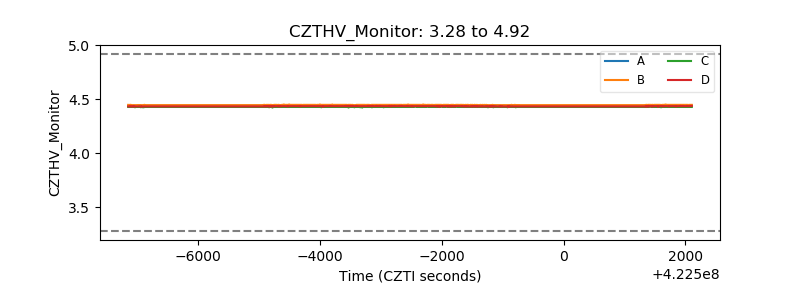 |
| D_VDD | 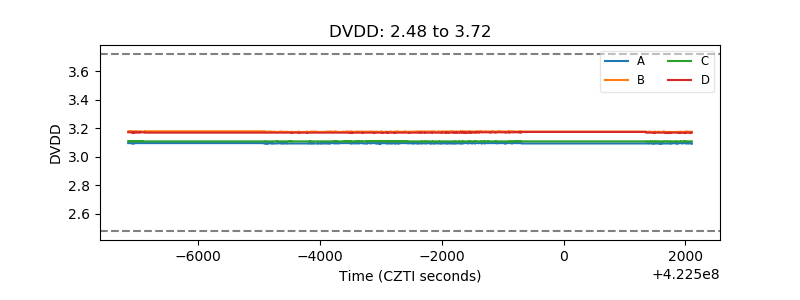 |
| Temperature 1 | 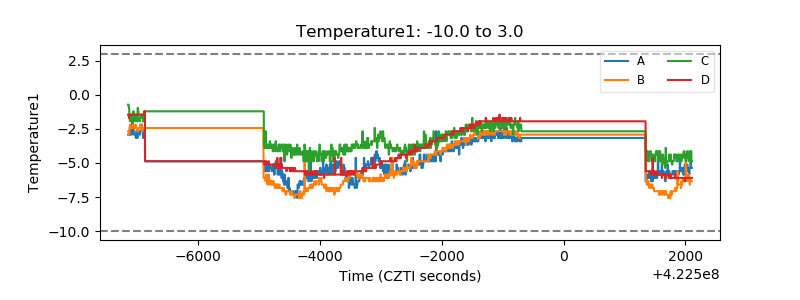 |
| Veto HV Monitor | 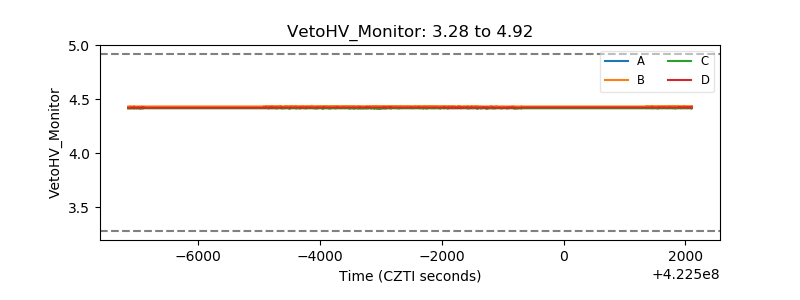 |
| Veto LLD | 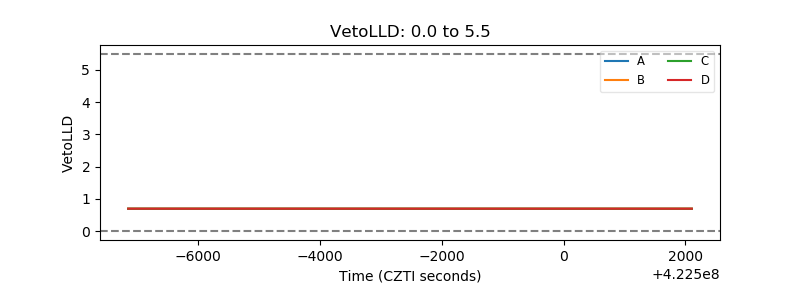 |
| Alpha Counter | 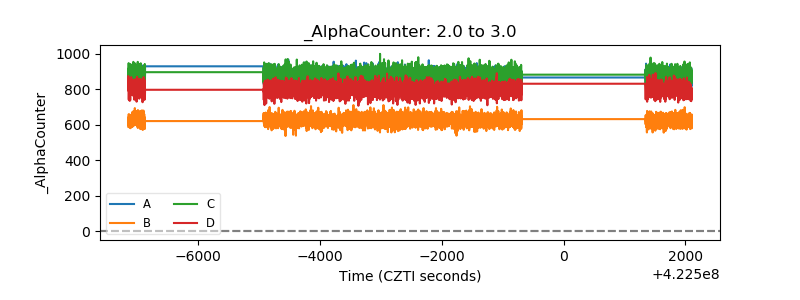 |
| _CPM_Rate | 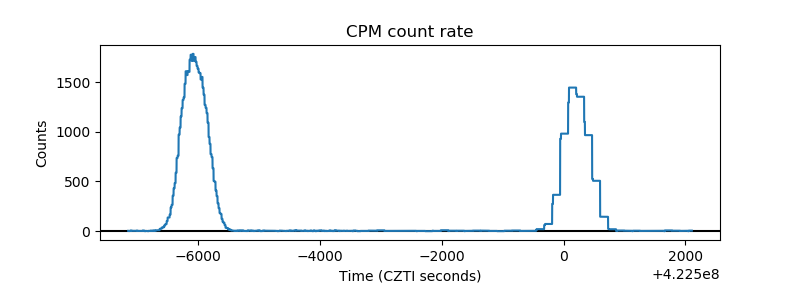 |
| CZT Counter | 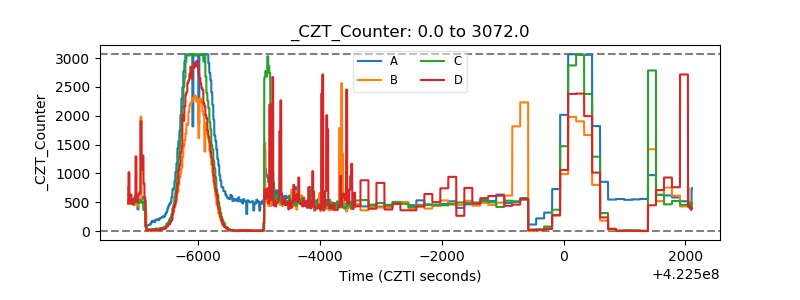 |
| +2.5 Volts monitor |  |
| +5 Volts monitor |  |
| _ROLL_ROT | 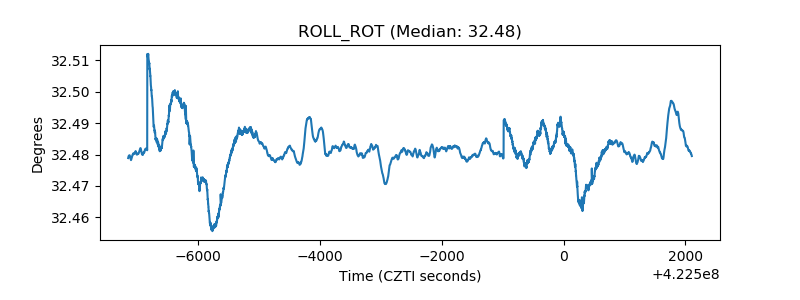 |
| _Roll_DEC | 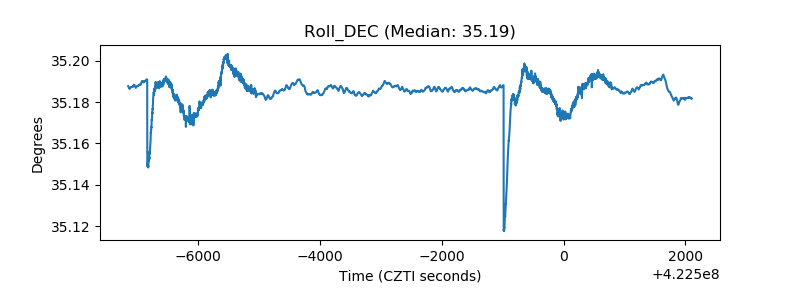 |
| _Roll_RA | 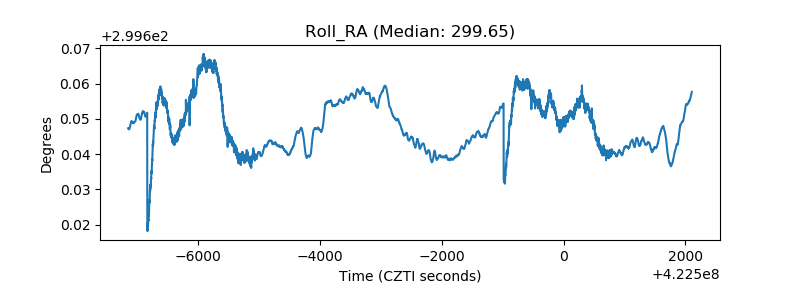 |
| Veto Counter | 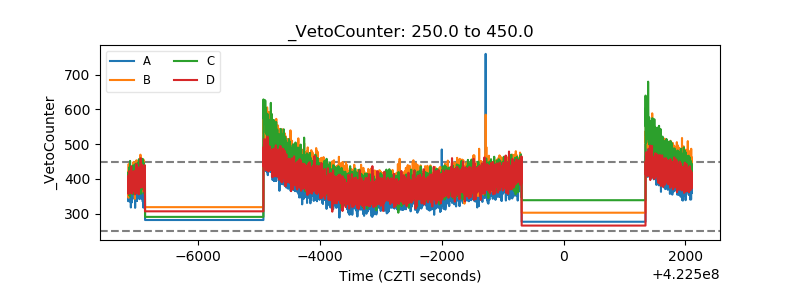 |