| Param | Original file | Final file |
|---|---|---|
| Filename | modeM0/AS1T05_105T01_9000005658_41361cztM0_level2.fits | modeM0/AS1T05_105T01_9000005658_41361cztM0_level2_quad_clean.evt |
| Size (bytes) | 296,821,440 | 73,200,960 |
| Size | 283.1 MB | 69.8 MB |
| Events in quadrant A | 2,398,908 | 505,002 |
| Events in quadrant B | 2,174,822 | 521,262 |
| Events in quadrant C | 2,559,249 | 462,868 |
| Events in quadrant D | 3,505,432 | 413,090 |
| Mode M9 | |||
|---|---|---|---|
| Quadrant | BADHDUFLAG | Total packets | Discarded packets |
| A | 0 | 24 | 0 |
| B | 0 | 24 | 0 |
| C | 0 | 24 | 0 |
| D | 0 | 25 | 0 |
| Mode SS | |||
|---|---|---|---|
| Quadrant | BADHDUFLAG | Total packets | Discarded packets |
| A | 0 | 103 | 9 |
| B | 0 | 103 | 7 |
| C | 0 | 103 | 13 |
| D | 0 | 101 | 12 |
| Mode M0 | |||
|---|---|---|---|
| Quadrant | BADHDUFLAG | Total packets | Discarded packets |
| A | 0 | 10806 | 1088 |
| B | 0 | 10612 | 1050 |
| C | 0 | 11952 | 1623 |
| D | 0 | 16172 | 2696 |
| Quadrant | Total seconds | Saturated seconds | Saturation percentage |
|---|---|---|---|
| A | 4528 | 9 | 0.198763% |
| B | 4531 | 15 | 0.331053% |
| C | 4459 | 183 | 4.104059% |
| D | 4338 | 206 | 4.748732% |
Noise dominated data is calculated using 1-second bins in cleaned event files. If a bin has >2000 counts, and if more than 50% of those come from <1% of pixels, then it is considered to be noise-dominated and hence unusable.
| Quadrant | # 1 sec bins | Bins with >0 counts | Bins with >2000 counts | High rate bins dominated by noise | Noise dominated (total time) | Noise dominated (detector-on time) | Marked lightcurve |
|---|---|---|---|---|---|---|---|
| A | 7142 | 4851 | 4 | 4 | 0.06% | 0.08% | 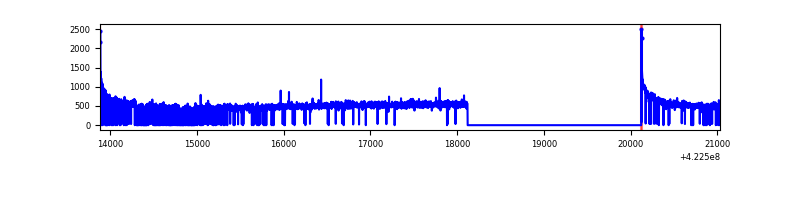 |
| B | 7144 | 4835 | 6 | 6 | 0.08% | 0.12% | 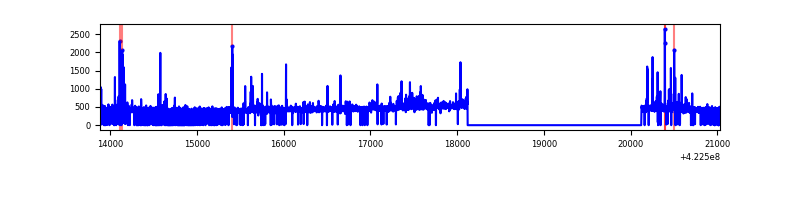 |
| C | 7144 | 4785 | 176 | 176 | 2.46% | 3.68% |  |
| D | 7139 | 4717 | 198 | 198 | 2.77% | 4.20% |  |
Top three noisy pixels from each quadrant. If the there are fewer than three noisy pixels in the level2.evt file, extra rows are filled as -1
| Pixel properties | Quadrant properties | ||||||
|---|---|---|---|---|---|---|---|
| Quadrant | DetID | PixID | Counts | Sigma | Mean | Median | Sigma |
| A | 10 | 83 | 431374 | 4091.74 | 507 | 496 | 105.3 |
| A | 3 | 137 | 5763 | 50.02 | 507 | 496 | 105.3 |
| A | 12 | 189 | 5666 | 49.1 | 507 | 496 | 105.3 |
| B | 5 | 255 | 132880 | 1347.09 | 500 | 487 | 98.3 |
| B | 0 | 190 | 62420 | 630.17 | 500 | 487 | 98.3 |
| B | 12 | 111 | 12335 | 120.55 | 500 | 487 | 98.3 |
| C | 0 | 10 | 529932 | 4793.17 | 468 | 470 | 110.5 |
| C | 15 | 214 | 188471 | 1701.95 | 468 | 470 | 110.5 |
| C | 15 | 111 | 10087 | 87.06 | 468 | 470 | 110.5 |
| D | 1 | 52 | 958586 | 8455.74 | 462 | 449 | 113.3 |
| D | 2 | 120 | 259483 | 2286.02 | 462 | 449 | 113.3 |
| D | 1 | 47 | 180185 | 1586.2 | 462 | 449 | 113.3 |
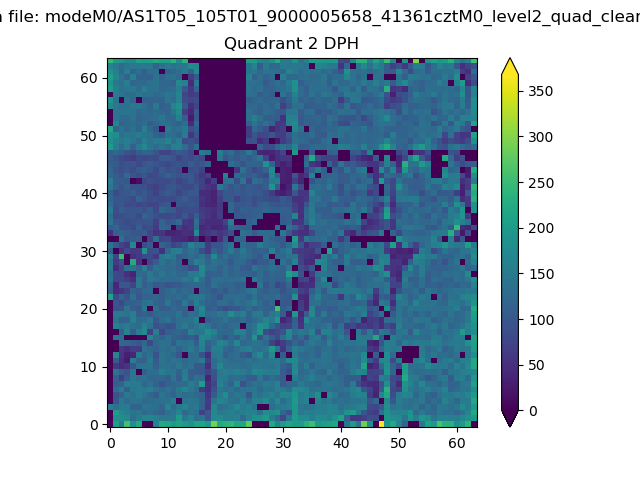
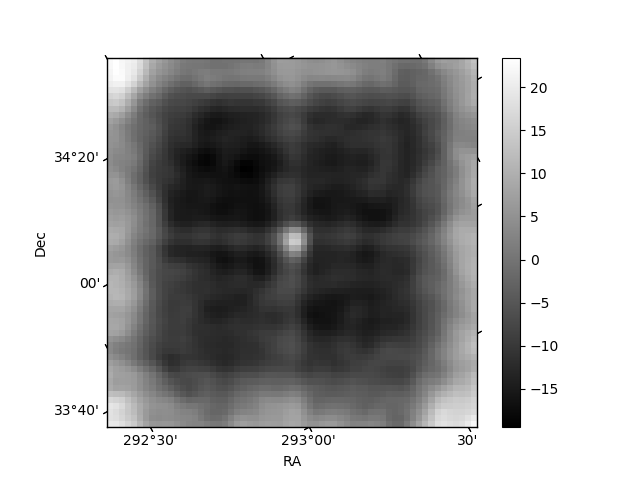
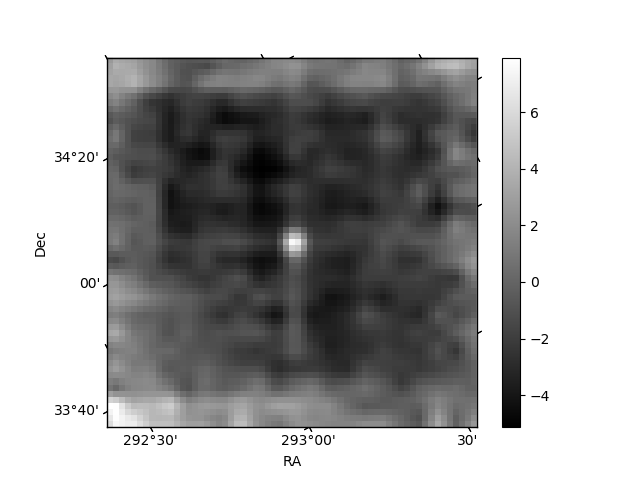
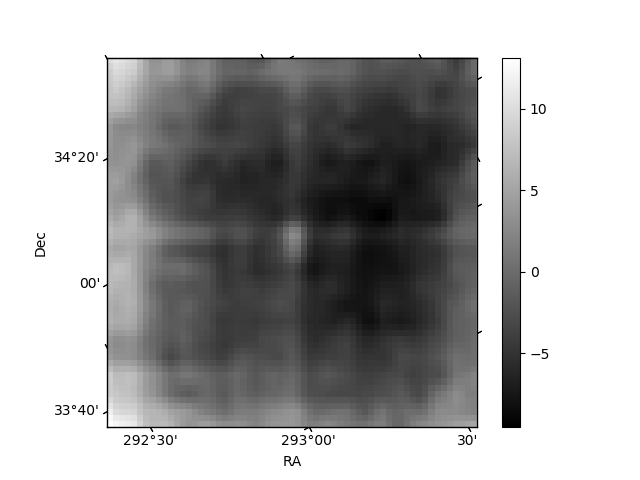
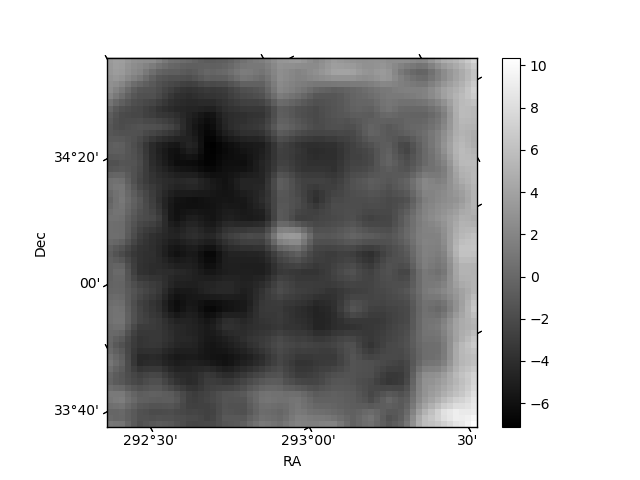
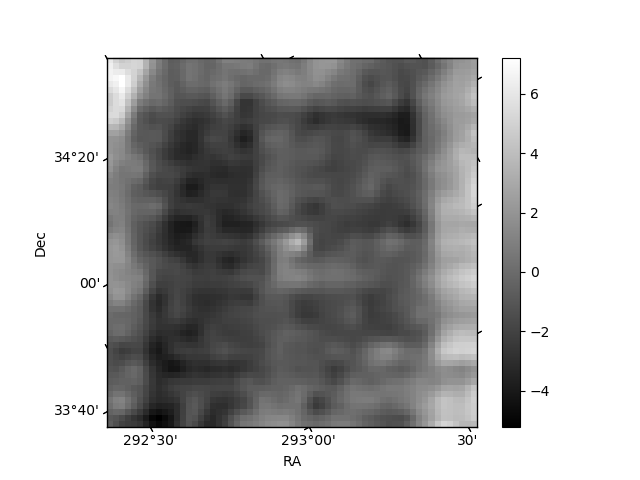
Histogram calculated using DETX and DETY for each event in the final _common_clean file
| Quadrant A | 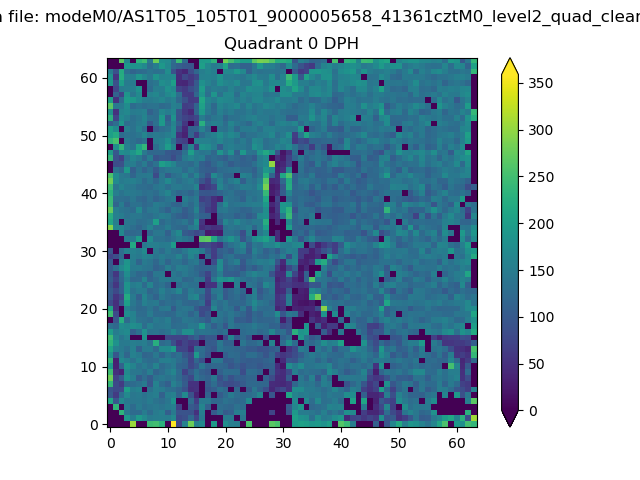 |
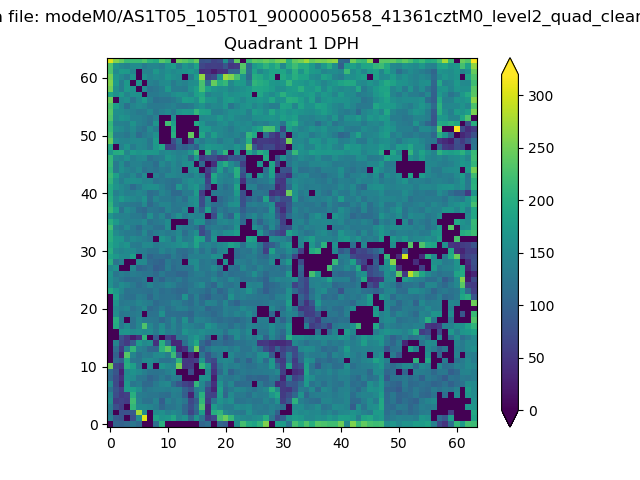 |
Quadrant B |
|---|---|---|---|
| Quadrant D | 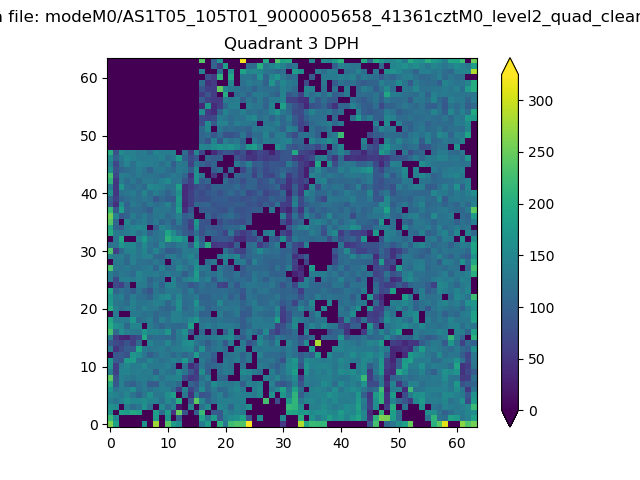 |
 |
Quadrant C |
| Plot type | Count rate plots | Images |
|---|---|---|
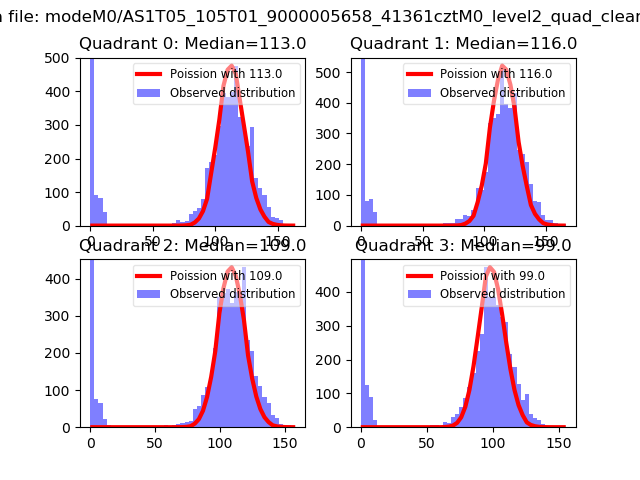
| Comparison with Poisson distribution Blue bars denote a histogram of data divided into 1 sec bins. Red curve is a Poisson curve with rate = median count rate of data. |
 |
 |
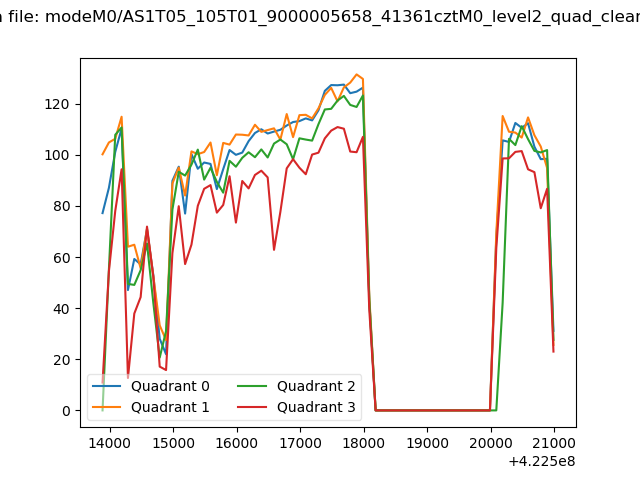
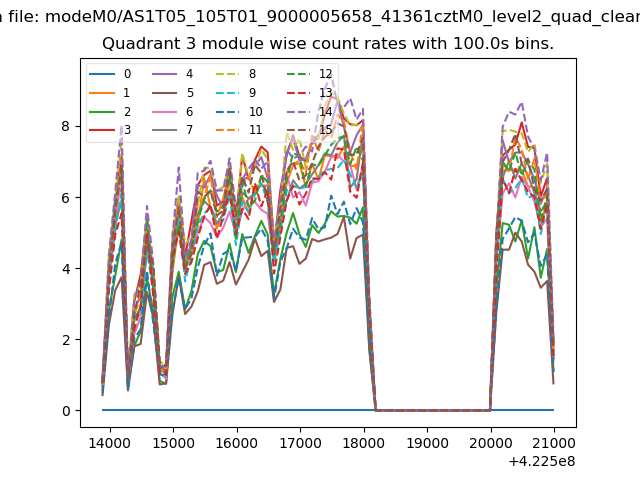
| Quadrant-wise count rates Data is divided into 100 sec bins |
 |
|
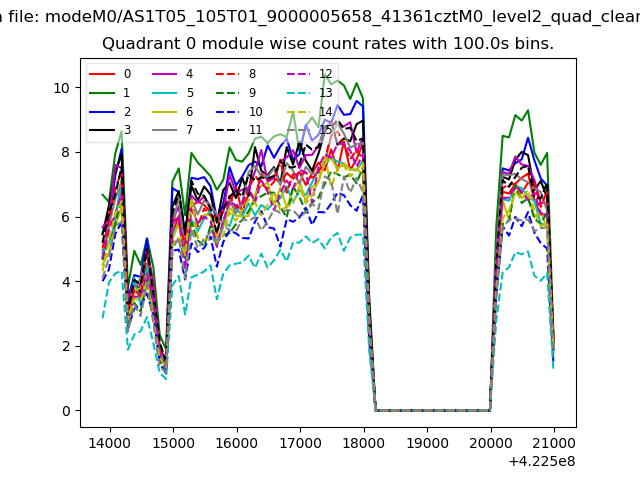
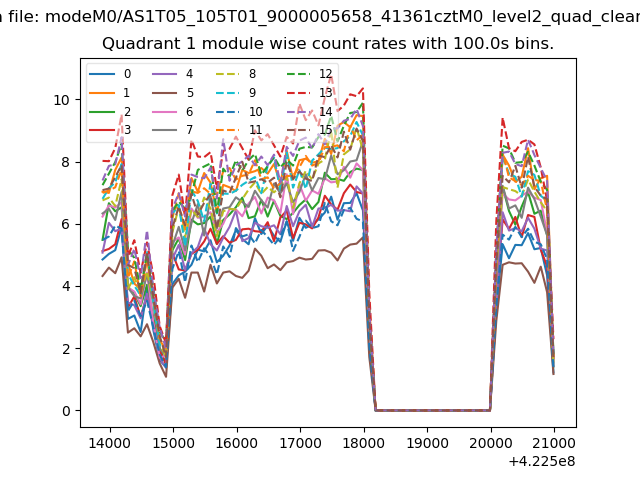
| Module-wise count rates for Quadrant A Data is divided into 100 sec bins |
 |
 |
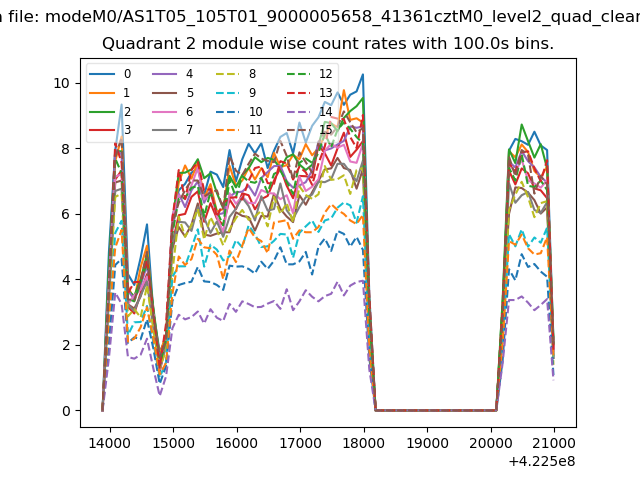
| Module-wise count rates for Quadrant B Data is divided into 100 sec bins |
 |
 |
| Module-wise count rates for Quadrant C Data is divided into 100 sec bins |
 |
 |
| Module-wise count rates for Quadrant D Data is divided into 100 sec bins |
 |
 |
| Parameter | Plot |
|---|---|
| CZT HV Monitor | 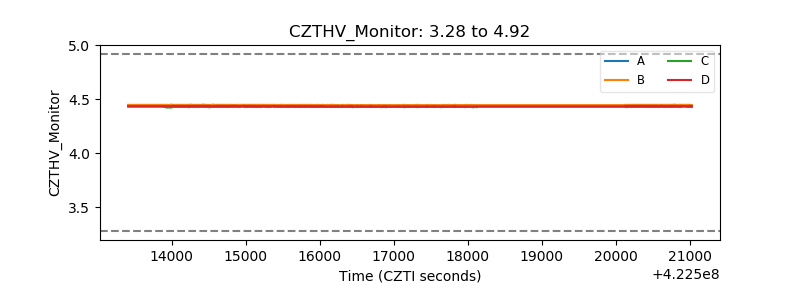 |
| D_VDD | 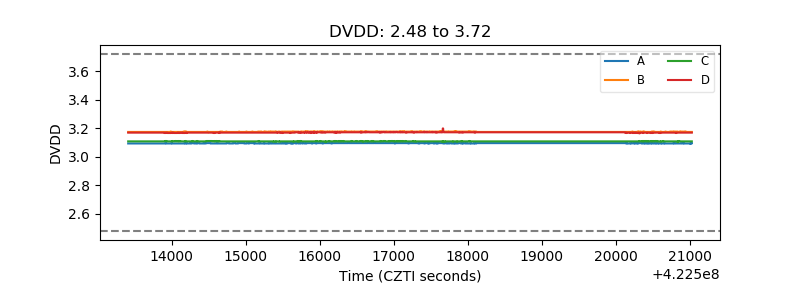 |
| Temperature 1 | 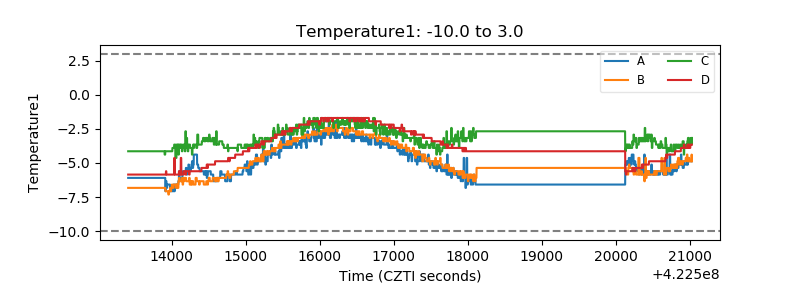 |
| Veto HV Monitor |  |
| Veto LLD | 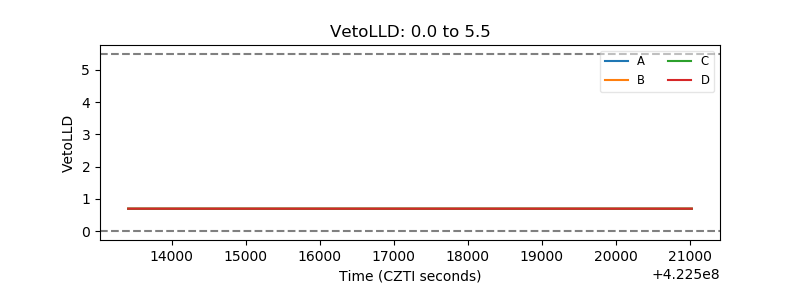 |
| Alpha Counter | 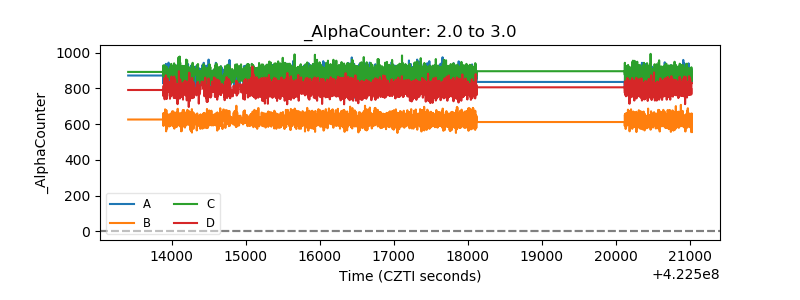 |
| _CPM_Rate | 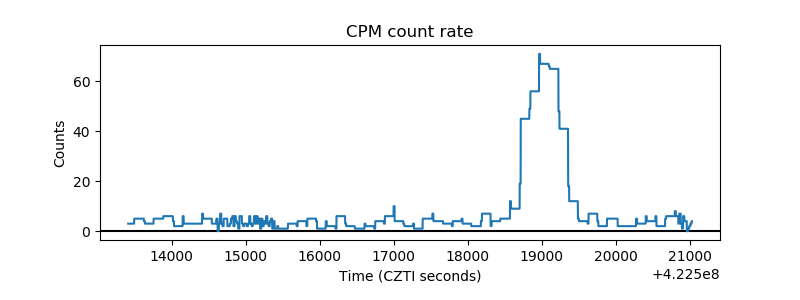 |
| CZT Counter | 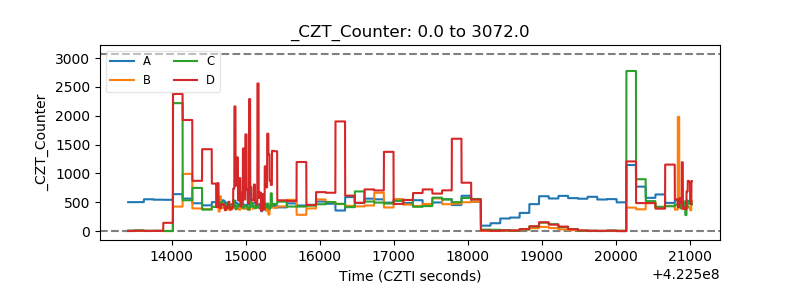 |
| +2.5 Volts monitor | 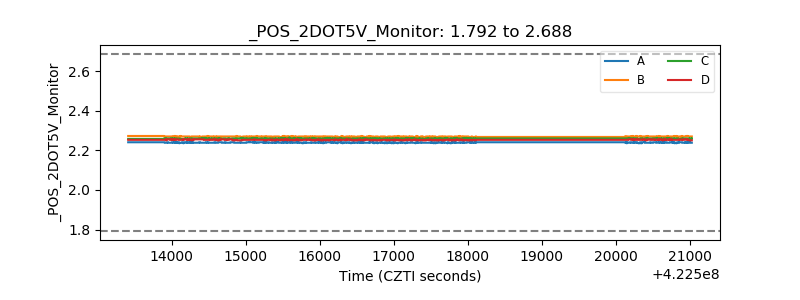 |
| +5 Volts monitor | 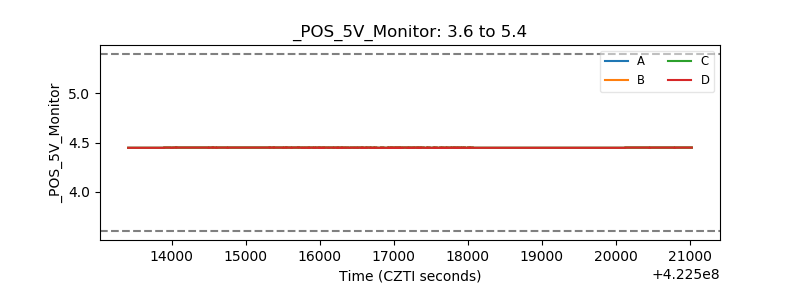 |
| _ROLL_ROT | 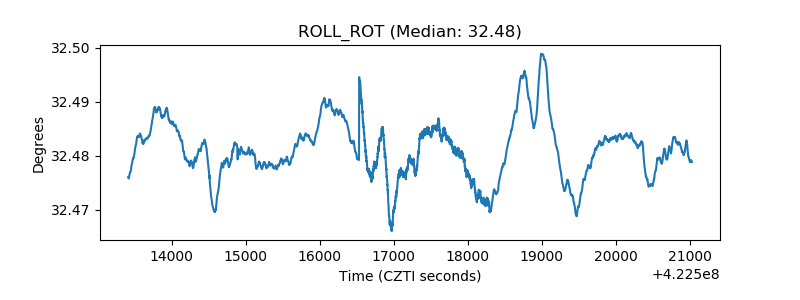 |
| _Roll_DEC | 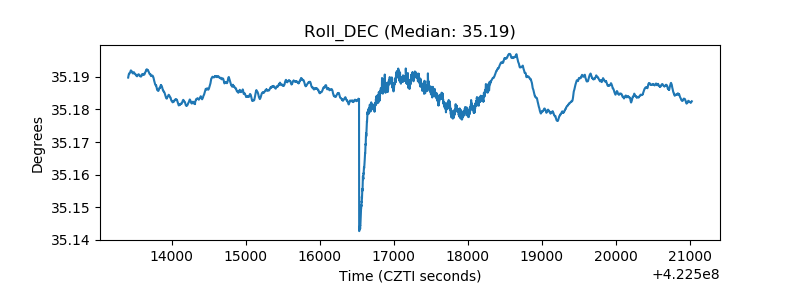 |
| _Roll_RA | 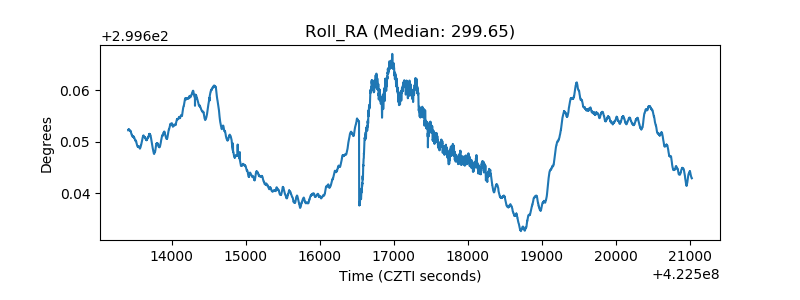 |
| Veto Counter | 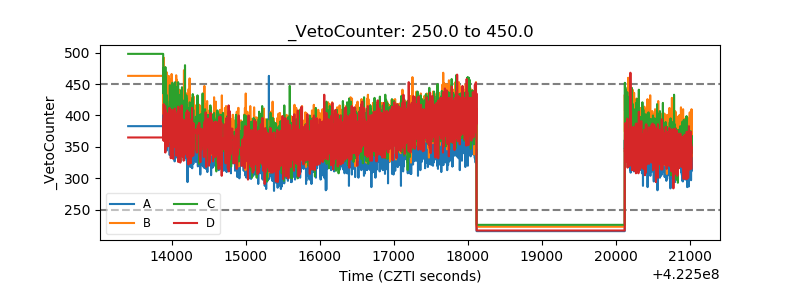 |