| Param | Original file | Final file |
|---|---|---|
| Filename | modeM0/AS1T05_105T01_9000005658_41362cztM0_level2.fits | modeM0/AS1T05_105T01_9000005658_41362cztM0_level2_quad_clean.evt |
| Size (bytes) | 1,106,668,800 | 264,064,320 |
| Size | 1.0 GB | 251.8 MB |
| Events in quadrant A | 8,249,454 | 1,844,119 |
| Events in quadrant B | 7,667,497 | 1,903,303 |
| Events in quadrant C | 8,575,480 | 1,741,132 |
| Events in quadrant D | 15,231,855 | 1,402,144 |
| Mode M9 | |||
|---|---|---|---|
| Quadrant | BADHDUFLAG | Total packets | Discarded packets |
| A | 0 | 63 | 0 |
| B | 0 | 63 | 0 |
| C | 0 | 63 | 0 |
| D | 0 | 63 | 0 |
| Mode SS | |||
|---|---|---|---|
| Quadrant | BADHDUFLAG | Total packets | Discarded packets |
| A | 0 | 326 | 0 |
| B | 0 | 326 | 0 |
| C | 0 | 326 | 0 |
| D | 0 | 326 | 0 |
| Mode M0 | |||
|---|---|---|---|
| Quadrant | BADHDUFLAG | Total packets | Discarded packets |
| A | 0 | 33673 | 3 |
| B | 0 | 33619 | 3 |
| C | 0 | 35242 | 3 |
| D | 0 | 56511 | 3 |
| Quadrant | Total seconds | Saturated seconds | Saturation percentage |
|---|---|---|---|
| A | 16024 | 16 | 0.099850% |
| B | 16024 | 57 | 0.355716% |
| C | 16024 | 393 | 2.452571% |
| D | 16024 | 2450 | 15.289566% |
Noise dominated data is calculated using 1-second bins in cleaned event files. If a bin has >2000 counts, and if more than 50% of those come from <1% of pixels, then it is considered to be noise-dominated and hence unusable.
| Quadrant | # 1 sec bins | Bins with >0 counts | Bins with >2000 counts | High rate bins dominated by noise | Noise dominated (total time) | Noise dominated (detector-on time) | Marked lightcurve |
|---|---|---|---|---|---|---|---|
| A | 22305 | 16027 | 6 | 6 | 0.03% | 0.04% | 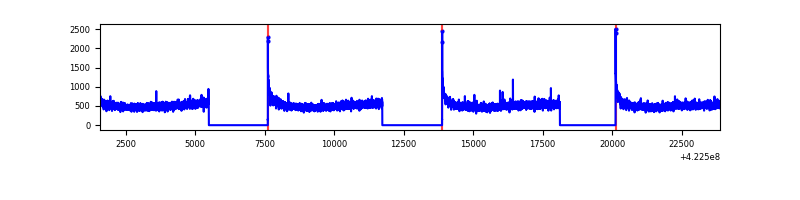 |
| B | 22305 | 16027 | 36 | 36 | 0.16% | 0.22% | 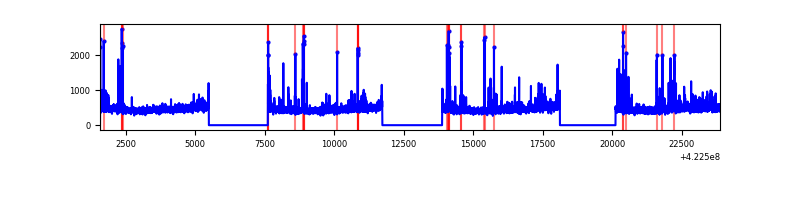 |
| C | 22305 | 16027 | 389 | 389 | 1.74% | 2.43% | 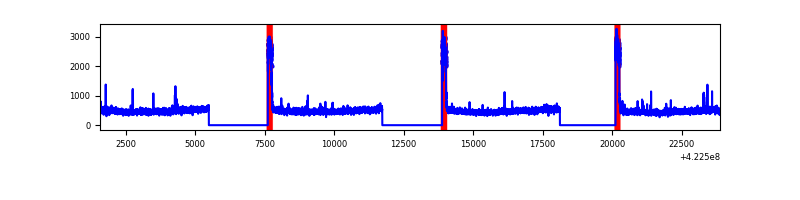 |
| D | 22305 | 16027 | 2378 | 2378 | 10.66% | 14.84% | 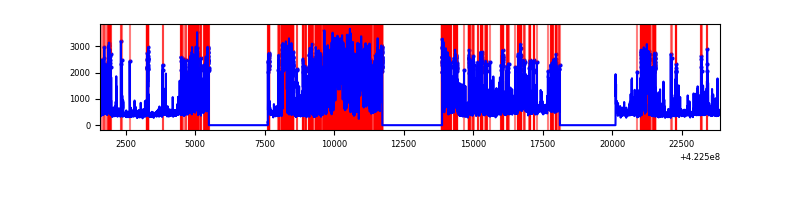 |
Top three noisy pixels from each quadrant. If the there are fewer than three noisy pixels in the level2.evt file, extra rows are filled as -1
| Pixel properties | Quadrant properties | ||||||
|---|---|---|---|---|---|---|---|
| Quadrant | DetID | PixID | Counts | Sigma | Mean | Median | Sigma |
| A | 10 | 83 | 1277488 | 3499.44 | 1799 | 1766 | 364.6 |
| A | 12 | 189 | 26992 | 69.2 | 1799 | 1766 | 364.6 |
| A | 3 | 137 | 19963 | 49.92 | 1799 | 1766 | 364.6 |
| B | 5 | 255 | 361217 | 1054.93 | 1779 | 1733 | 340.8 |
| B | 0 | 190 | 176871 | 513.96 | 1779 | 1733 | 340.8 |
| B | 0 | 155 | 93301 | 268.71 | 1779 | 1733 | 340.8 |
| C | 0 | 10 | 1193016 | 3016.92 | 1706 | 1717 | 394.9 |
| C | 15 | 214 | 667650 | 1686.45 | 1706 | 1717 | 394.9 |
| C | 15 | 111 | 52220 | 127.9 | 1706 | 1717 | 394.9 |
| D | 1 | 47 | 4183413 | 10666.47 | 1599 | 1555 | 392.1 |
| D | 1 | 52 | 2811086 | 7166.14 | 1599 | 1555 | 392.1 |
| D | 5 | 222 | 721680 | 1836.79 | 1599 | 1555 | 392.1 |
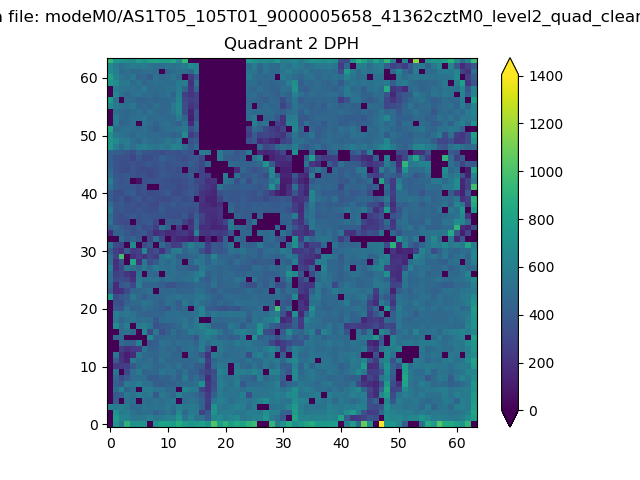
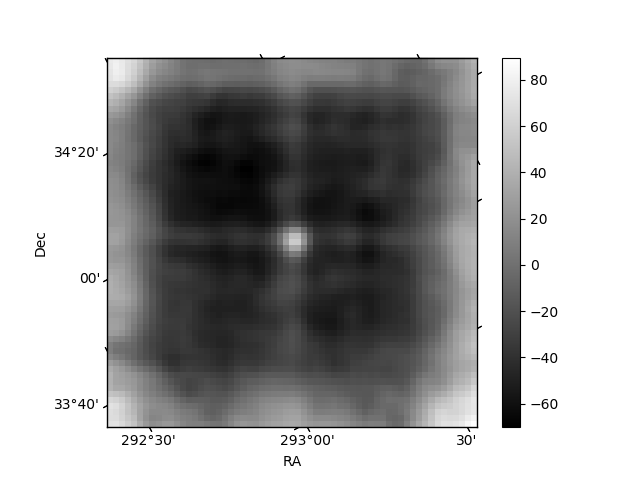
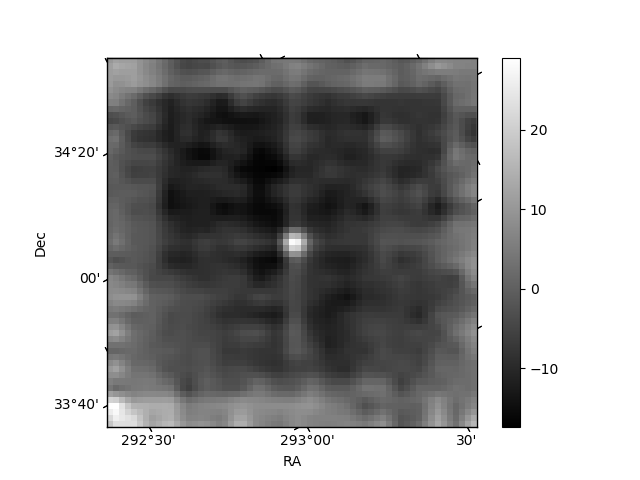
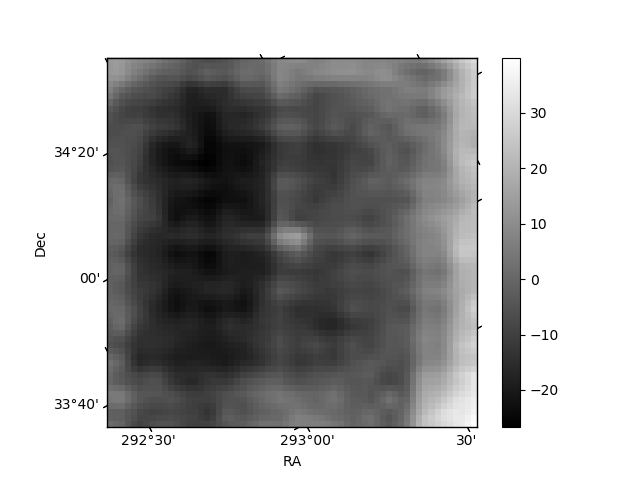
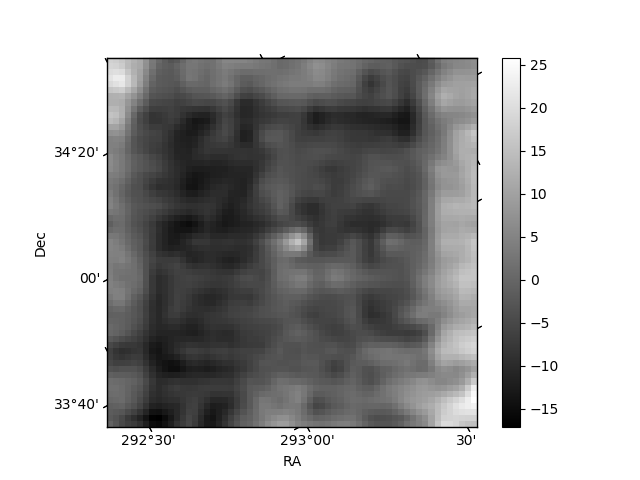
Histogram calculated using DETX and DETY for each event in the final _common_clean file
| Quadrant A | 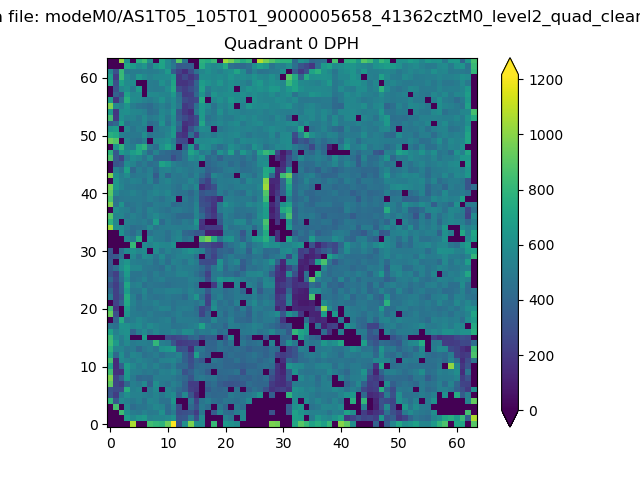 |
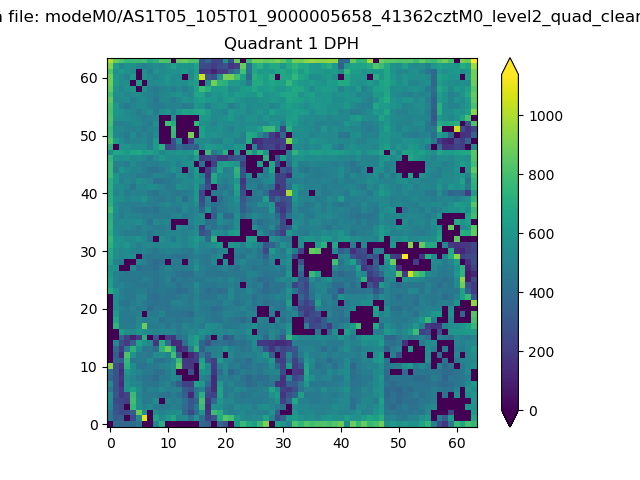 |
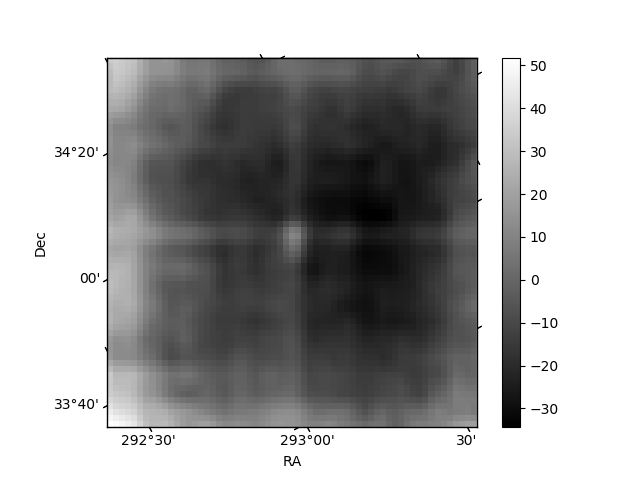
Quadrant B |
|---|---|---|---|
| Quadrant D | 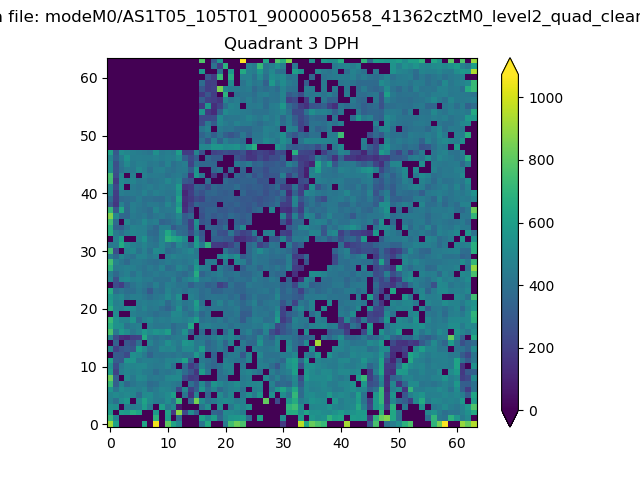 |
 |
Quadrant C |
| Plot type | Count rate plots | Images |
|---|---|---|
| Comparison with Poisson distribution Blue bars denote a histogram of data divided into 1 sec bins. Red curve is a Poisson curve with rate = median count rate of data. |
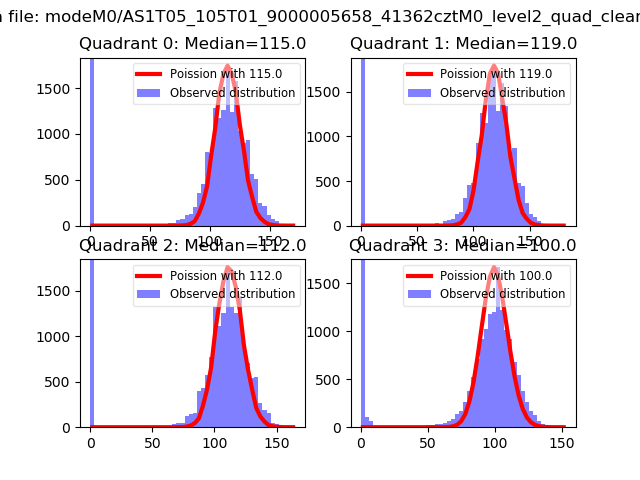 |
 |
| Quadrant-wise count rates Data is divided into 100 sec bins |
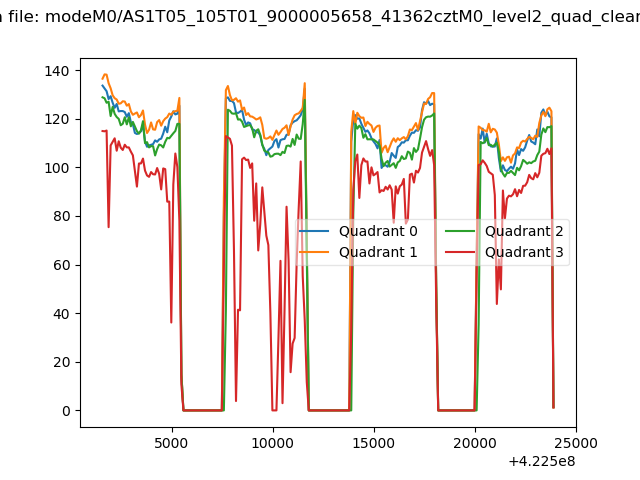 |
|
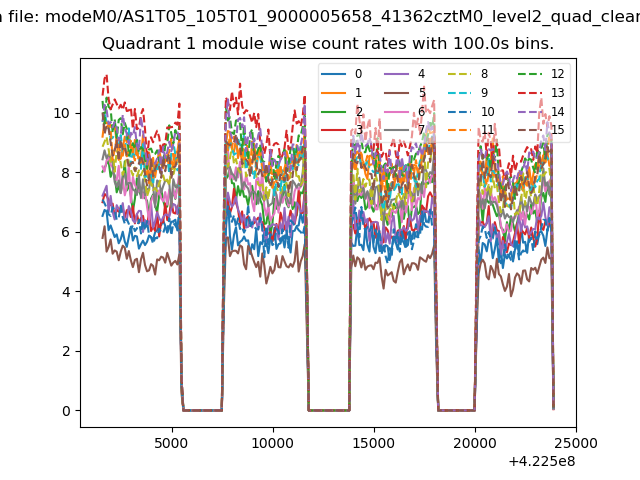
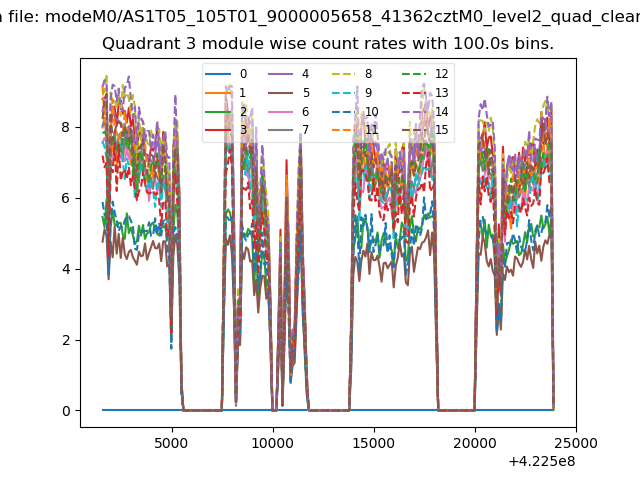
| Module-wise count rates for Quadrant A Data is divided into 100 sec bins |
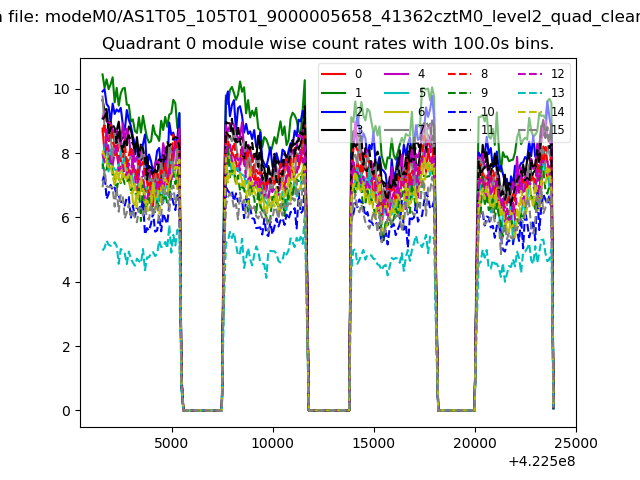 |
 |
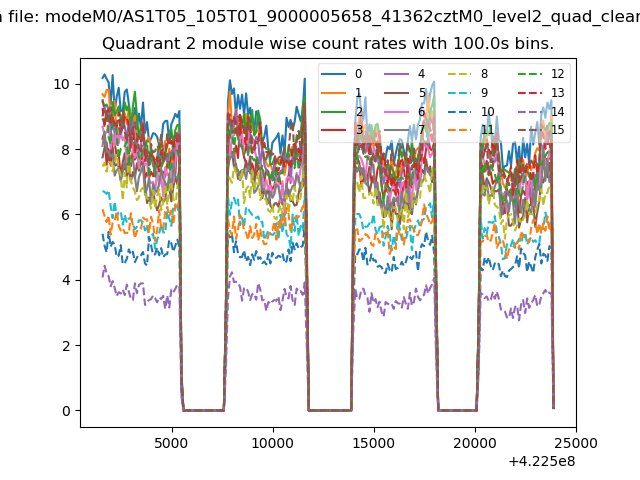
| Module-wise count rates for Quadrant B Data is divided into 100 sec bins |
 |
 |
| Module-wise count rates for Quadrant C Data is divided into 100 sec bins |
 |
 |
| Module-wise count rates for Quadrant D Data is divided into 100 sec bins |
 |
 |
| Parameter | Plot |
|---|---|
| CZT HV Monitor | 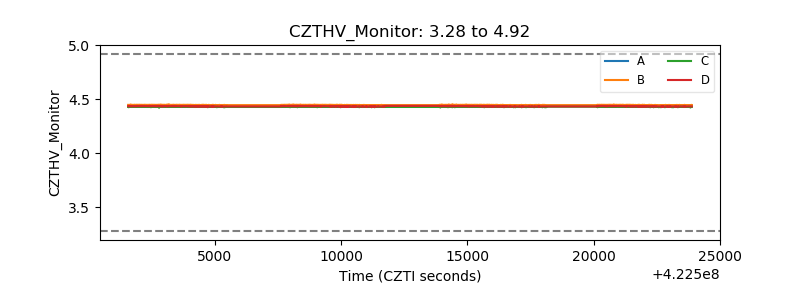 |
| D_VDD | 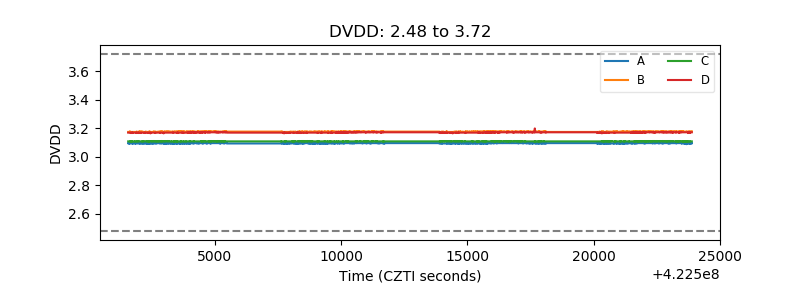 |
| Temperature 1 | 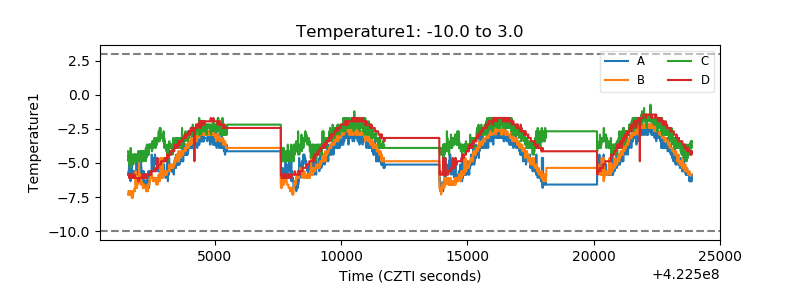 |
| Veto HV Monitor | 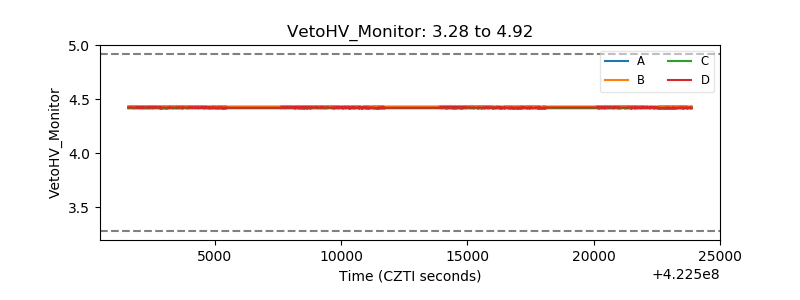 |
| Veto LLD | 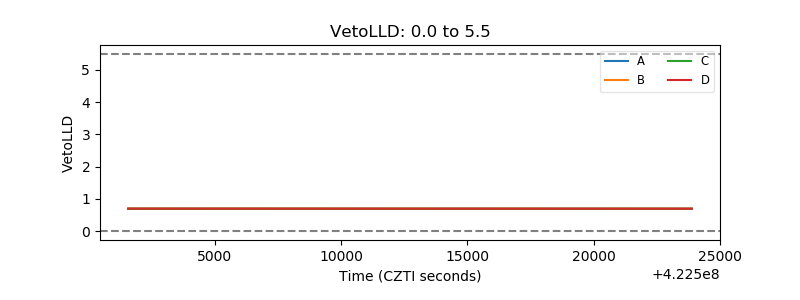 |
| Alpha Counter | 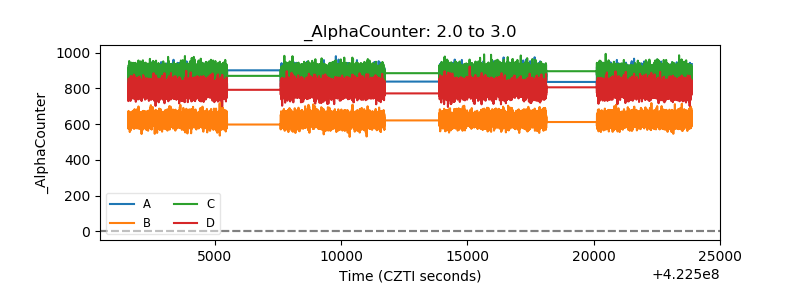 |
| _CPM_Rate | 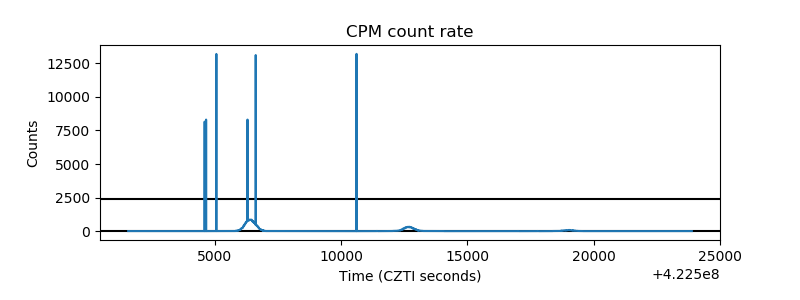 |
| CZT Counter | 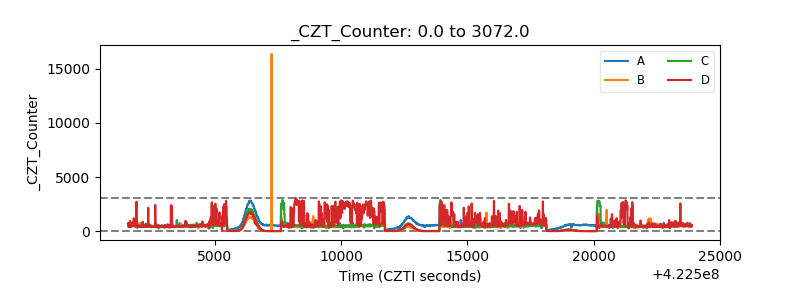 |
| +2.5 Volts monitor | 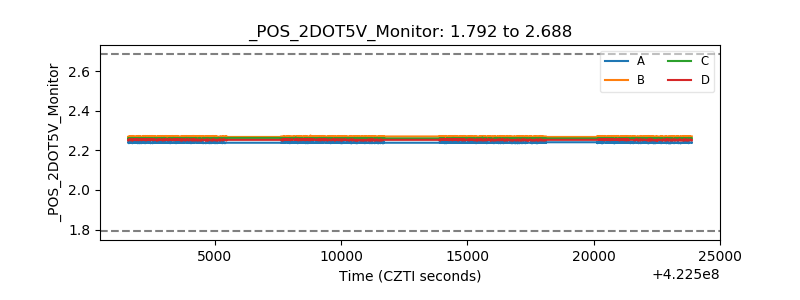 |
| +5 Volts monitor | 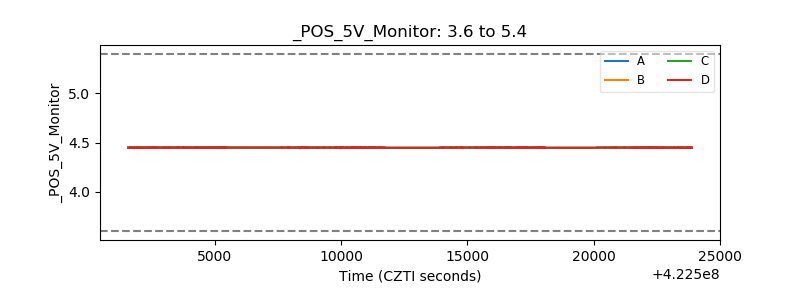 |
| _ROLL_ROT | 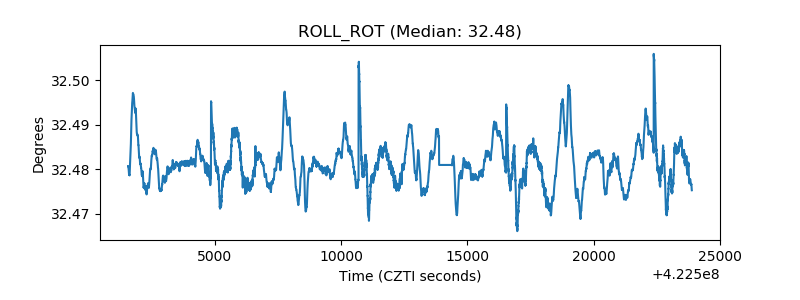 |
| _Roll_DEC |  |
| _Roll_RA | 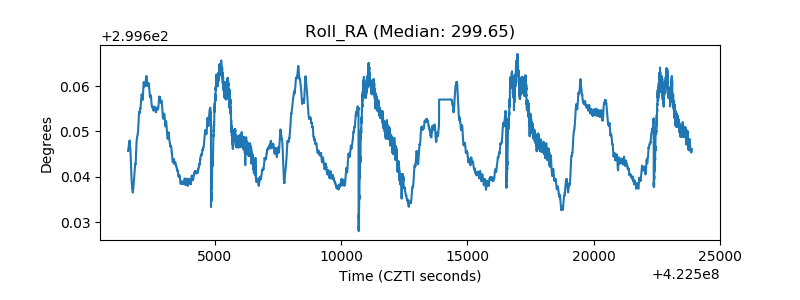 |
| Veto Counter | 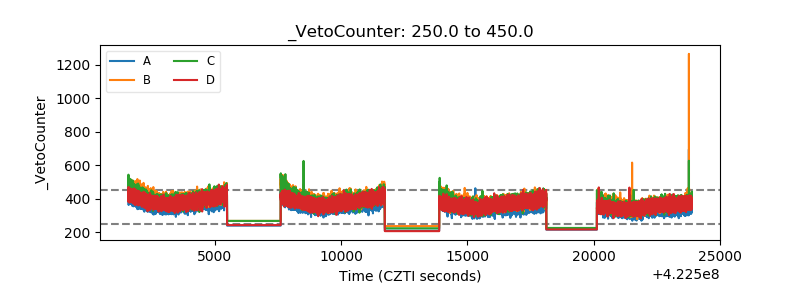 |