| Param | Original file | Final file |
|---|---|---|
| Filename | modeM0/AS1A12_035T01_9000005660_41362cztM0_level2.fits | modeM0/AS1A12_035T01_9000005660_41362cztM0_level2_quad_clean.evt |
| Size (bytes) | 70,922,880 | 17,634,240 |
| Size | 67.6 MB | 16.8 MB |
| Events in quadrant A | 616,092 | 118,454 |
| Events in quadrant B | 586,596 | 118,139 |
| Events in quadrant C | 809,693 | 104,192 |
| Events in quadrant D | 522,701 | 107,902 |
| Mode M0 | |||
|---|---|---|---|
| Quadrant | BADHDUFLAG | Total packets | Discarded packets |
| A | 0 | 2536 | 2 |
| B | 0 | 2585 | 1 |
| C | 0 | 3128 | 1 |
| D | 0 | 2314 | 1 |
| Mode SS | |||
|---|---|---|---|
| Quadrant | BADHDUFLAG | Total packets | Discarded packets |
| A | 0 | 24 | 0 |
| B | 0 | 24 | 0 |
| C | 0 | 24 | 0 |
| D | 0 | 24 | 0 |
| Mode M9 | |||
|---|---|---|---|
| Quadrant | BADHDUFLAG | Total packets | Discarded packets |
| A | 0 | 15 | 0 |
| B | 0 | 15 | 0 |
| C | 0 | 15 | 0 |
| D | 0 | 15 | 0 |
| Quadrant | Total seconds | Saturated seconds | Saturation percentage |
|---|---|---|---|
| A | 1120 | 2 | 0.178571% |
| B | 1120 | 46 | 4.107143% |
| C | 1120 | 118 | 10.535714% |
| D | 1120 | 2 | 0.178571% |
Noise dominated data is calculated using 1-second bins in cleaned event files. If a bin has >2000 counts, and if more than 50% of those come from <1% of pixels, then it is considered to be noise-dominated and hence unusable.
| Quadrant | # 1 sec bins | Bins with >0 counts | Bins with >2000 counts | High rate bins dominated by noise | Noise dominated (total time) | Noise dominated (detector-on time) | Marked lightcurve |
|---|---|---|---|---|---|---|---|
| A | 1120 | 1120 | 2 | 2 | 0.18% | 0.18% | 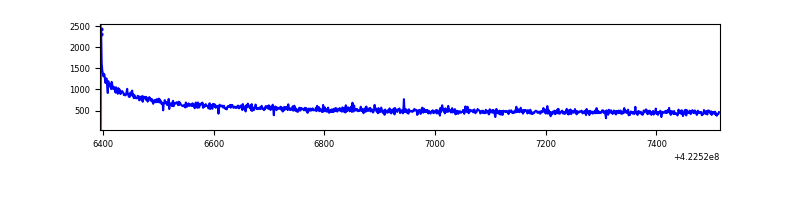 |
| B | 1120 | 1120 | 42 | 42 | 3.75% | 3.75% | 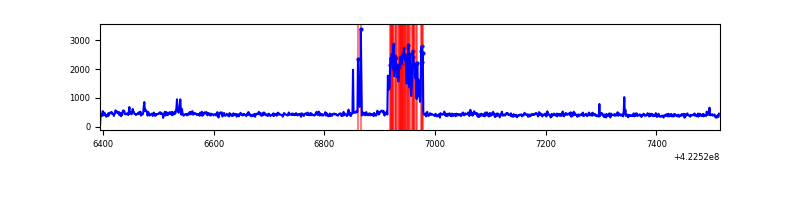 |
| C | 1120 | 1120 | 117 | 117 | 10.45% | 10.45% | 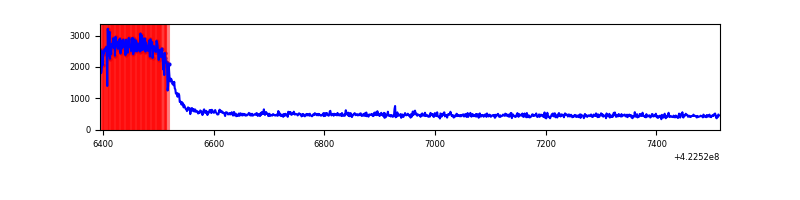 |
| D | 1120 | 1120 | 0 | 0 | 0.00% | 0.00% | 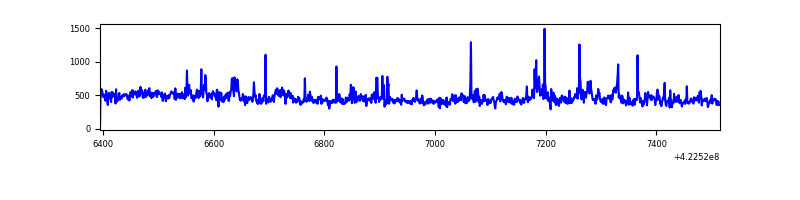 |
Top three noisy pixels from each quadrant. If the there are fewer than three noisy pixels in the level2.evt file, extra rows are filled as -1
| Pixel properties | Quadrant properties | ||||||
|---|---|---|---|---|---|---|---|
| Quadrant | DetID | PixID | Counts | Sigma | Mean | Median | Sigma |
| A | 10 | 83 | 157963 | 6010.16 | 118 | 115 | 26.3 |
| A | 10 | 67 | 1553 | 54.75 | 118 | 115 | 26.3 |
| A | 3 | 137 | 1258 | 43.52 | 118 | 115 | 26.3 |
| B | 0 | 229 | 122918 | 4921.59 | 115 | 112 | 25.0 |
| B | 5 | 255 | 8589 | 339.73 | 115 | 112 | 25.0 |
| B | 12 | 111 | 2898 | 111.65 | 115 | 112 | 25.0 |
| C | 0 | 10 | 338651 | 12467.36 | 107 | 107 | 27.2 |
| C | 15 | 214 | 49662 | 1824.93 | 107 | 107 | 27.2 |
| C | 15 | 111 | 1082 | 35.91 | 107 | 107 | 27.2 |
| D | 5 | 222 | 28157 | 931.17 | 117 | 114 | 30.1 |
| D | 1 | 52 | 16261 | 536.16 | 117 | 114 | 30.1 |
| D | 13 | 249 | 13466 | 443.35 | 117 | 114 | 30.1 |
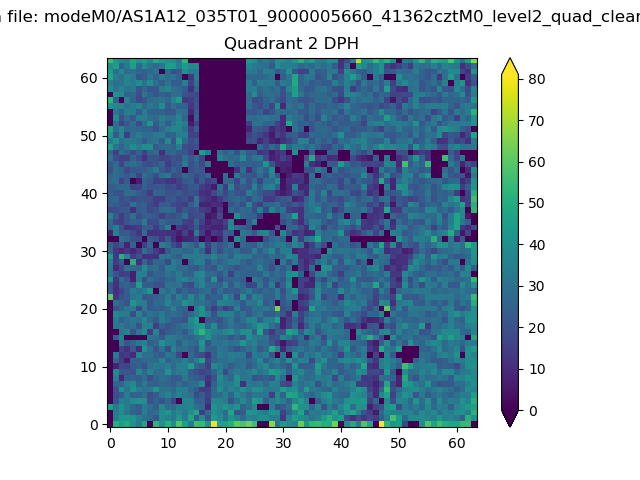
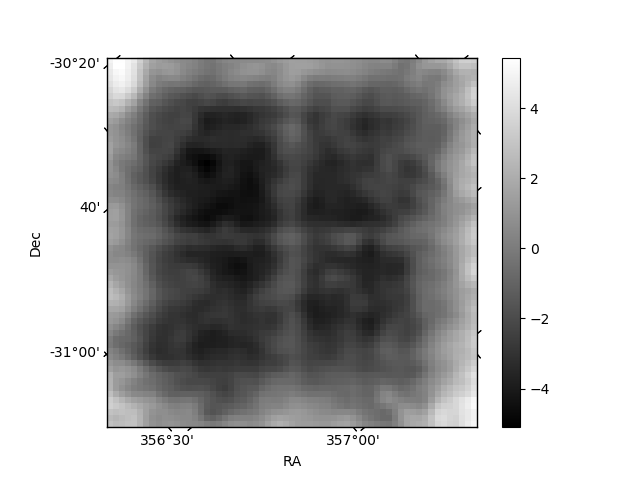
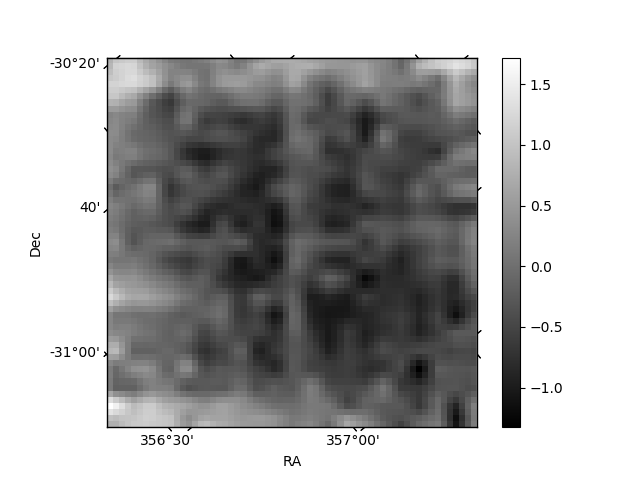
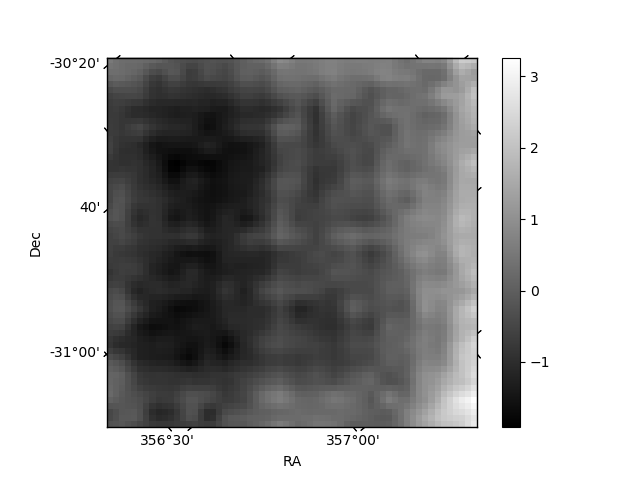
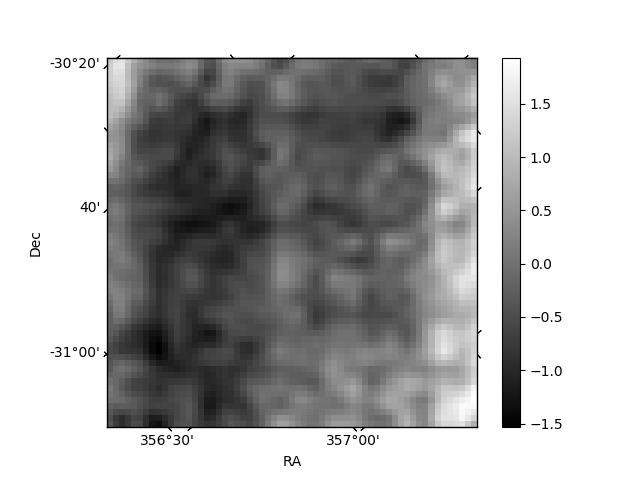
Histogram calculated using DETX and DETY for each event in the final _common_clean file
| Quadrant A | 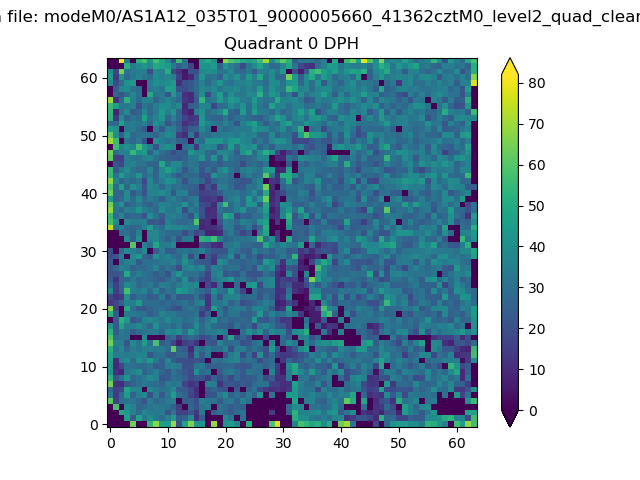 |
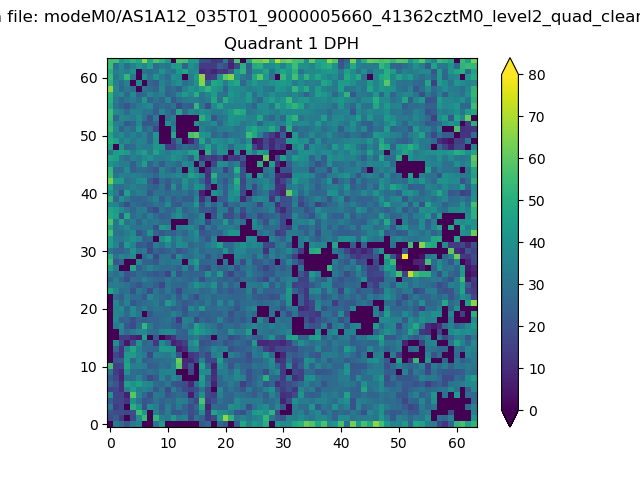 |
Quadrant B |
|---|---|---|---|
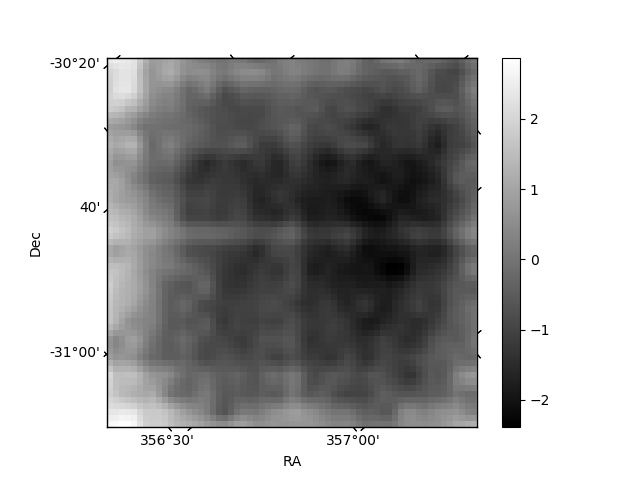
| Quadrant D | 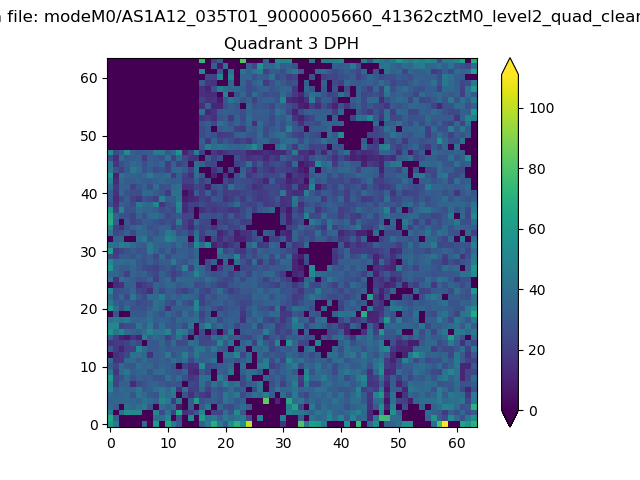 |
 |
Quadrant C |
| Plot type | Count rate plots | Images |
|---|---|---|
| Comparison with Poisson distribution Blue bars denote a histogram of data divided into 1 sec bins. Red curve is a Poisson curve with rate = median count rate of data. |
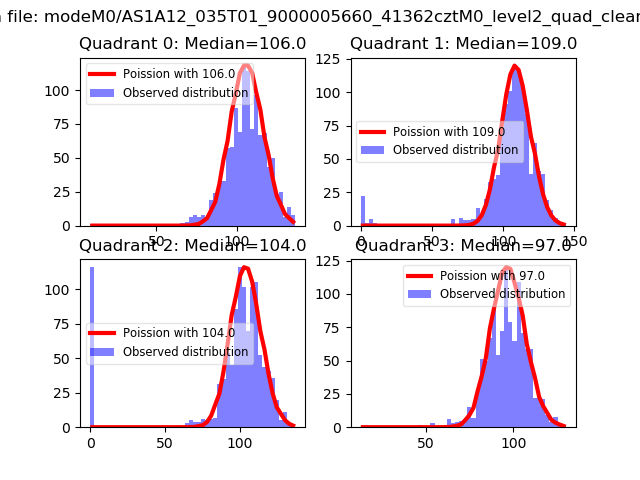 |
 |
| Quadrant-wise count rates Data is divided into 100 sec bins |
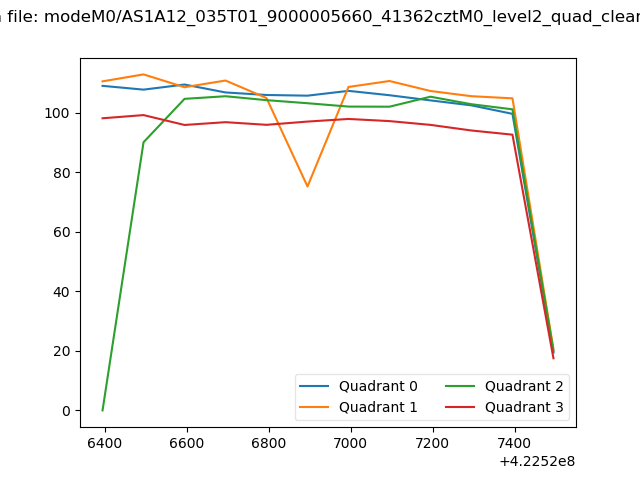 |
|
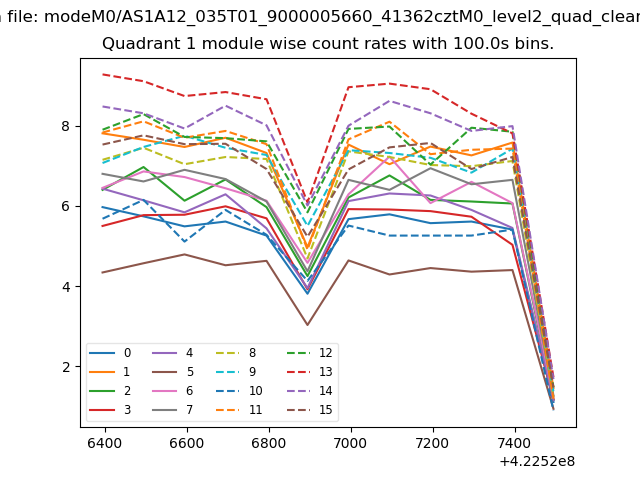
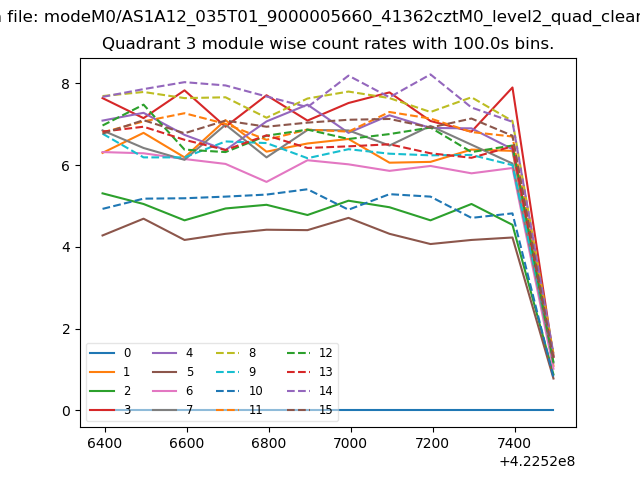
| Module-wise count rates for Quadrant A Data is divided into 100 sec bins |
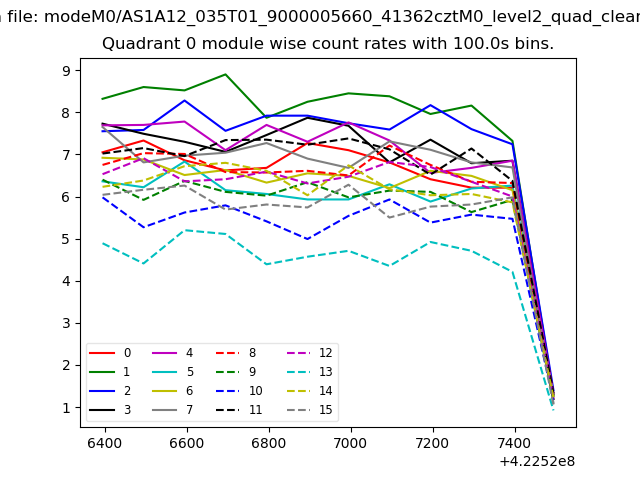 |
 |
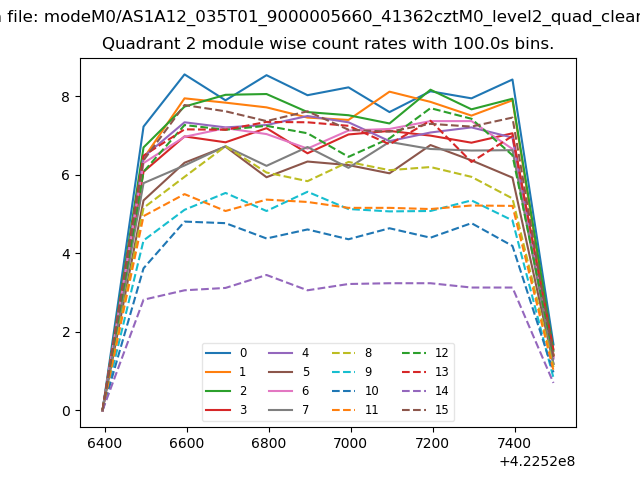
| Module-wise count rates for Quadrant B Data is divided into 100 sec bins |
 |
 |
| Module-wise count rates for Quadrant C Data is divided into 100 sec bins |
 |
 |
| Module-wise count rates for Quadrant D Data is divided into 100 sec bins |
 |
 |
| Parameter | Plot |
|---|---|
| CZT HV Monitor | 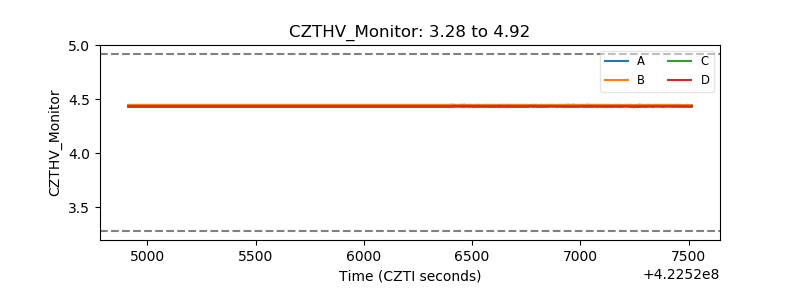 |
| D_VDD | 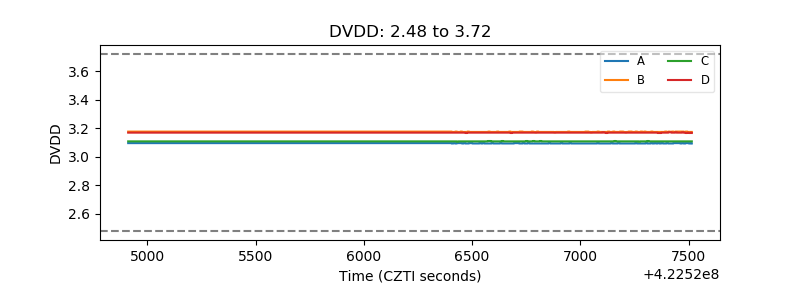 |
| Temperature 1 | 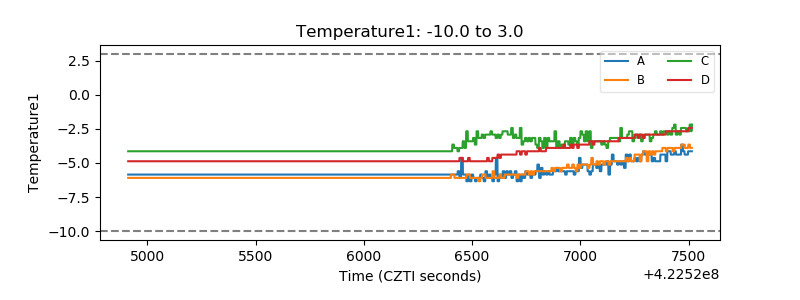 |
| Veto HV Monitor | 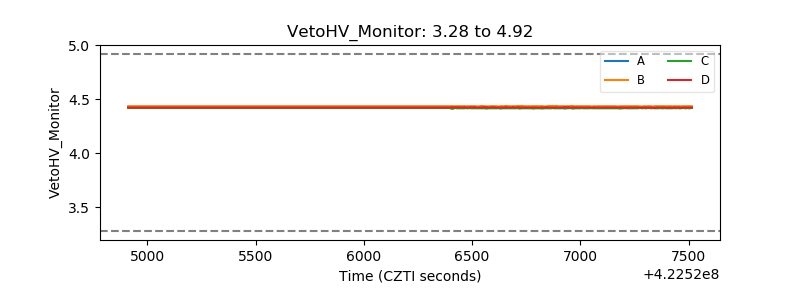 |
| Veto LLD | 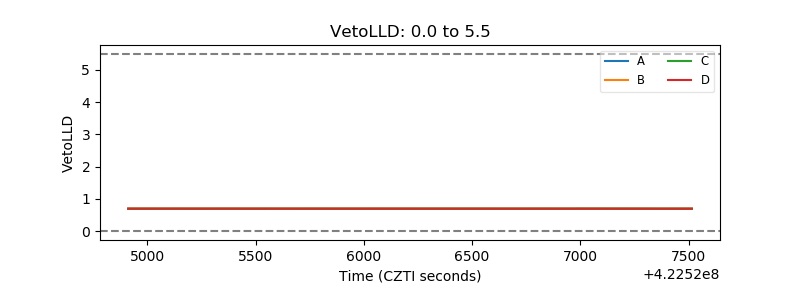 |
| Alpha Counter | 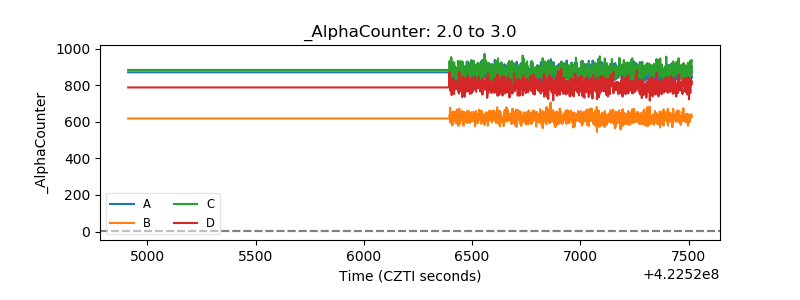 |
| _CPM_Rate | 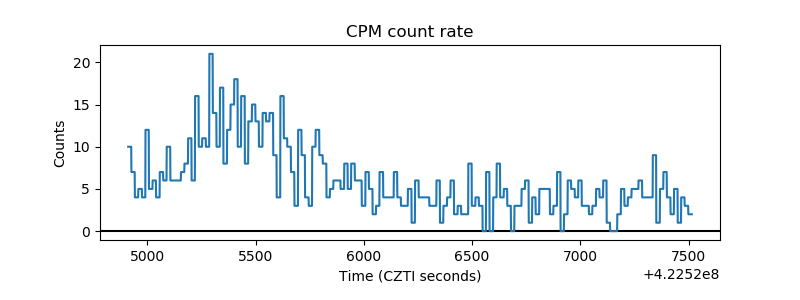 |
| CZT Counter | 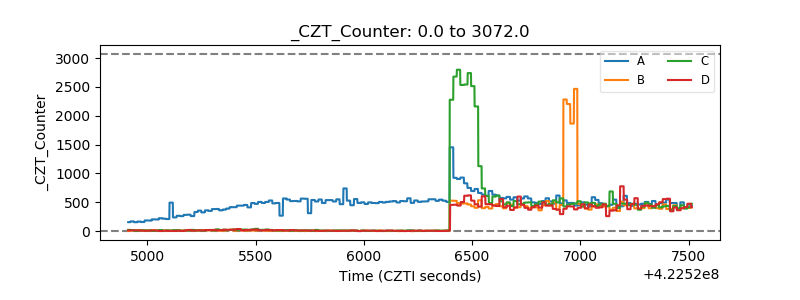 |
| +2.5 Volts monitor | 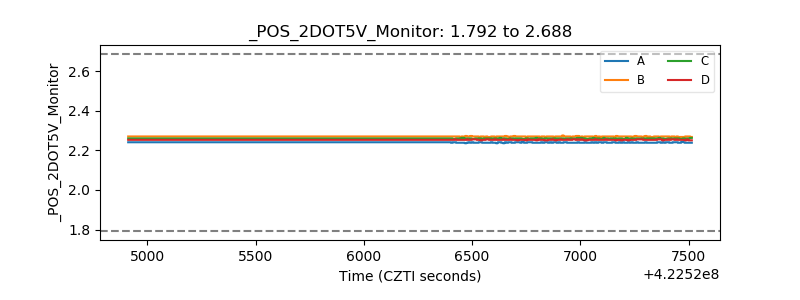 |
| +5 Volts monitor | 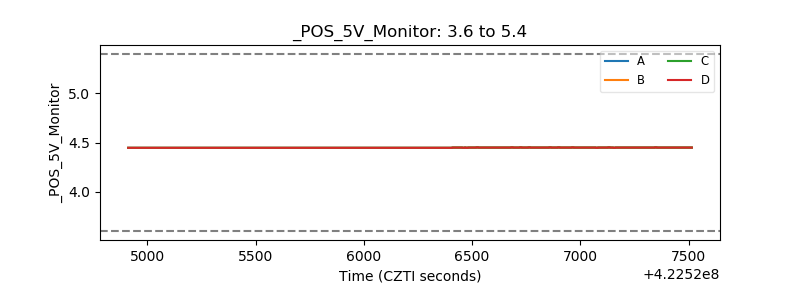 |
| _ROLL_ROT | 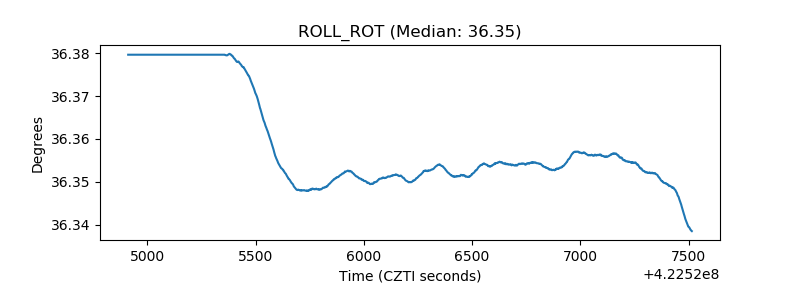 |
| _Roll_DEC |  |
| _Roll_RA | 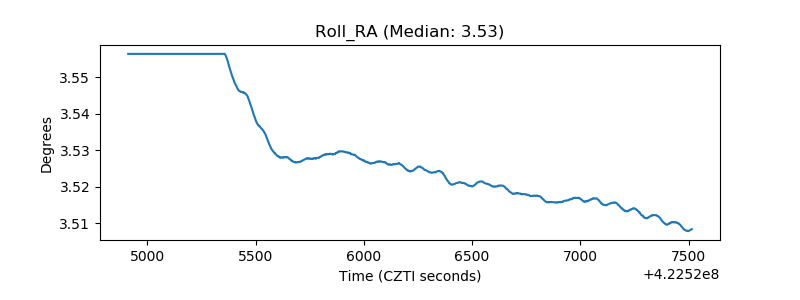 |
| Veto Counter | 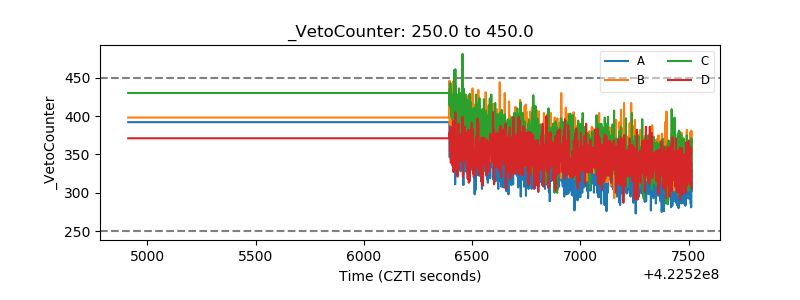 |