| Param | Original file | Final file |
|---|---|---|
| Filename | modeM0/AS1A12_035T01_9000005660_41363cztM0_level2.fits | modeM0/AS1A12_035T01_9000005660_41363cztM0_level2_quad_clean.evt |
| Size (bytes) | 339,166,080 | 92,615,040 |
| Size | 323.5 MB | 88.3 MB |
| Events in quadrant A | 2,978,260 | 619,089 |
| Events in quadrant B | 2,797,441 | 628,663 |
| Events in quadrant C | 3,000,529 | 597,647 |
| Events in quadrant D | 3,326,634 | 553,494 |
| Mode M0 | |||
|---|---|---|---|
| Quadrant | BADHDUFLAG | Total packets | Discarded packets |
| A | 0 | 12271 | 3 |
| B | 0 | 12394 | 2 |
| C | 0 | 12655 | 2 |
| D | 0 | 13899 | 2 |
| Mode SS | |||
|---|---|---|---|
| Quadrant | BADHDUFLAG | Total packets | Discarded packets |
| A | 0 | 118 | 0 |
| B | 0 | 118 | 0 |
| C | 0 | 118 | 0 |
| D | 0 | 118 | 0 |
| Mode M9 | |||
|---|---|---|---|
| Quadrant | BADHDUFLAG | Total packets | Discarded packets |
| A | 0 | 23 | 0 |
| B | 0 | 23 | 0 |
| C | 0 | 23 | 0 |
| D | 0 | 24 | 0 |
| Quadrant | Total seconds | Saturated seconds | Saturation percentage |
|---|---|---|---|
| A | 5797 | 7 | 0.120752% |
| B | 5797 | 79 | 1.362774% |
| C | 5797 | 128 | 2.208039% |
| D | 5797 | 139 | 2.397792% |
Noise dominated data is calculated using 1-second bins in cleaned event files. If a bin has >2000 counts, and if more than 50% of those come from <1% of pixels, then it is considered to be noise-dominated and hence unusable.
| Quadrant | # 1 sec bins | Bins with >0 counts | Bins with >2000 counts | High rate bins dominated by noise | Noise dominated (total time) | Noise dominated (detector-on time) | Marked lightcurve |
|---|---|---|---|---|---|---|---|
| A | 7200 | 5798 | 4 | 4 | 0.06% | 0.07% | 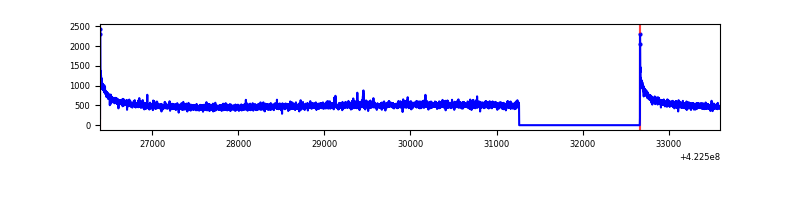 |
| B | 7200 | 5798 | 60 | 60 | 0.83% | 1.03% | 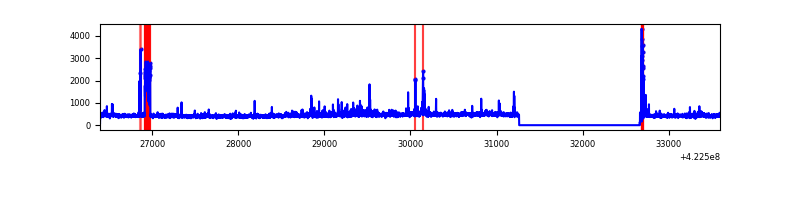 |
| C | 7200 | 5798 | 124 | 124 | 1.72% | 2.14% | 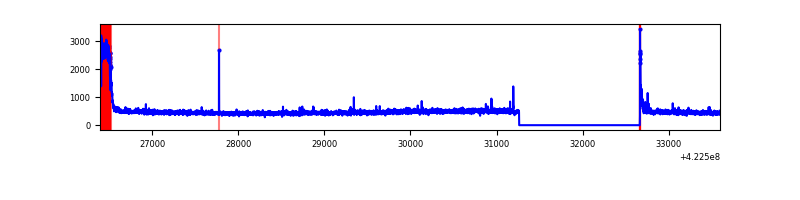 |
| D | 7200 | 5798 | 136 | 136 | 1.89% | 2.35% | 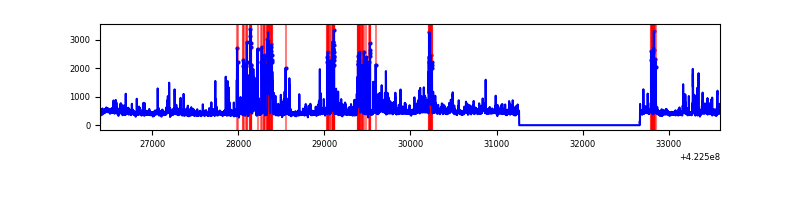 |
Top three noisy pixels from each quadrant. If the there are fewer than three noisy pixels in the level2.evt file, extra rows are filled as -1
| Pixel properties | Quadrant properties | ||||||
|---|---|---|---|---|---|---|---|
| Quadrant | DetID | PixID | Counts | Sigma | Mean | Median | Sigma |
| A | 10 | 83 | 527935 | 4055.03 | 631 | 618 | 130.0 |
| A | 2 | 79 | 9414 | 67.64 | 631 | 618 | 130.0 |
| A | 12 | 189 | 8564 | 61.1 | 631 | 618 | 130.0 |
| B | 0 | 229 | 154389 | 1252.72 | 620 | 603 | 122.8 |
| B | 5 | 255 | 120345 | 975.4 | 620 | 603 | 122.8 |
| B | 0 | 190 | 63486 | 512.24 | 620 | 603 | 122.8 |
| C | 0 | 10 | 375719 | 2655.2 | 605 | 608 | 141.3 |
| C | 15 | 214 | 247987 | 1751.06 | 605 | 608 | 141.3 |
| C | 15 | 111 | 10367 | 69.08 | 605 | 608 | 141.3 |
| D | 13 | 249 | 301128 | 2009.94 | 611 | 595 | 149.5 |
| D | 5 | 222 | 230516 | 1537.69 | 611 | 595 | 149.5 |
| D | 1 | 52 | 167116 | 1113.68 | 611 | 595 | 149.5 |
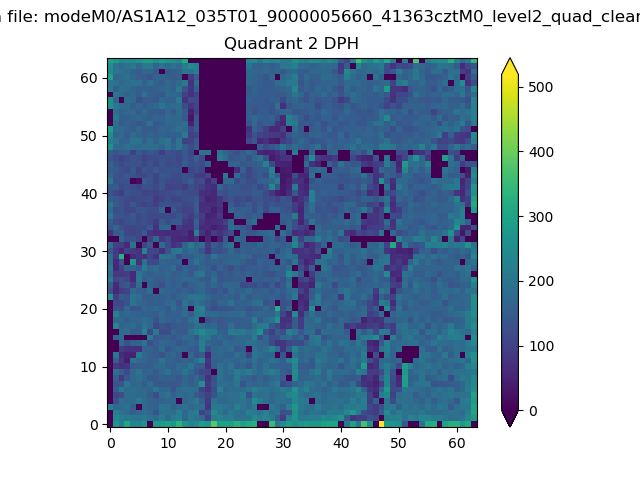
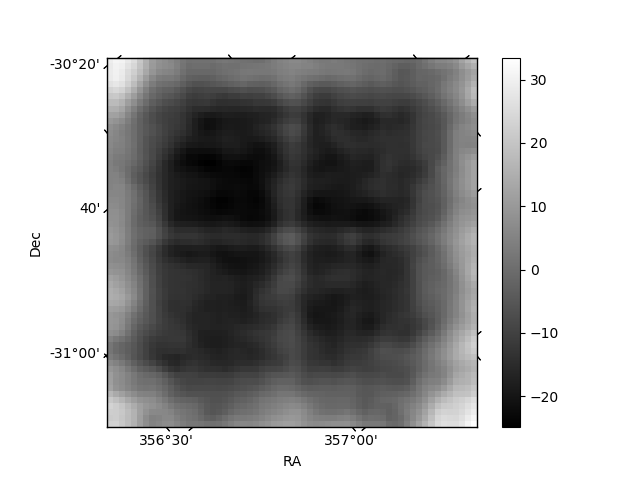
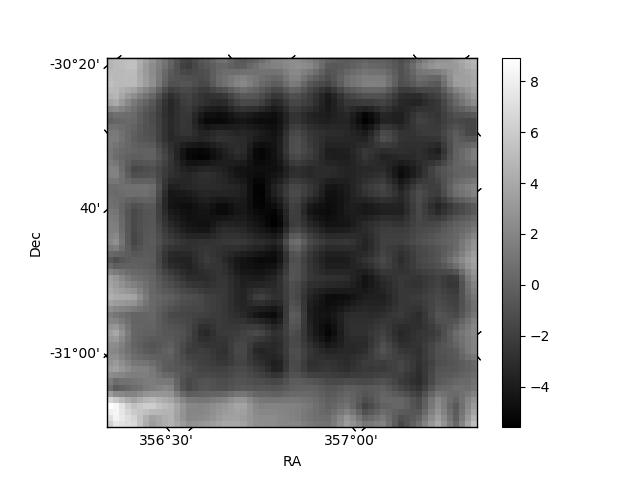
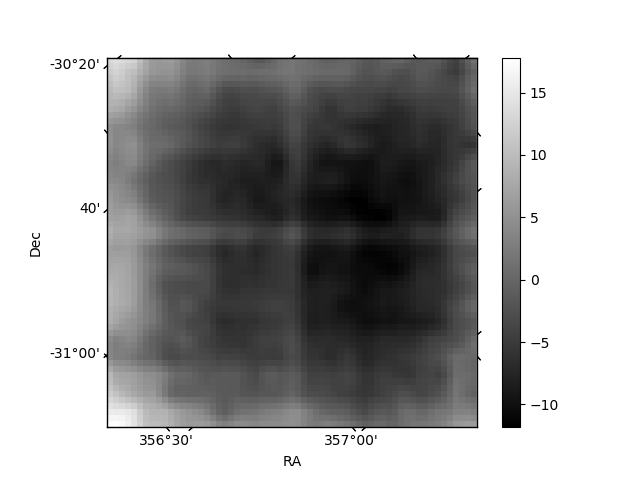
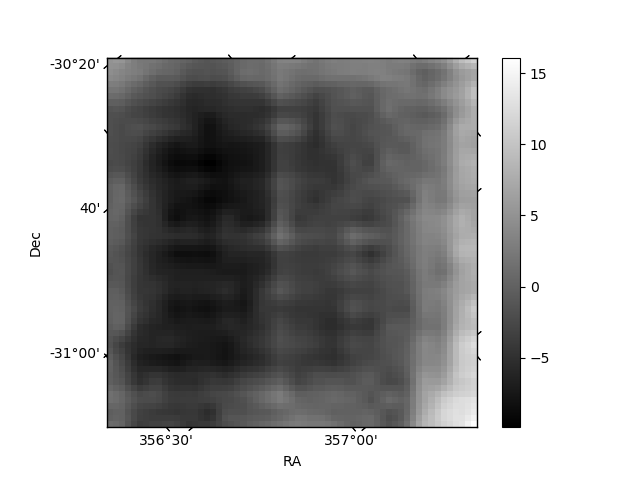
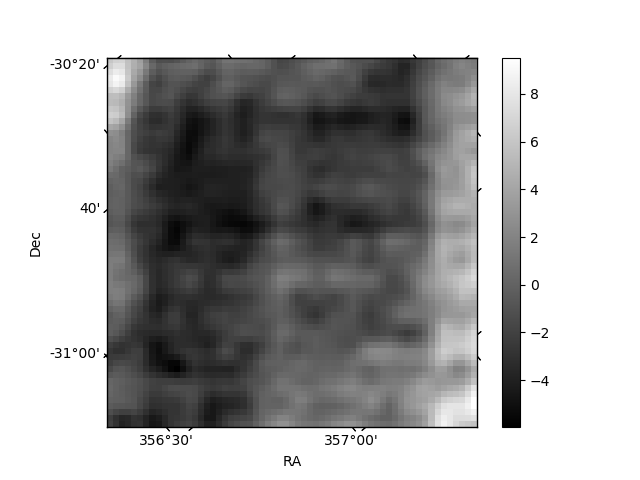
Histogram calculated using DETX and DETY for each event in the final _common_clean file
| Quadrant A | 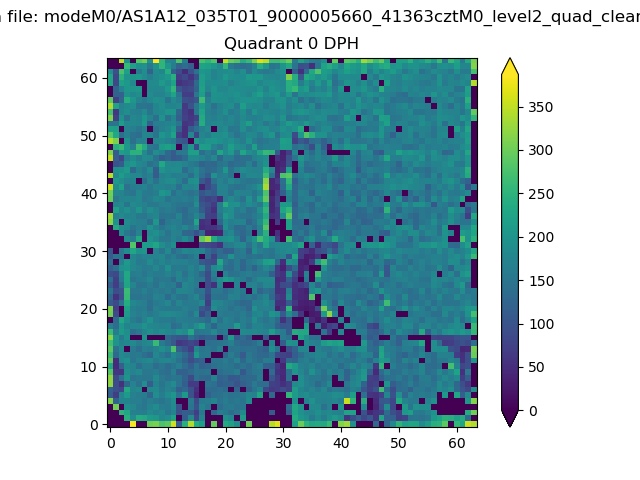 |
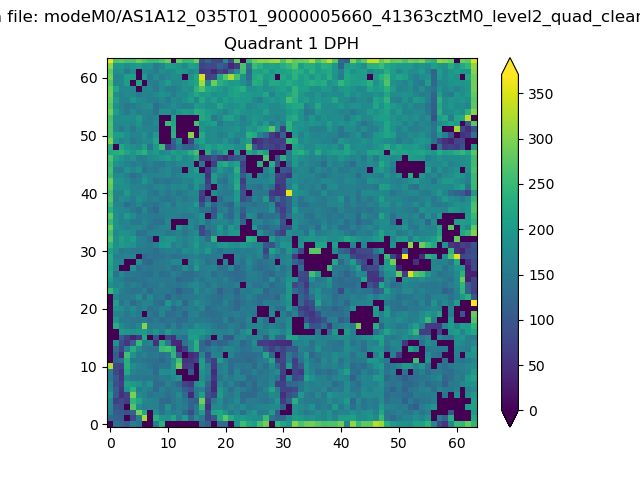 |
Quadrant B |
|---|---|---|---|
| Quadrant D | 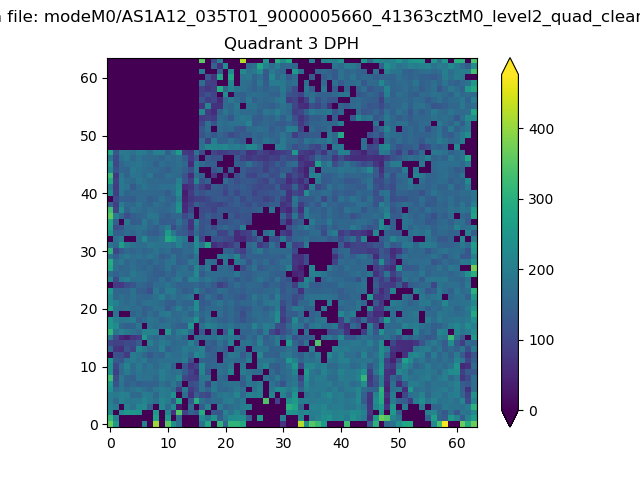 |
 |
Quadrant C |
| Plot type | Count rate plots | Images |
|---|---|---|
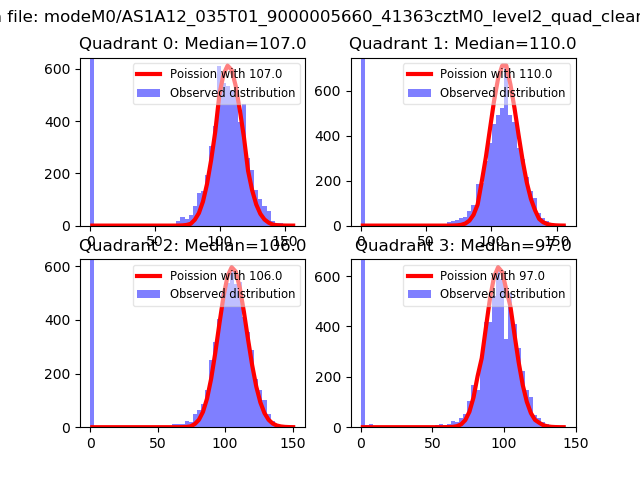
| Comparison with Poisson distribution Blue bars denote a histogram of data divided into 1 sec bins. Red curve is a Poisson curve with rate = median count rate of data. |
 |
 |
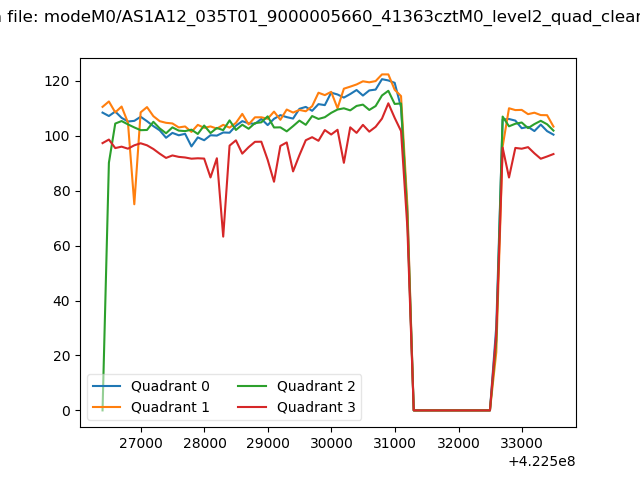
| Quadrant-wise count rates Data is divided into 100 sec bins |
 |
|
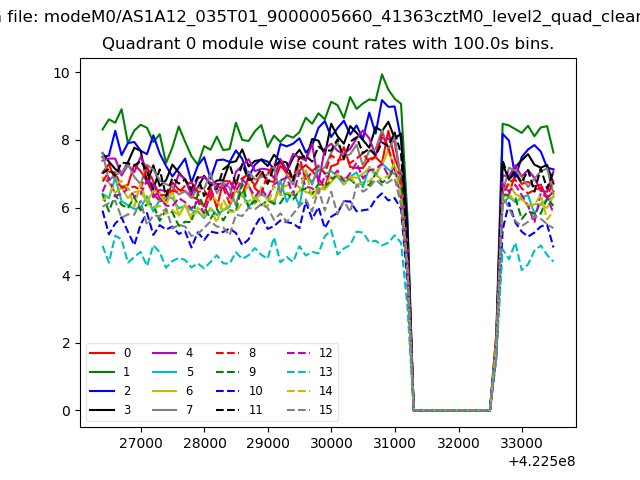
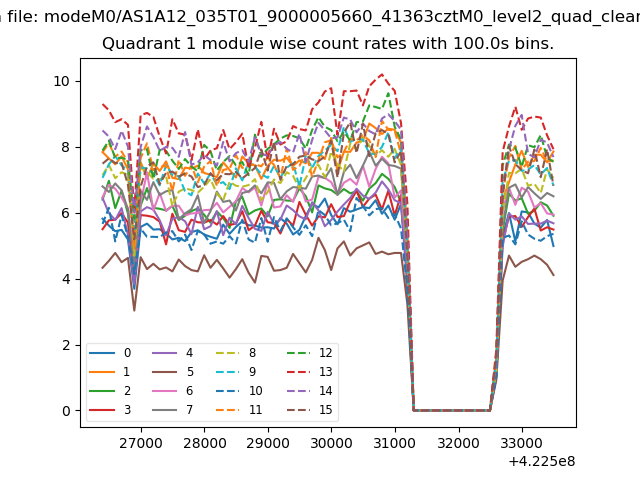
| Module-wise count rates for Quadrant A Data is divided into 100 sec bins |
 |
 |
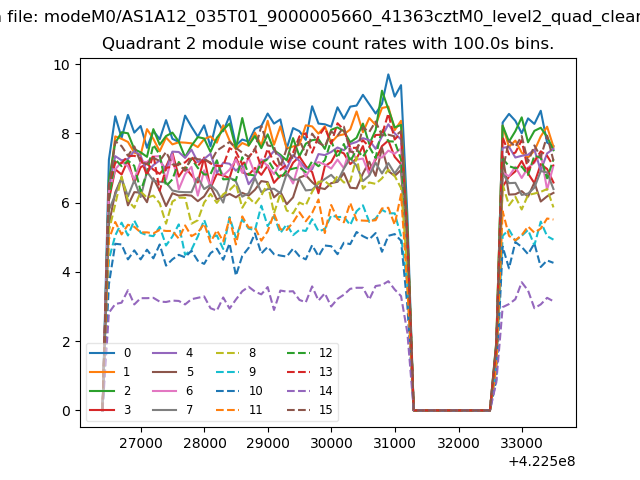
| Module-wise count rates for Quadrant B Data is divided into 100 sec bins |
 |
 |
| Module-wise count rates for Quadrant C Data is divided into 100 sec bins |
 |
 |
| Module-wise count rates for Quadrant D Data is divided into 100 sec bins |
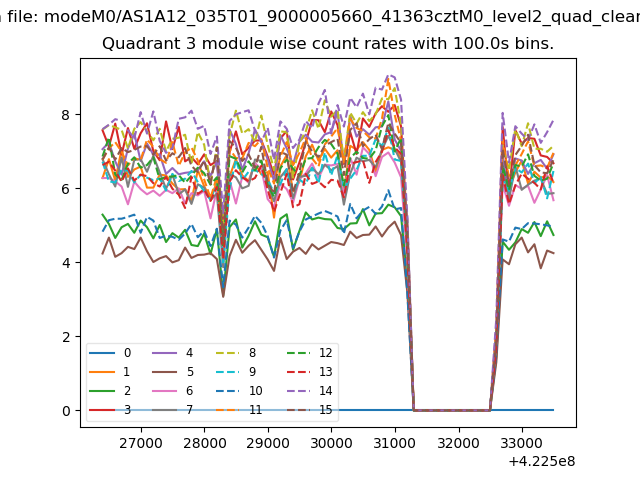 |
 |
| Parameter | Plot |
|---|---|
| CZT HV Monitor | 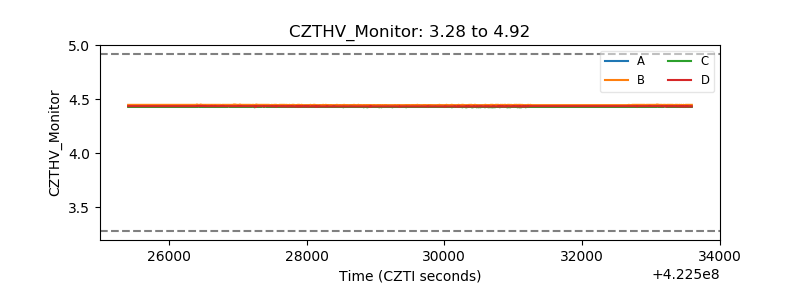 |
| D_VDD | 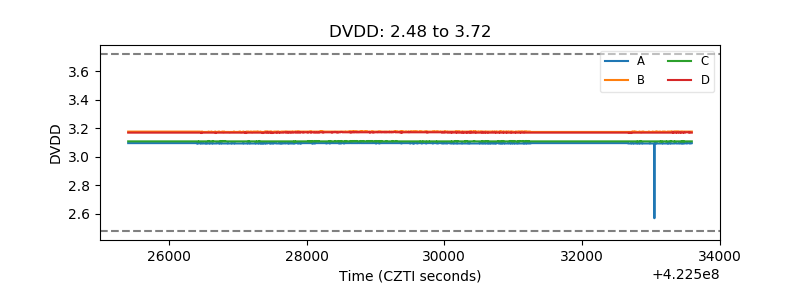 |
| Temperature 1 | 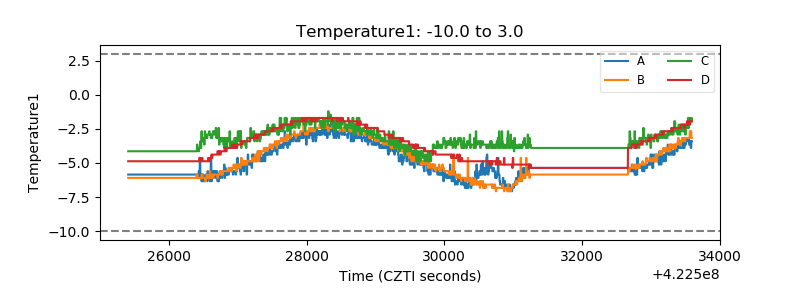 |
| Veto HV Monitor | 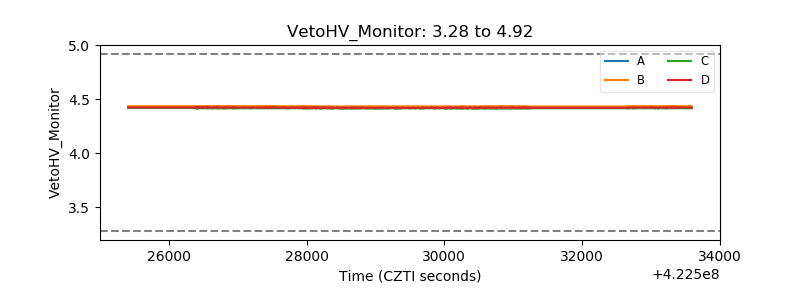 |
| Veto LLD | 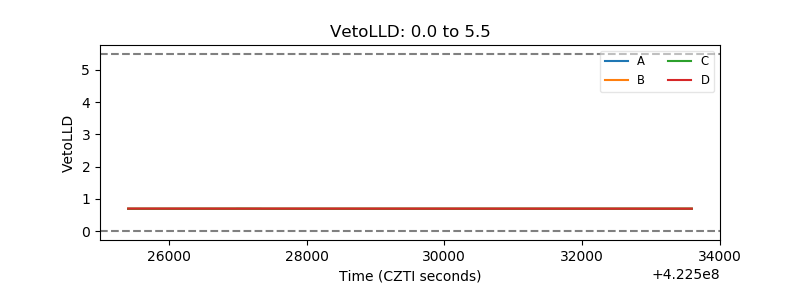 |
| Alpha Counter | 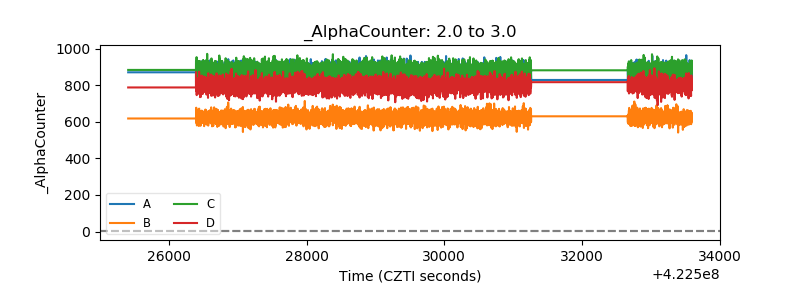 |
| _CPM_Rate | 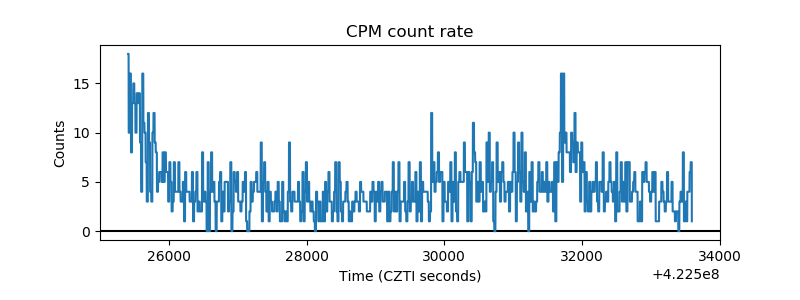 |
| CZT Counter | 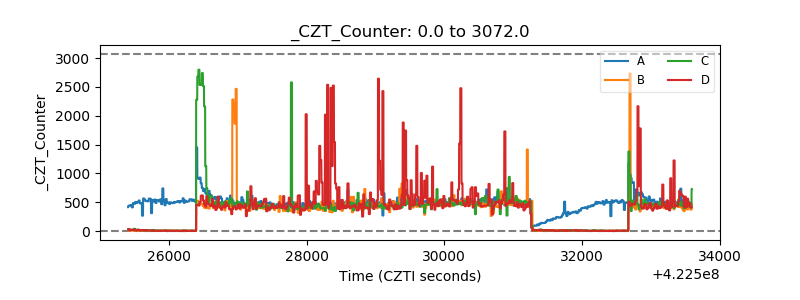 |
| +2.5 Volts monitor | 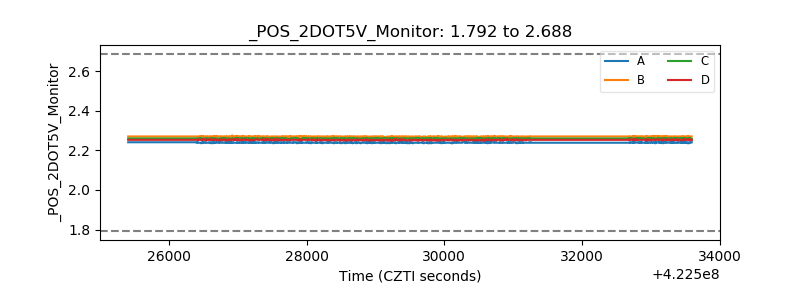 |
| +5 Volts monitor |  |
| _ROLL_ROT | 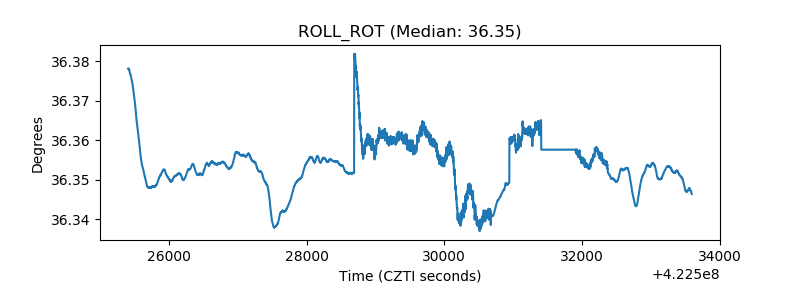 |
| _Roll_DEC | 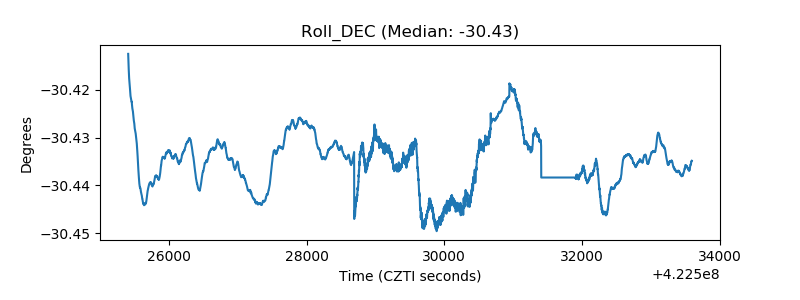 |
| _Roll_RA | 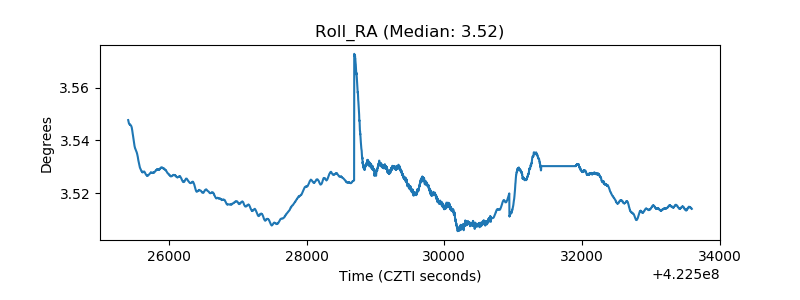 |
| Veto Counter | 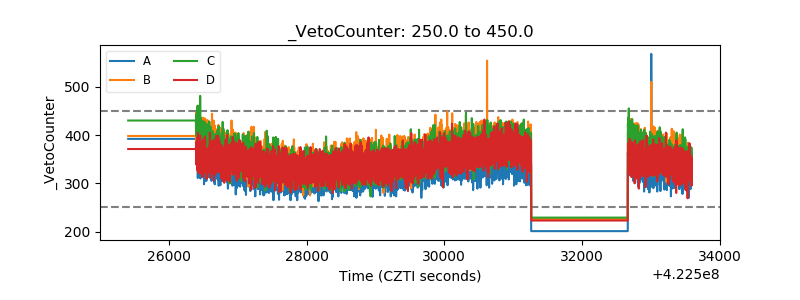 |