| Param | Original file | Final file |
|---|---|---|
| Filename | modeM0/AS1A12_035T01_9000005660_41364cztM0_level2.fits | modeM0/AS1A12_035T01_9000005660_41364cztM0_level2_quad_clean.evt |
| Size (bytes) | 335,393,280 | 92,188,800 |
| Size | 319.9 MB | 87.9 MB |
| Events in quadrant A | 3,075,138 | 610,373 |
| Events in quadrant B | 2,705,331 | 626,470 |
| Events in quadrant C | 2,757,612 | 599,428 |
| Events in quadrant D | 3,427,019 | 551,197 |
| Mode M0 | |||
|---|---|---|---|
| Quadrant | BADHDUFLAG | Total packets | Discarded packets |
| A | 0 | 12500 | 3 |
| B | 0 | 11953 | 2 |
| C | 0 | 11916 | 2 |
| D | 0 | 14149 | 2 |
| Mode SS | |||
|---|---|---|---|
| Quadrant | BADHDUFLAG | Total packets | Discarded packets |
| A | 0 | 118 | 0 |
| B | 0 | 118 | 0 |
| C | 0 | 118 | 0 |
| D | 0 | 118 | 0 |
| Mode M9 | |||
|---|---|---|---|
| Quadrant | BADHDUFLAG | Total packets | Discarded packets |
| A | 0 | 20 | 0 |
| B | 0 | 20 | 0 |
| C | 0 | 20 | 0 |
| D | 0 | 21 | 0 |
| Quadrant | Total seconds | Saturated seconds | Saturation percentage |
|---|---|---|---|
| A | 5775 | 28 | 0.484848% |
| B | 5775 | 30 | 0.519481% |
| C | 5775 | 27 | 0.467532% |
| D | 5775 | 152 | 2.632035% |
Noise dominated data is calculated using 1-second bins in cleaned event files. If a bin has >2000 counts, and if more than 50% of those come from <1% of pixels, then it is considered to be noise-dominated and hence unusable.
| Quadrant | # 1 sec bins | Bins with >0 counts | Bins with >2000 counts | High rate bins dominated by noise | Noise dominated (total time) | Noise dominated (detector-on time) | Marked lightcurve |
|---|---|---|---|---|---|---|---|
| A | 7088 | 5776 | 15 | 15 | 0.21% | 0.26% | 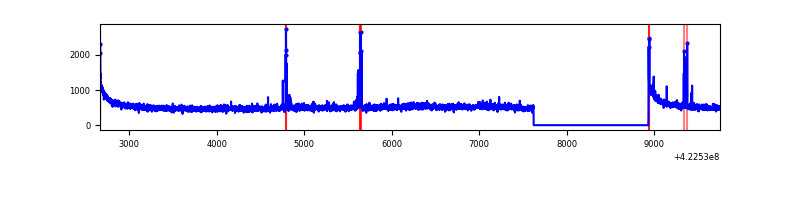 |
| B | 7088 | 5776 | 14 | 14 | 0.20% | 0.24% | 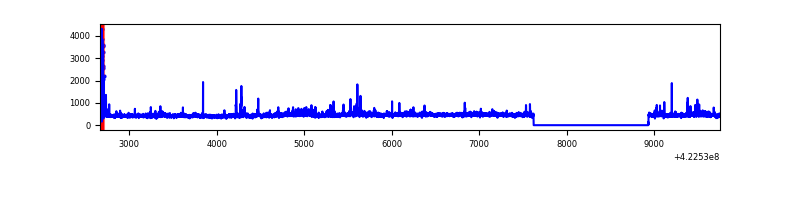 |
| C | 7088 | 5776 | 21 | 21 | 0.30% | 0.36% | 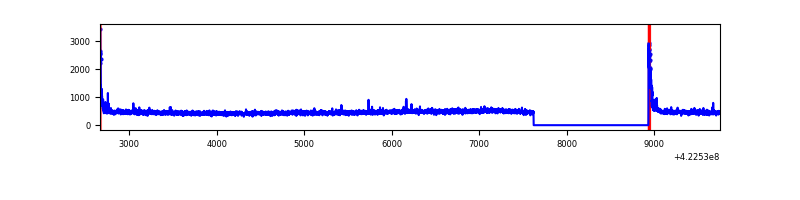 |
| D | 7088 | 5776 | 142 | 142 | 2.00% | 2.46% | 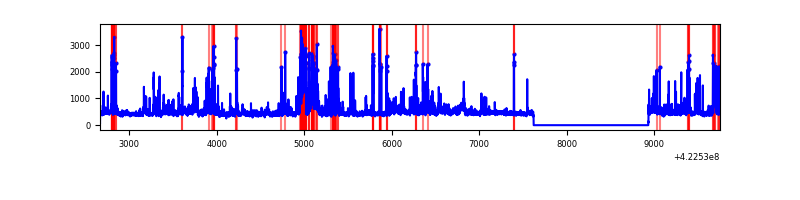 |
Top three noisy pixels from each quadrant. If the there are fewer than three noisy pixels in the level2.evt file, extra rows are filled as -1
| Pixel properties | Quadrant properties | ||||||
|---|---|---|---|---|---|---|---|
| Quadrant | DetID | PixID | Counts | Sigma | Mean | Median | Sigma |
| A | 10 | 83 | 538594 | 4156.87 | 629 | 615 | 129.4 |
| A | 13 | 248 | 44439 | 338.62 | 629 | 615 | 129.4 |
| A | 2 | 79 | 36112 | 274.28 | 629 | 615 | 129.4 |
| B | 5 | 255 | 101373 | 828.41 | 621 | 604 | 121.6 |
| B | 0 | 190 | 49309 | 400.4 | 621 | 604 | 121.6 |
| B | 0 | 155 | 39208 | 317.36 | 621 | 604 | 121.6 |
| C | 15 | 214 | 249857 | 1736.77 | 613 | 616 | 143.5 |
| C | 0 | 10 | 101898 | 705.76 | 613 | 616 | 143.5 |
| C | 15 | 111 | 7426 | 47.45 | 613 | 616 | 143.5 |
| D | 5 | 222 | 395673 | 2615.32 | 612 | 594 | 151.1 |
| D | 1 | 52 | 200347 | 1322.31 | 612 | 594 | 151.1 |
| D | 13 | 249 | 171949 | 1134.33 | 612 | 594 | 151.1 |
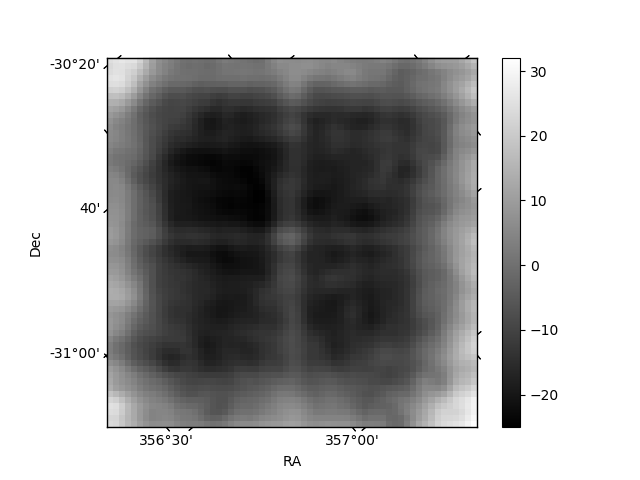
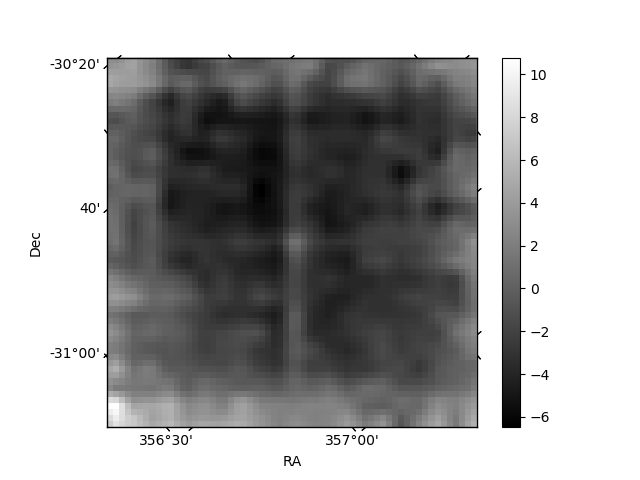
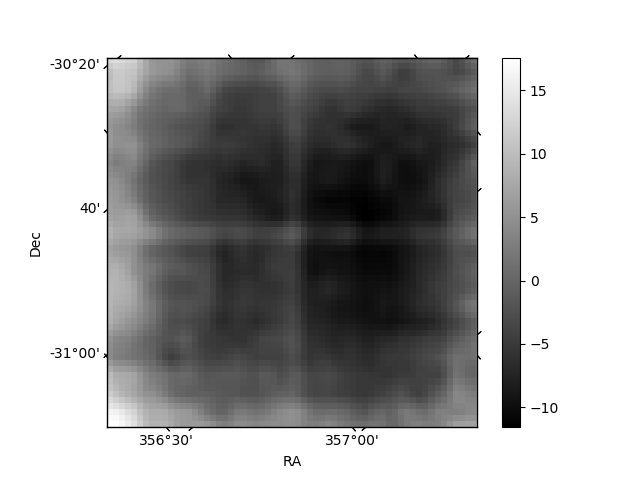
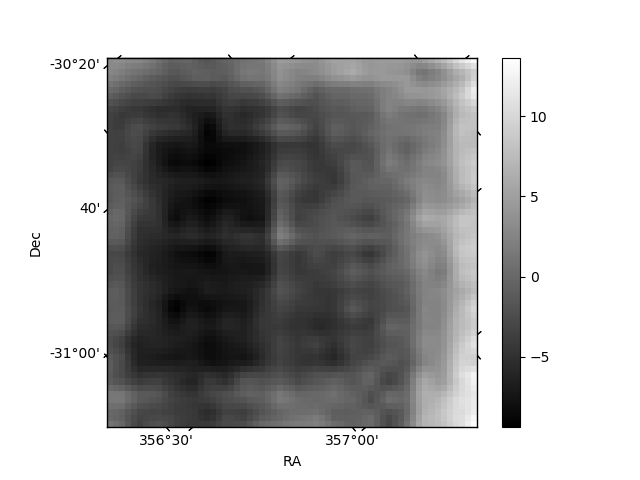
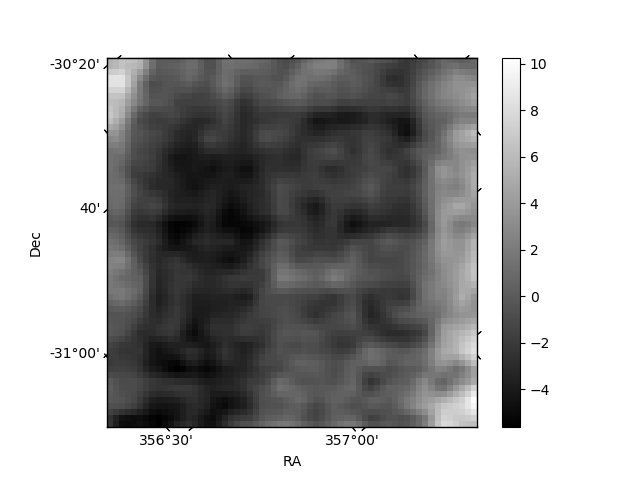
Histogram calculated using DETX and DETY for each event in the final _common_clean file
| Quadrant A | 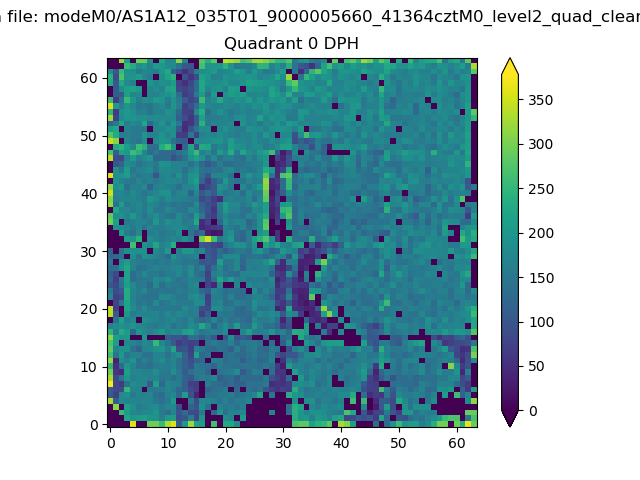 |
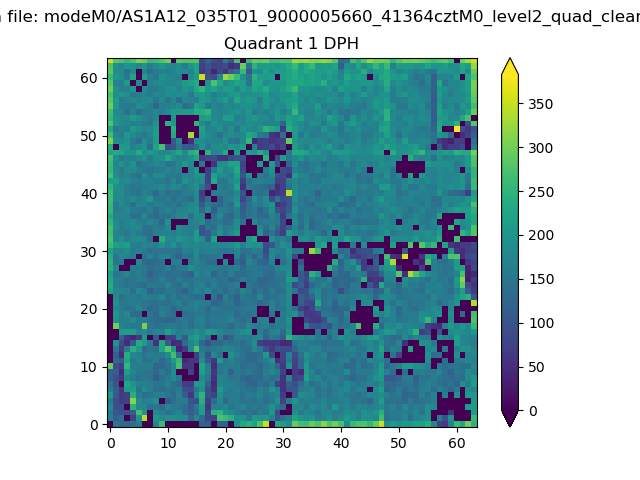 |
Quadrant B |
|---|---|---|---|
| Quadrant D | 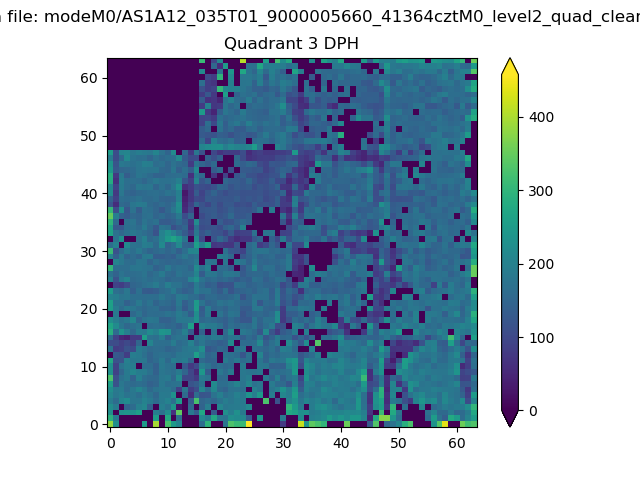 |
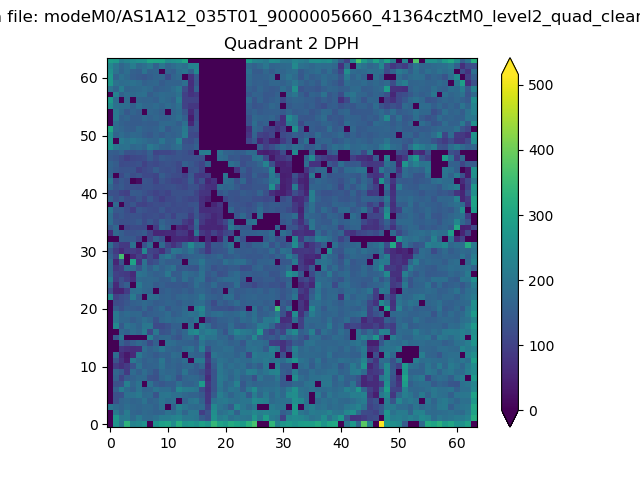 |
Quadrant C |
| Plot type | Count rate plots | Images |
|---|---|---|
| Comparison with Poisson distribution Blue bars denote a histogram of data divided into 1 sec bins. Red curve is a Poisson curve with rate = median count rate of data. |
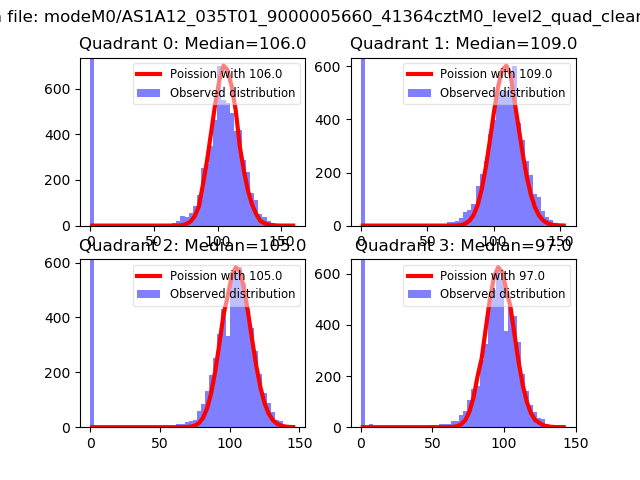 |
 |
| Quadrant-wise count rates Data is divided into 100 sec bins |
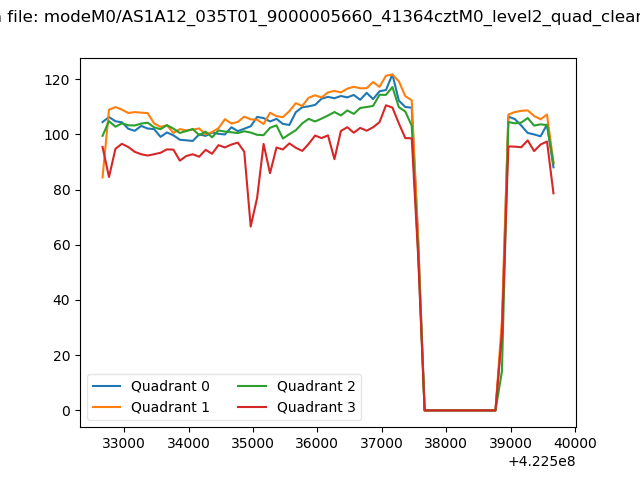 |
|
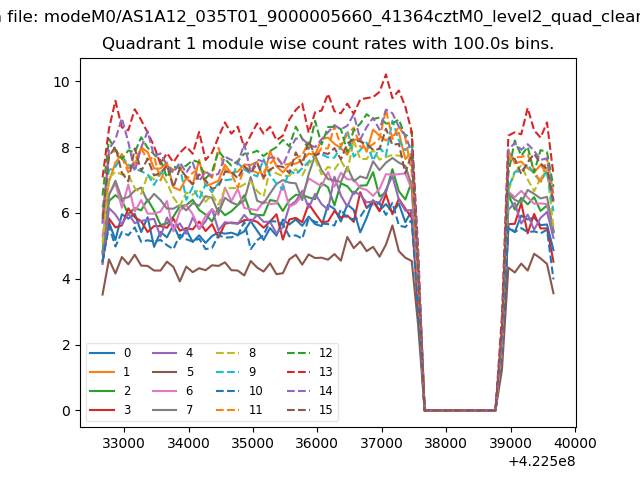
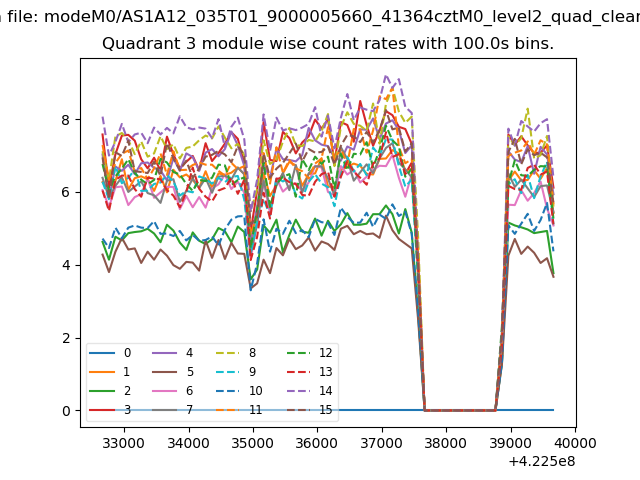
| Module-wise count rates for Quadrant A Data is divided into 100 sec bins |
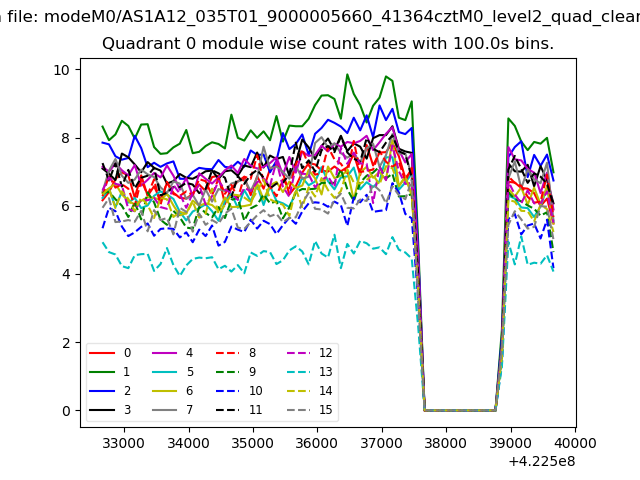 |
 |
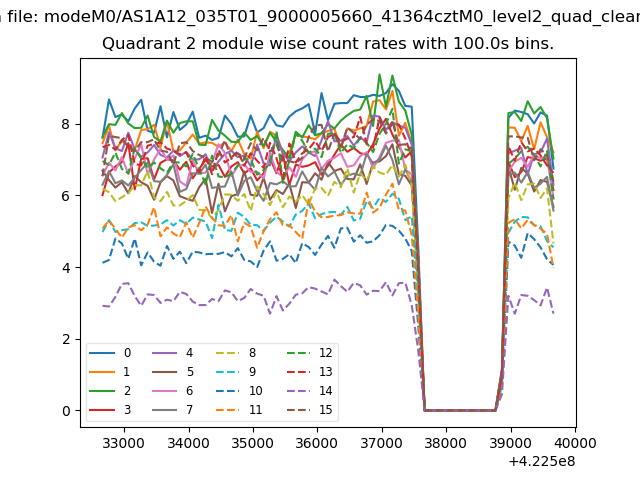
| Module-wise count rates for Quadrant B Data is divided into 100 sec bins |
 |
 |
| Module-wise count rates for Quadrant C Data is divided into 100 sec bins |
 |
 |
| Module-wise count rates for Quadrant D Data is divided into 100 sec bins |
 |
 |
| Parameter | Plot |
|---|---|
| CZT HV Monitor | 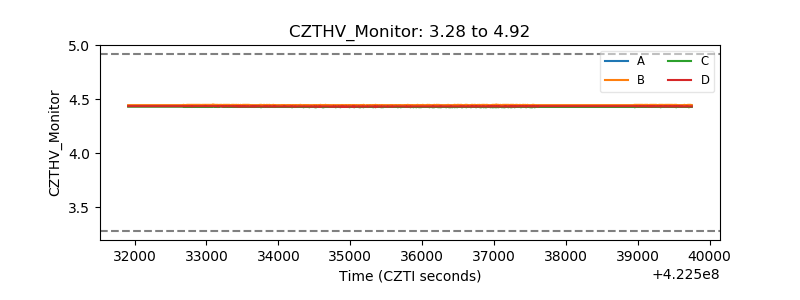 |
| D_VDD | 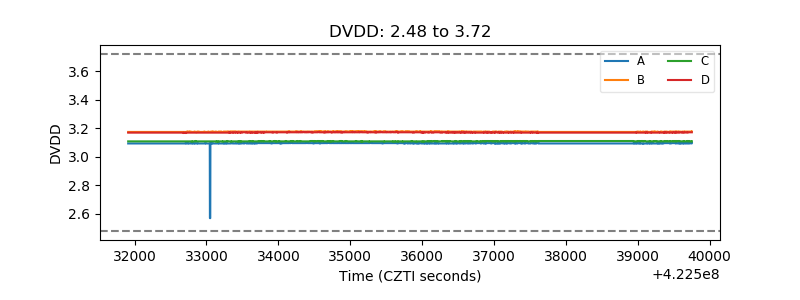 |
| Temperature 1 | 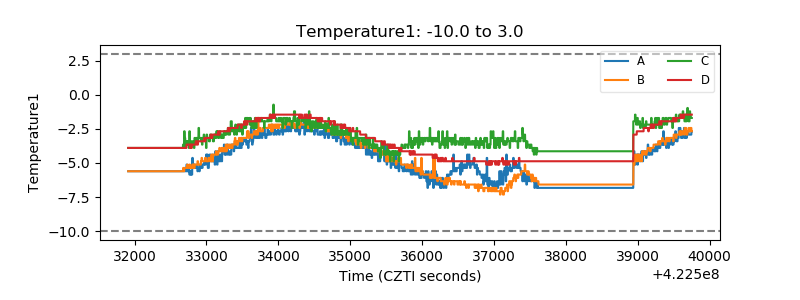 |
| Veto HV Monitor | 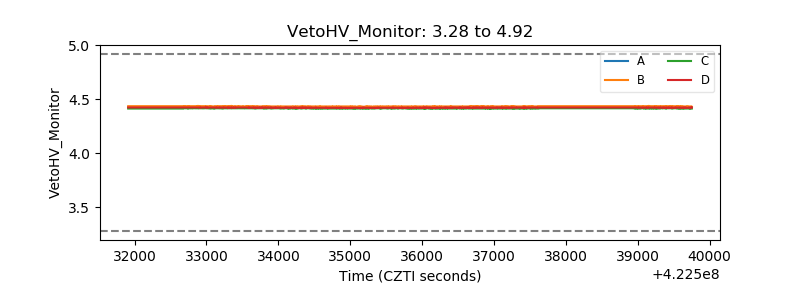 |
| Veto LLD | 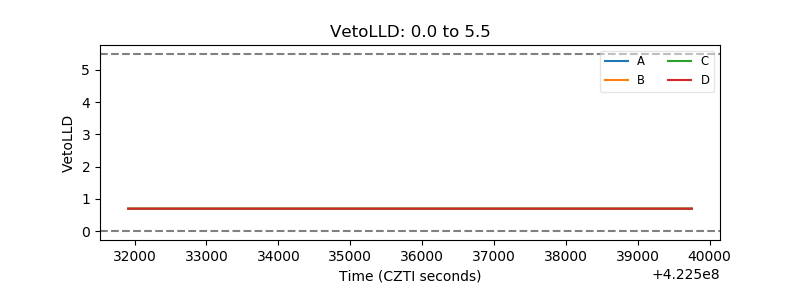 |
| Alpha Counter | 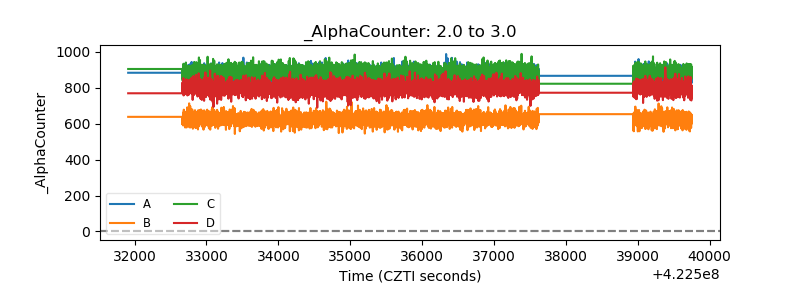 |
| _CPM_Rate | 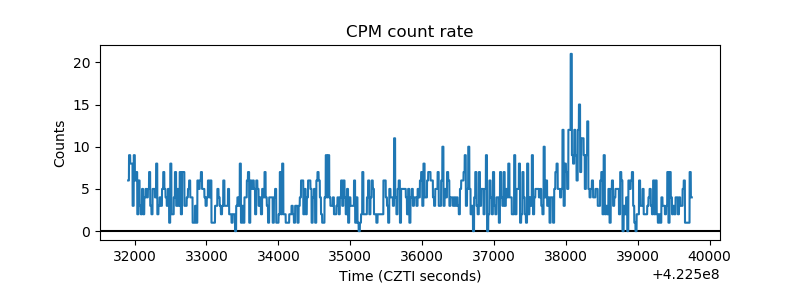 |
| CZT Counter | 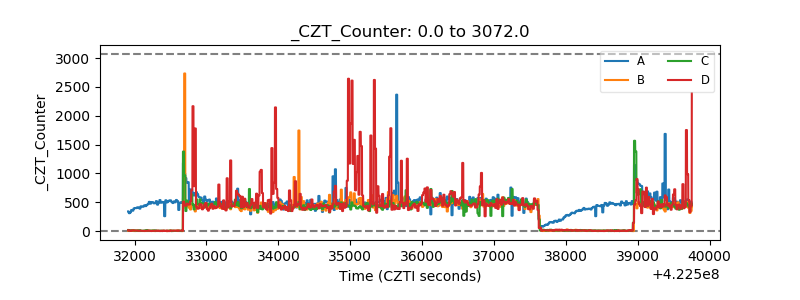 |
| +2.5 Volts monitor | 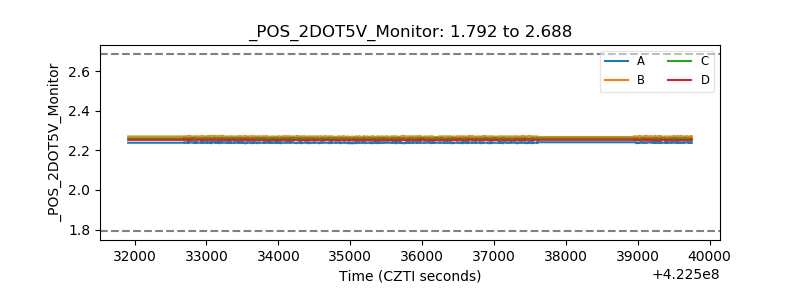 |
| +5 Volts monitor | 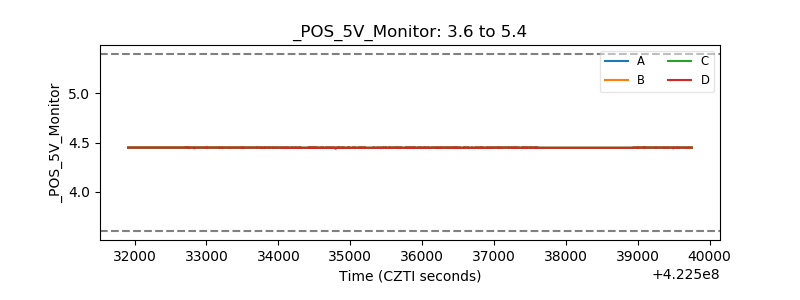 |
| _ROLL_ROT | 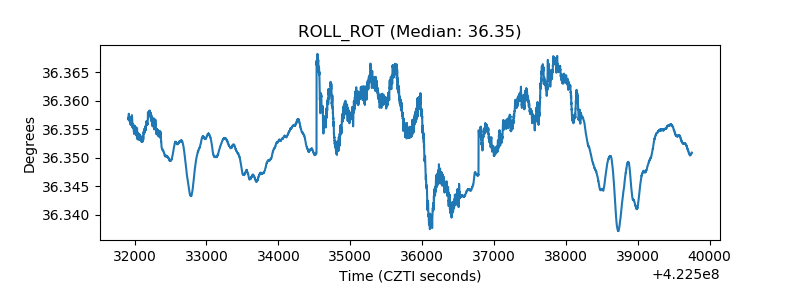 |
| _Roll_DEC | 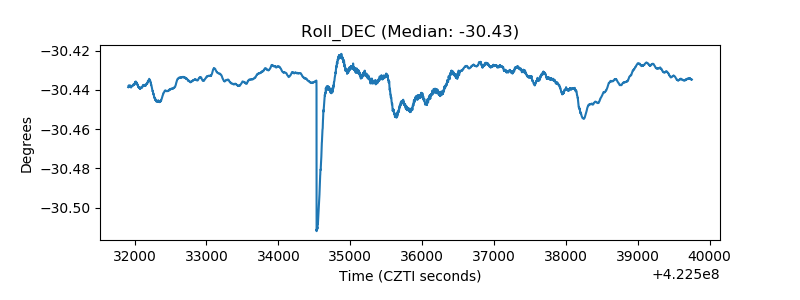 |
| _Roll_RA | 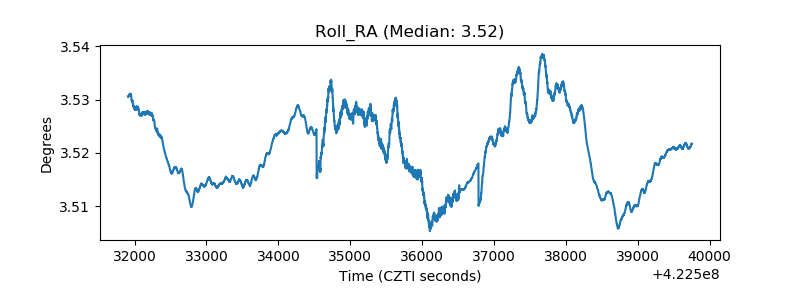 |
| Veto Counter | 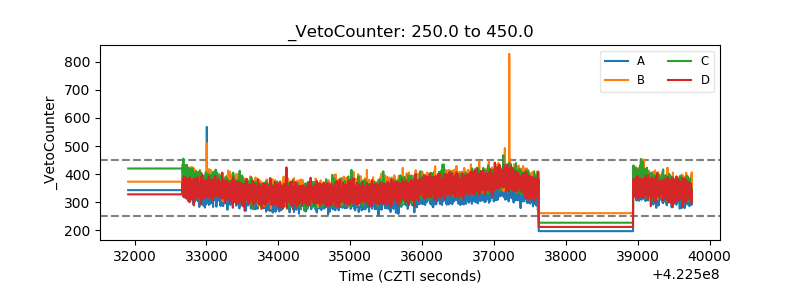 |