| Param | Original file | Final file |
|---|---|---|
| Filename | modeM0/AS1A12_035T01_9000005660_41367cztM0_level2.fits | modeM0/AS1A12_035T01_9000005660_41367cztM0_level2_quad_clean.evt |
| Size (bytes) | 1,014,744,960 | 243,970,560 |
| Size | 967.7 MB | 232.7 MB |
| Events in quadrant A | 8,421,404 | 1,653,619 |
| Events in quadrant B | 7,756,612 | 1,684,540 |
| Events in quadrant C | 8,100,240 | 1,579,285 |
| Events in quadrant D | 12,072,848 | 1,389,936 |
| Mode M0 | |||
|---|---|---|---|
| Quadrant | BADHDUFLAG | Total packets | Discarded packets |
| A | 0 | 34388 | 5 |
| B | 0 | 33615 | 4 |
| C | 0 | 34122 | 4 |
| D | 0 | 46605 | 4 |
| Mode SS | |||
|---|---|---|---|
| Quadrant | BADHDUFLAG | Total packets | Discarded packets |
| A | 0 | 318 | 0 |
| B | 0 | 318 | 0 |
| C | 0 | 318 | 0 |
| D | 0 | 318 | 0 |
| Mode M9 | |||
|---|---|---|---|
| Quadrant | BADHDUFLAG | Total packets | Discarded packets |
| A | 0 | 46 | 0 |
| B | 0 | 46 | 0 |
| C | 0 | 46 | 0 |
| D | 0 | 47 | 0 |
| Quadrant | Total seconds | Saturated seconds | Saturation percentage |
|---|---|---|---|
| A | 15642 | 41 | 0.262115% |
| B | 15642 | 89 | 0.568981% |
| C | 15642 | 320 | 2.045774% |
| D | 15642 | 1259 | 8.048843% |
Noise dominated data is calculated using 1-second bins in cleaned event files. If a bin has >2000 counts, and if more than 50% of those come from <1% of pixels, then it is considered to be noise-dominated and hence unusable.
| Quadrant | # 1 sec bins | Bins with >0 counts | Bins with >2000 counts | High rate bins dominated by noise | Noise dominated (total time) | Noise dominated (detector-on time) | Marked lightcurve |
|---|---|---|---|---|---|---|---|
| A | 19850 | 15645 | 13 | 13 | 0.07% | 0.08% | 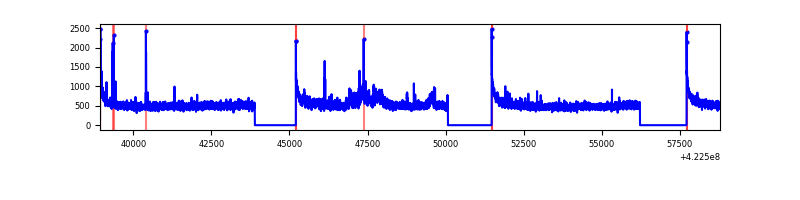 |
| B | 19850 | 15645 | 49 | 49 | 0.25% | 0.31% | 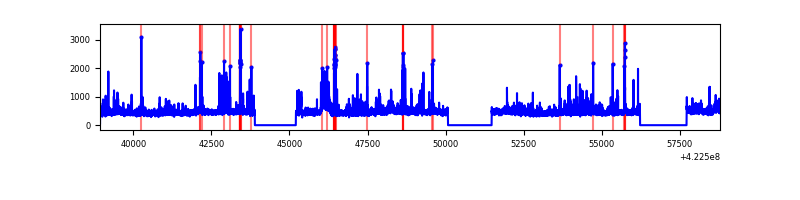 |
| C | 19850 | 15645 | 311 | 311 | 1.57% | 1.99% | 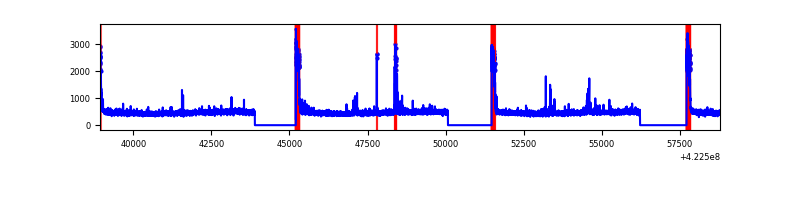 |
| D | 19850 | 15645 | 1164 | 1164 | 5.86% | 7.44% | 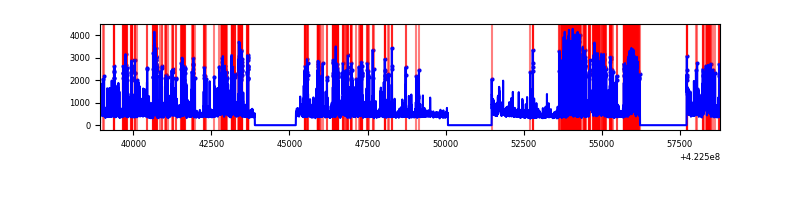 |
Top three noisy pixels from each quadrant. If the there are fewer than three noisy pixels in the level2.evt file, extra rows are filled as -1
| Pixel properties | Quadrant properties | ||||||
|---|---|---|---|---|---|---|---|
| Quadrant | DetID | PixID | Counts | Sigma | Mean | Median | Sigma |
| A | 10 | 83 | 1366582 | 3899.12 | 1708 | 1672 | 350.1 |
| A | 12 | 189 | 380615 | 1082.52 | 1708 | 1672 | 350.1 |
| A | 2 | 79 | 45998 | 126.63 | 1708 | 1672 | 350.1 |
| B | 5 | 255 | 357518 | 1087.51 | 1692 | 1647 | 327.2 |
| B | 0 | 190 | 272445 | 827.53 | 1692 | 1647 | 327.2 |
| B | 0 | 186 | 186581 | 565.14 | 1692 | 1647 | 327.2 |
| C | 0 | 10 | 826783 | 2156.37 | 1646 | 1657 | 382.6 |
| C | 15 | 214 | 655507 | 1708.76 | 1646 | 1657 | 382.6 |
| C | 15 | 111 | 192497 | 498.74 | 1646 | 1657 | 382.6 |
| D | 1 | 52 | 3342175 | 8490.04 | 1608 | 1562 | 393.5 |
| D | 13 | 249 | 934467 | 2370.94 | 1608 | 1562 | 393.5 |
| D | 5 | 222 | 812000 | 2059.69 | 1608 | 1562 | 393.5 |
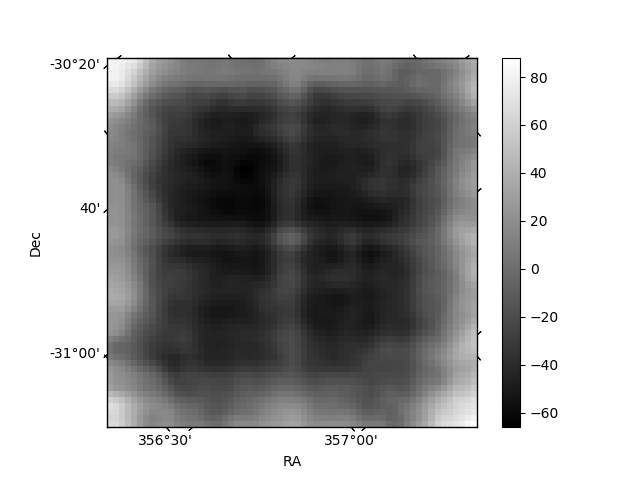
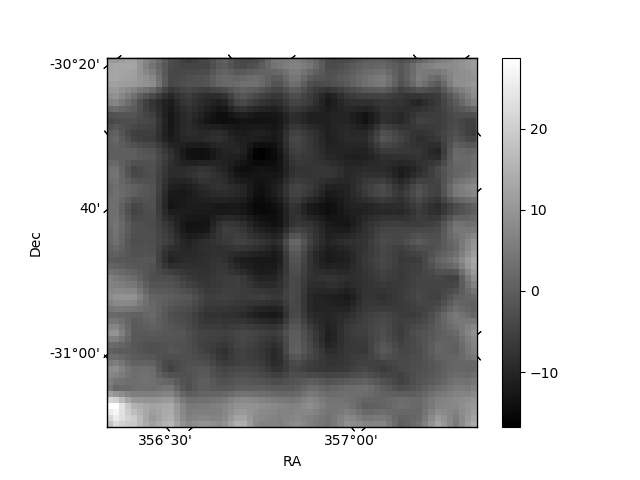
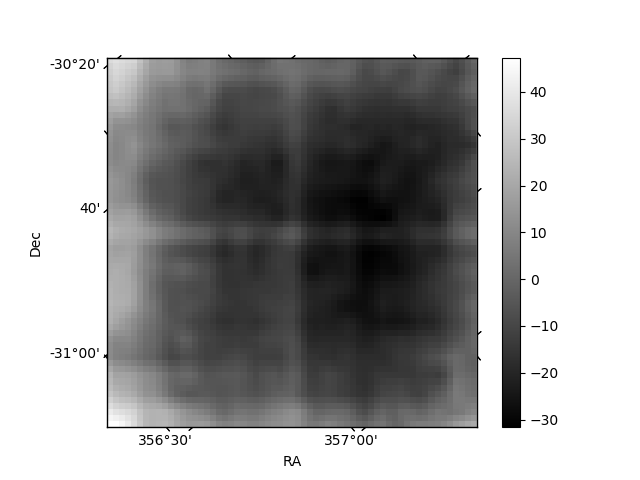
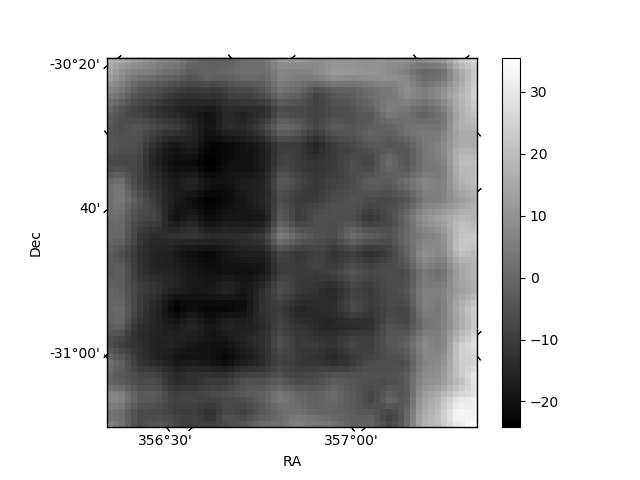
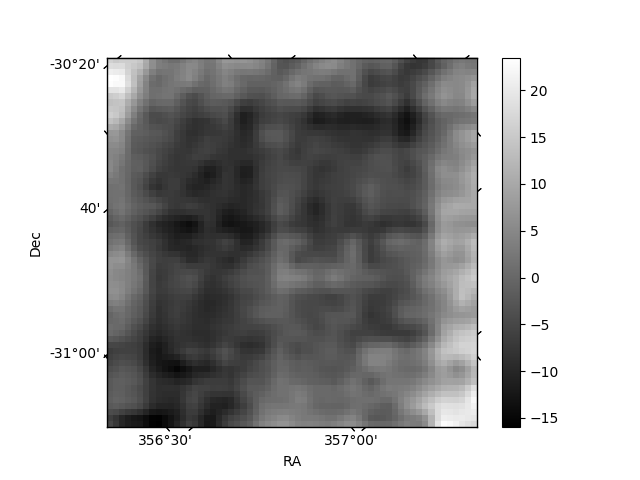
Histogram calculated using DETX and DETY for each event in the final _common_clean file
| Quadrant A | 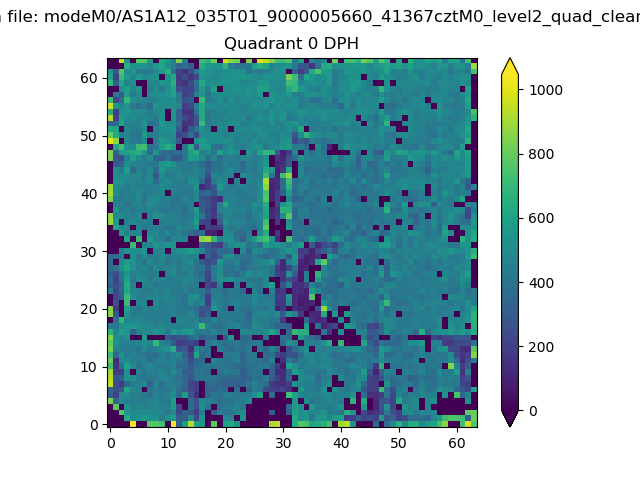 |
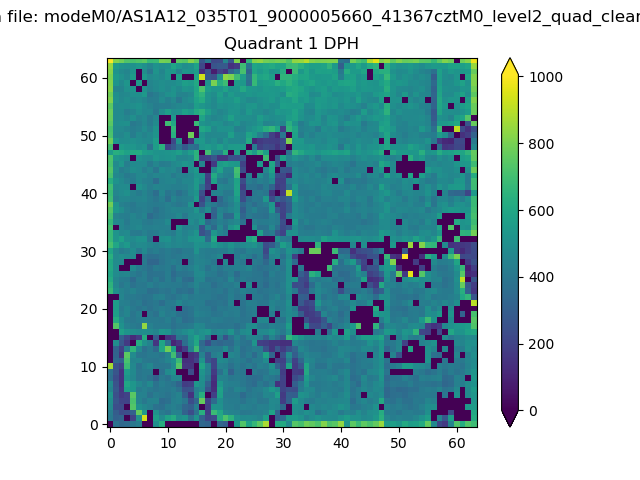 |
Quadrant B |
|---|---|---|---|
| Quadrant D | 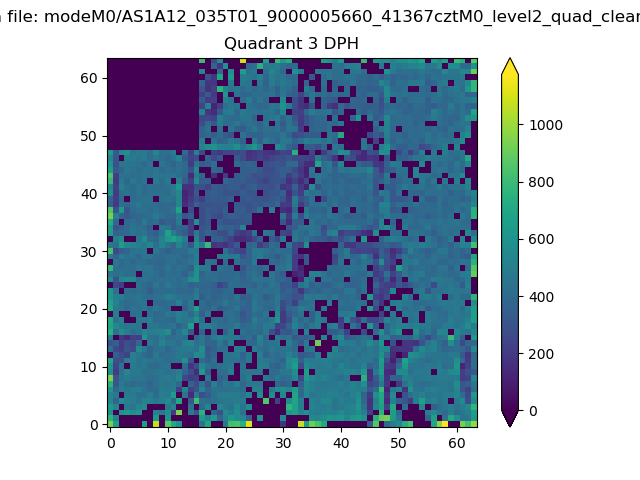 |
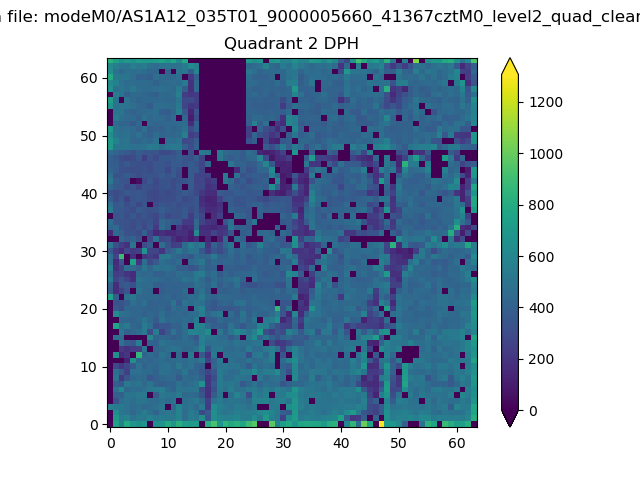 |
Quadrant C |
| Plot type | Count rate plots | Images |
|---|---|---|
| Comparison with Poisson distribution Blue bars denote a histogram of data divided into 1 sec bins. Red curve is a Poisson curve with rate = median count rate of data. |
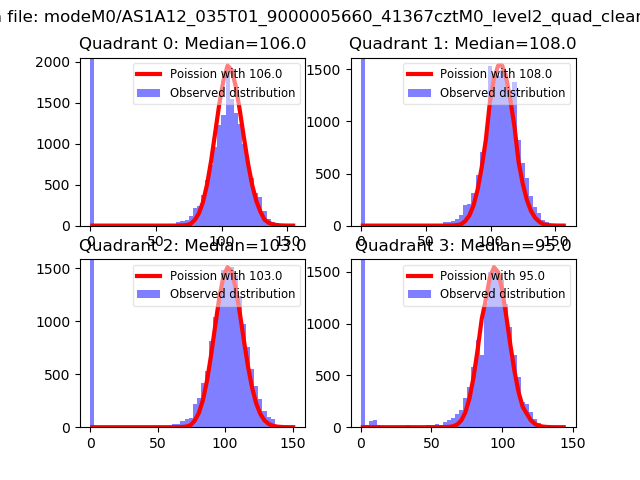 |
 |
| Quadrant-wise count rates Data is divided into 100 sec bins |
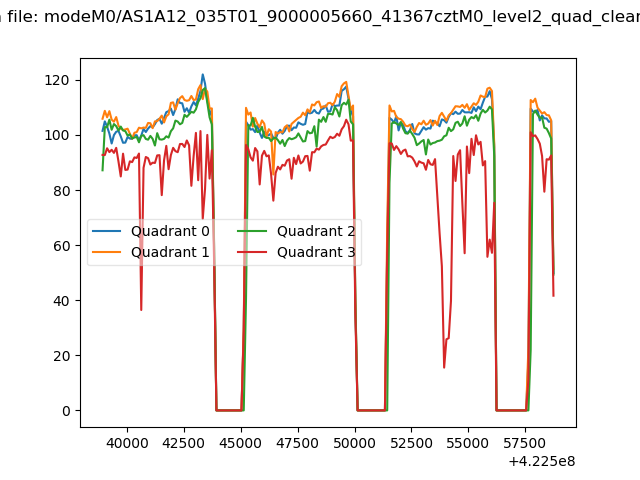 |
|
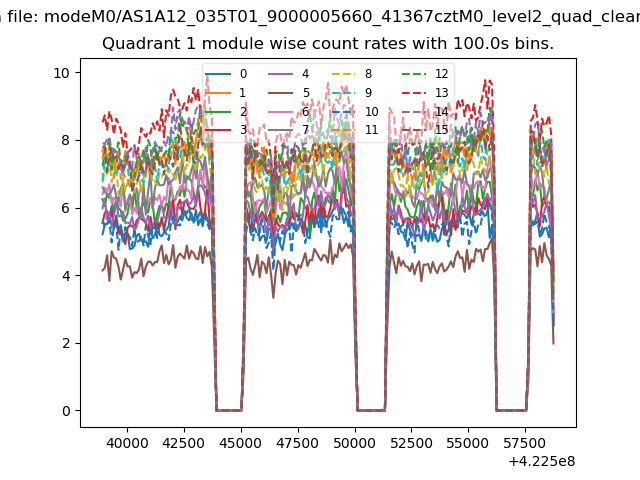
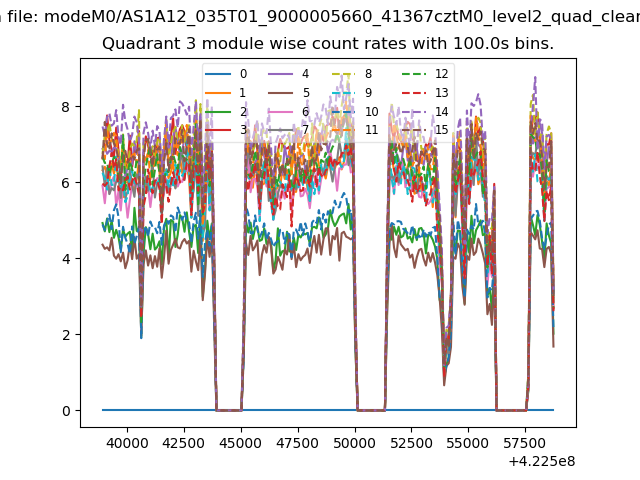
| Module-wise count rates for Quadrant A Data is divided into 100 sec bins |
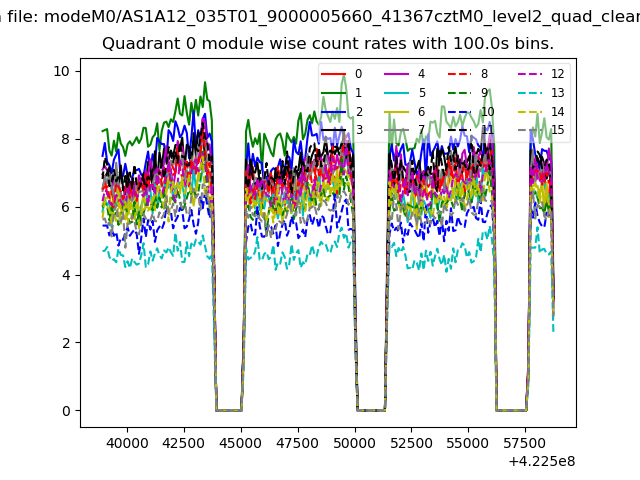 |
 |
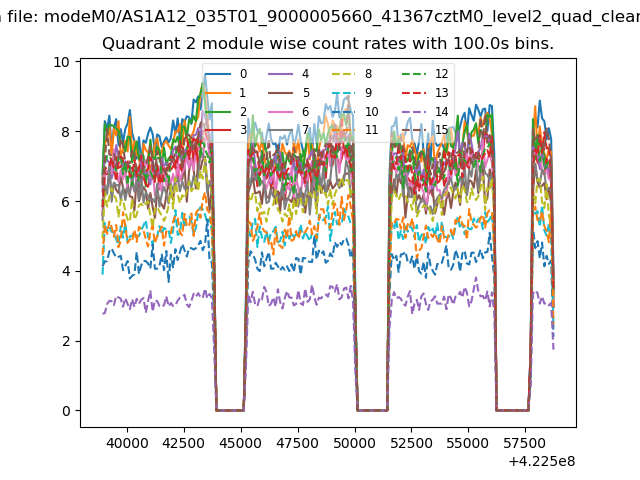
| Module-wise count rates for Quadrant B Data is divided into 100 sec bins |
 |
 |
| Module-wise count rates for Quadrant C Data is divided into 100 sec bins |
 |
 |
| Module-wise count rates for Quadrant D Data is divided into 100 sec bins |
 |
 |
| Parameter | Plot |
|---|---|
| CZT HV Monitor | 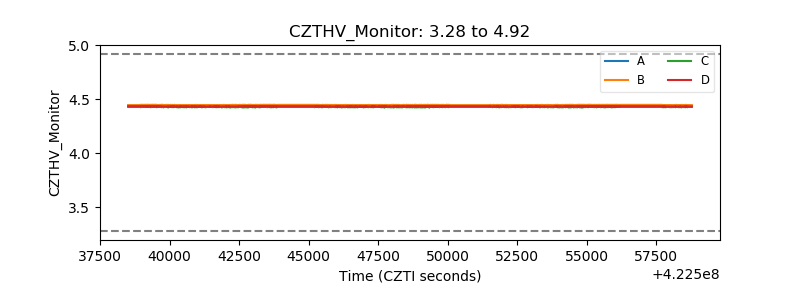 |
| D_VDD | 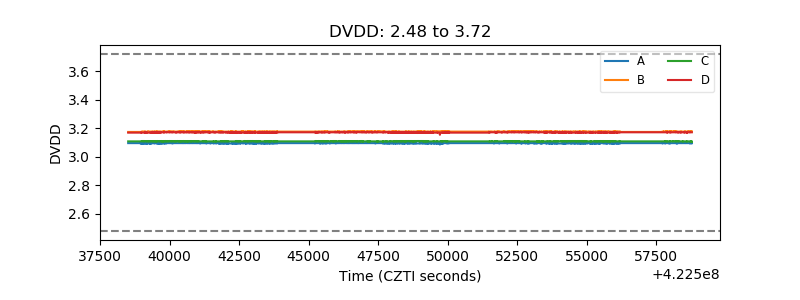 |
| Temperature 1 | 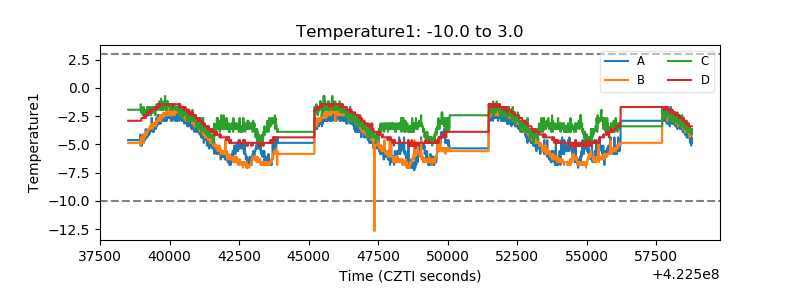 |
| Veto HV Monitor | 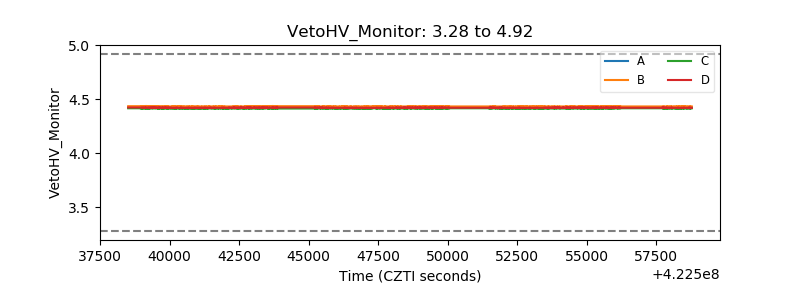 |
| Veto LLD | 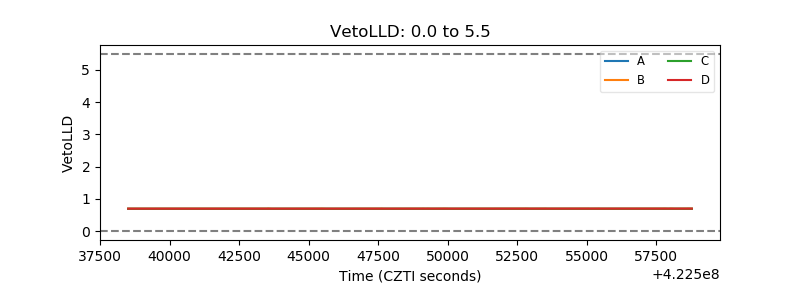 |
| Alpha Counter | 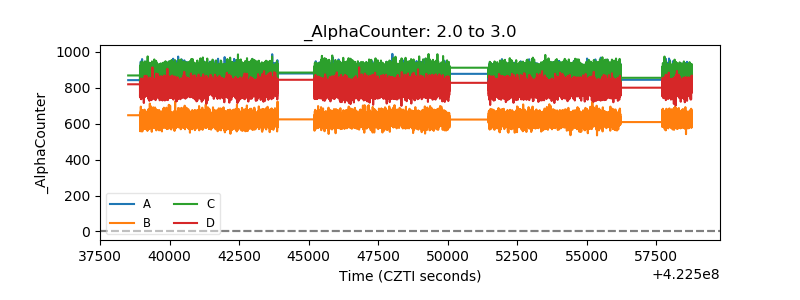 |
| _CPM_Rate | 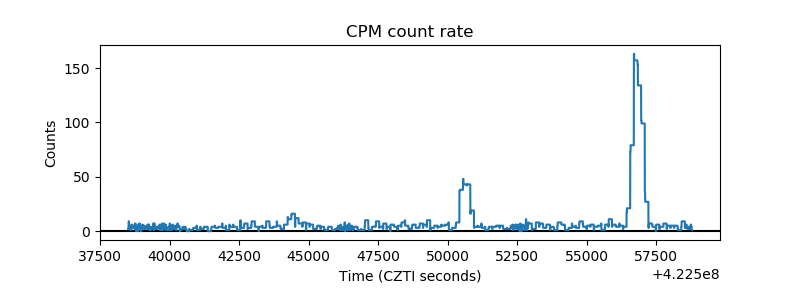 |
| CZT Counter | 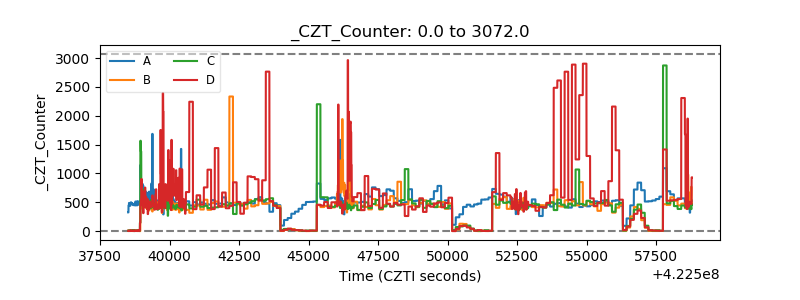 |
| +2.5 Volts monitor | 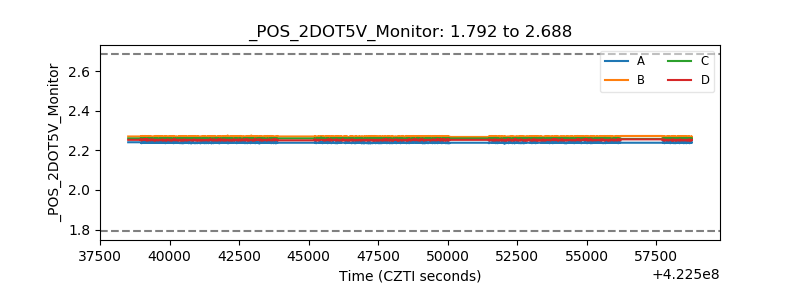 |
| +5 Volts monitor |  |
| _ROLL_ROT | 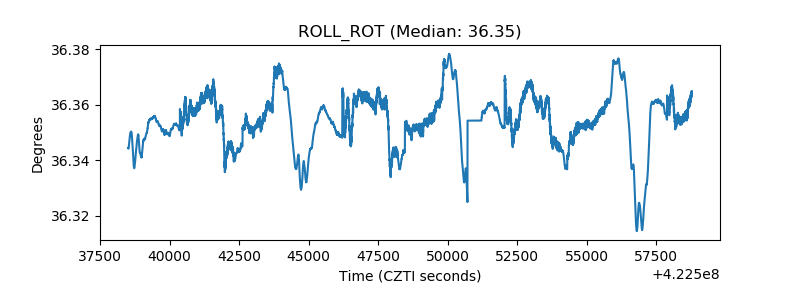 |
| _Roll_DEC | 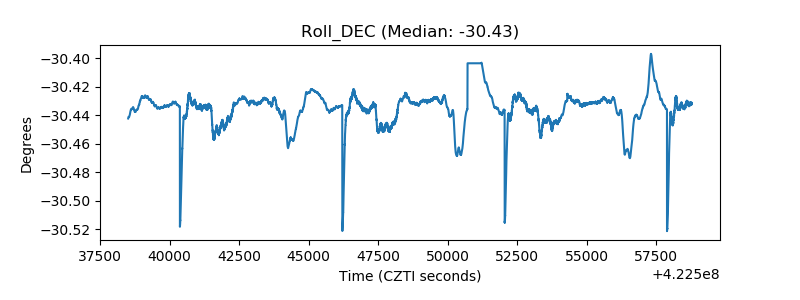 |
| _Roll_RA | 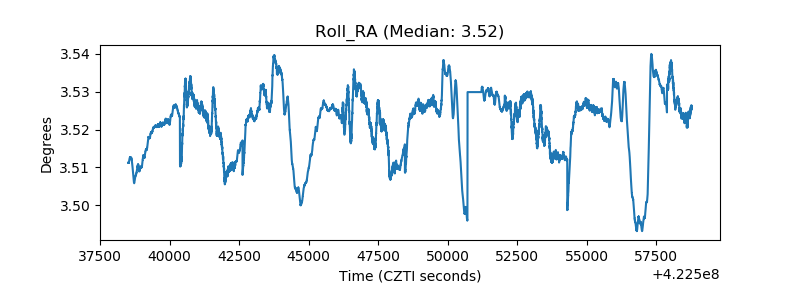 |
| Veto Counter | 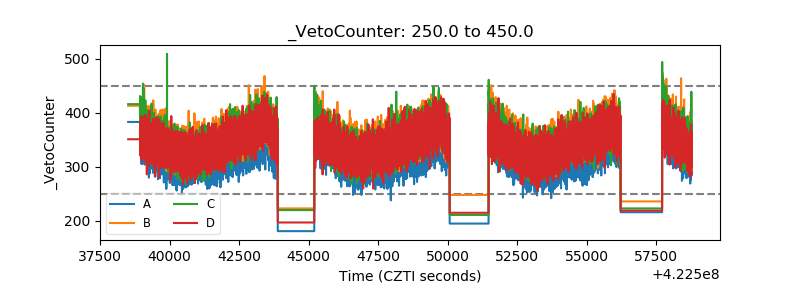 |