| Param | Original file | Final file |
|---|---|---|
| Filename | modeM0/AS1A12_035T01_9000005660_41368cztM0_level2.fits | modeM0/AS1A12_035T01_9000005660_41368cztM0_level2_quad_clean.evt |
| Size (bytes) | 403,830,720 | 86,647,680 |
| Size | 385.1 MB | 82.6 MB |
| Events in quadrant A | 2,901,326 | 601,120 |
| Events in quadrant B | 2,745,974 | 604,467 |
| Events in quadrant C | 3,015,382 | 554,779 |
| Events in quadrant D | 5,858,563 | 478,797 |
| Mode M0 | |||
|---|---|---|---|
| Quadrant | BADHDUFLAG | Total packets | Discarded packets |
| A | 0 | 11965 | 3 |
| B | 0 | 11909 | 2 |
| C | 0 | 12498 | 2 |
| D | 0 | 21212 | 2 |
| Mode SS | |||
|---|---|---|---|
| Quadrant | BADHDUFLAG | Total packets | Discarded packets |
| A | 0 | 112 | 0 |
| B | 0 | 112 | 0 |
| C | 0 | 112 | 0 |
| D | 0 | 112 | 0 |
| Mode M9 | |||
|---|---|---|---|
| Quadrant | BADHDUFLAG | Total packets | Discarded packets |
| A | 0 | 18 | 0 |
| B | 0 | 18 | 0 |
| C | 0 | 18 | 0 |
| D | 0 | 19 | 0 |
| Quadrant | Total seconds | Saturated seconds | Saturation percentage |
|---|---|---|---|
| A | 5491 | 15 | 0.273174% |
| B | 5491 | 63 | 1.147332% |
| C | 5491 | 214 | 3.897286% |
| D | 5491 | 813 | 14.806046% |
Noise dominated data is calculated using 1-second bins in cleaned event files. If a bin has >2000 counts, and if more than 50% of those come from <1% of pixels, then it is considered to be noise-dominated and hence unusable.
| Quadrant | # 1 sec bins | Bins with >0 counts | Bins with >2000 counts | High rate bins dominated by noise | Noise dominated (total time) | Noise dominated (detector-on time) | Marked lightcurve |
|---|---|---|---|---|---|---|---|
| A | 7104 | 5492 | 3 | 3 | 0.04% | 0.05% | 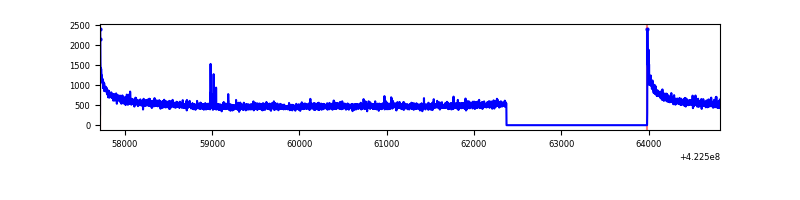 |
| B | 7104 | 5492 | 26 | 26 | 0.37% | 0.47% | 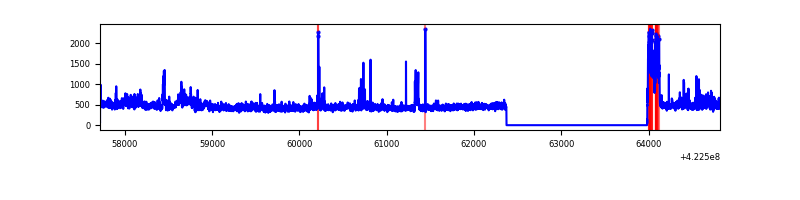 |
| C | 7104 | 5492 | 207 | 207 | 2.91% | 3.77% | 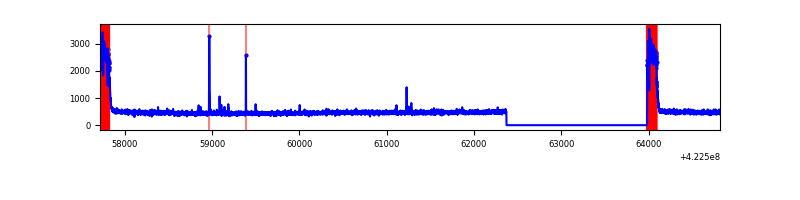 |
| D | 7104 | 5492 | 870 | 870 | 12.25% | 15.84% | 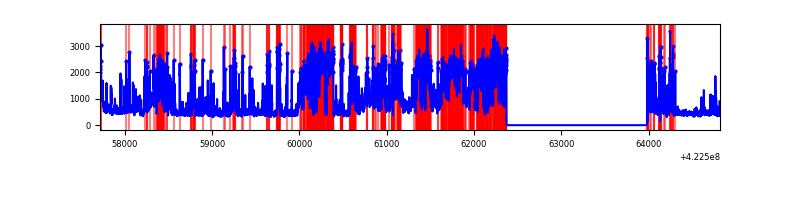 |
Top three noisy pixels from each quadrant. If the there are fewer than three noisy pixels in the level2.evt file, extra rows are filled as -1
| Pixel properties | Quadrant properties | ||||||
|---|---|---|---|---|---|---|---|
| Quadrant | DetID | PixID | Counts | Sigma | Mean | Median | Sigma |
| A | 10 | 83 | 535061 | 4292.87 | 602 | 589 | 124.5 |
| A | 12 | 189 | 24490 | 191.97 | 602 | 589 | 124.5 |
| A | 13 | 248 | 9312 | 70.06 | 602 | 589 | 124.5 |
| B | 0 | 186 | 143170 | 1217.82 | 596 | 579 | 117.1 |
| B | 0 | 190 | 87602 | 743.23 | 596 | 579 | 117.1 |
| B | 0 | 229 | 78460 | 665.16 | 596 | 579 | 117.1 |
| C | 0 | 10 | 543992 | 4061.5 | 569 | 571 | 133.8 |
| C | 15 | 214 | 229522 | 1711.17 | 569 | 571 | 133.8 |
| C | 15 | 111 | 17472 | 126.32 | 569 | 571 | 133.8 |
| D | 1 | 52 | 2980469 | 21709.78 | 560 | 541 | 137.3 |
| D | 5 | 222 | 416738 | 3032.14 | 560 | 541 | 137.3 |
| D | 13 | 249 | 154453 | 1121.3 | 560 | 541 | 137.3 |
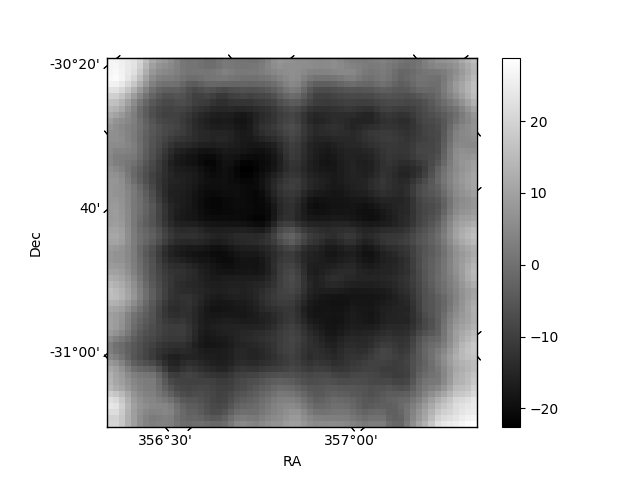
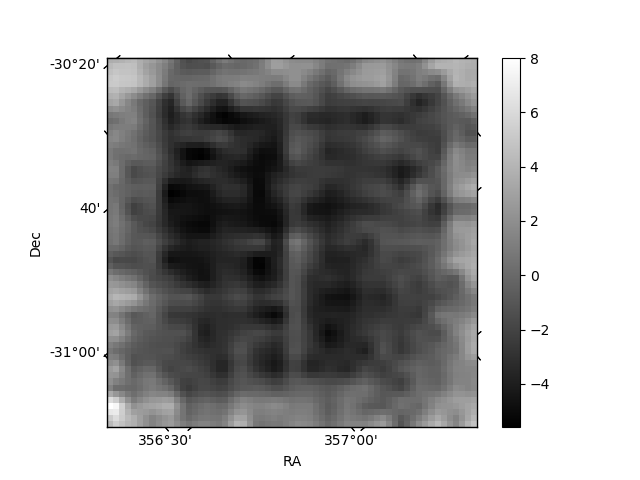
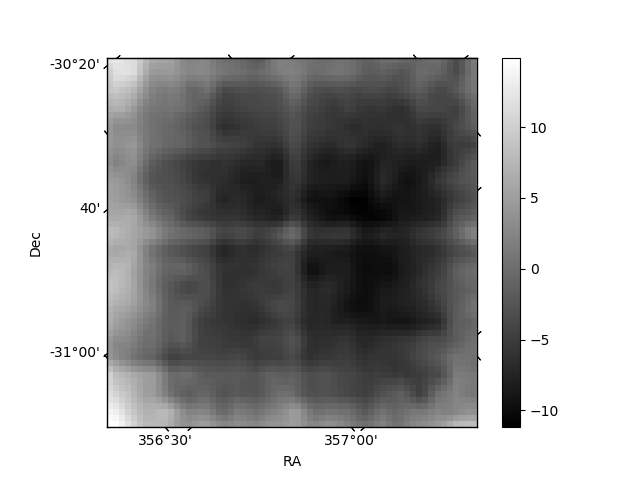
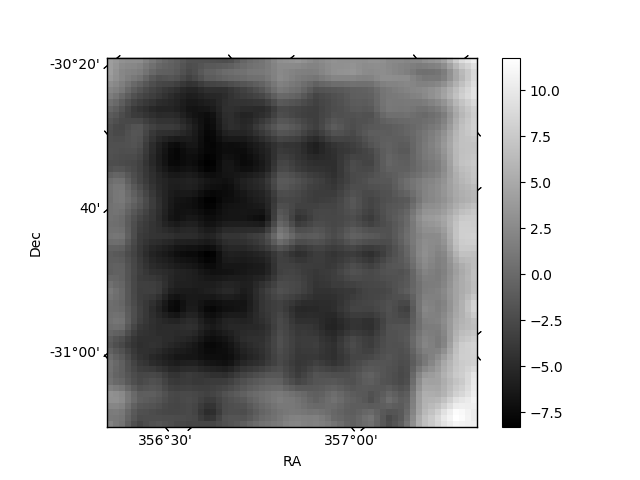
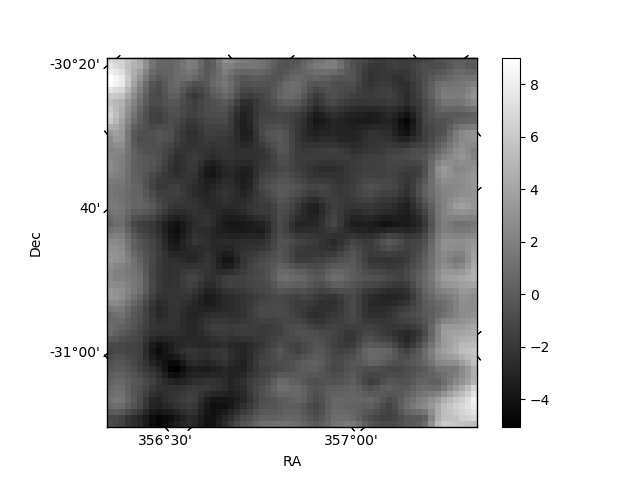
Histogram calculated using DETX and DETY for each event in the final _common_clean file
| Quadrant A | 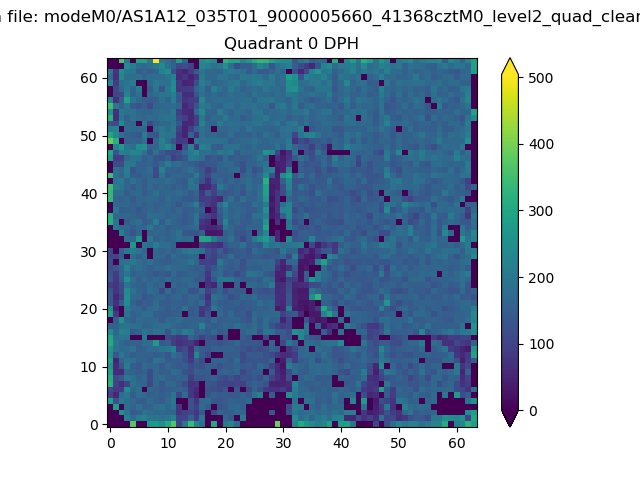 |
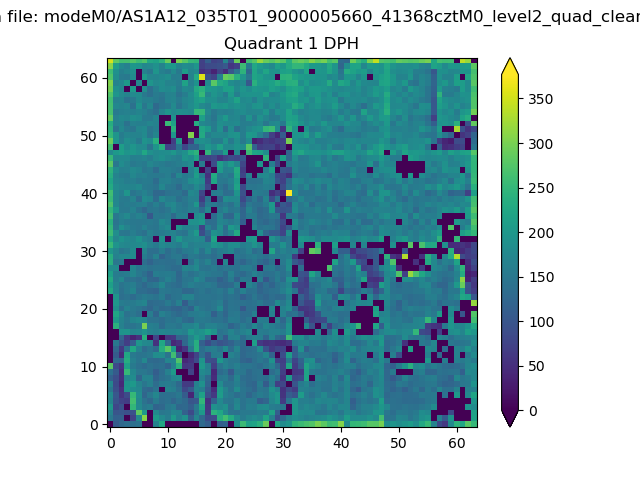 |
Quadrant B |
|---|---|---|---|
| Quadrant D | 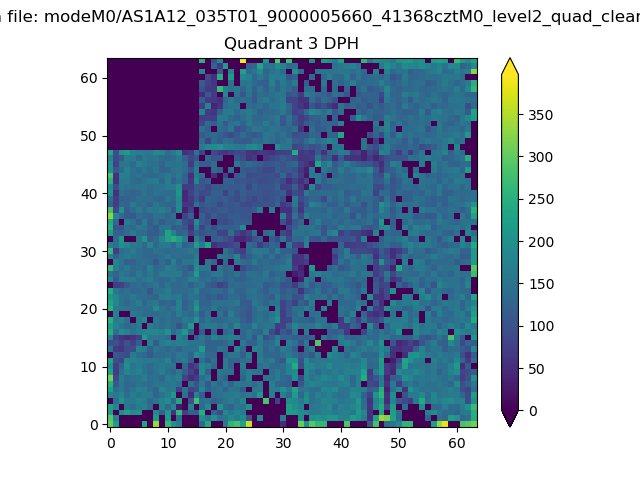 |
 |
Quadrant C |
| Plot type | Count rate plots | Images |
|---|---|---|
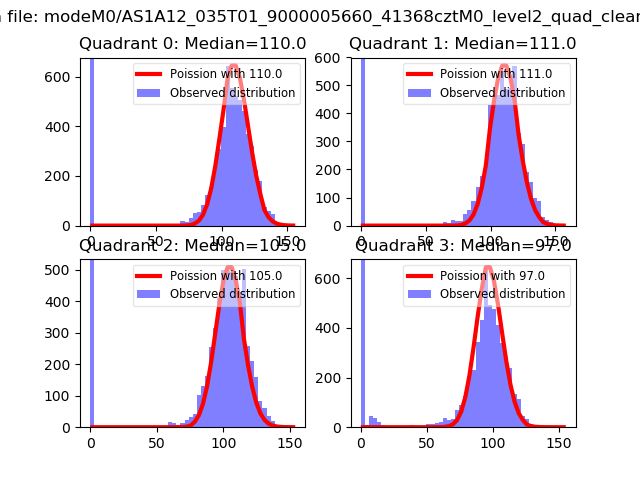
| Comparison with Poisson distribution Blue bars denote a histogram of data divided into 1 sec bins. Red curve is a Poisson curve with rate = median count rate of data. |
 |
 |
| Quadrant-wise count rates Data is divided into 100 sec bins |
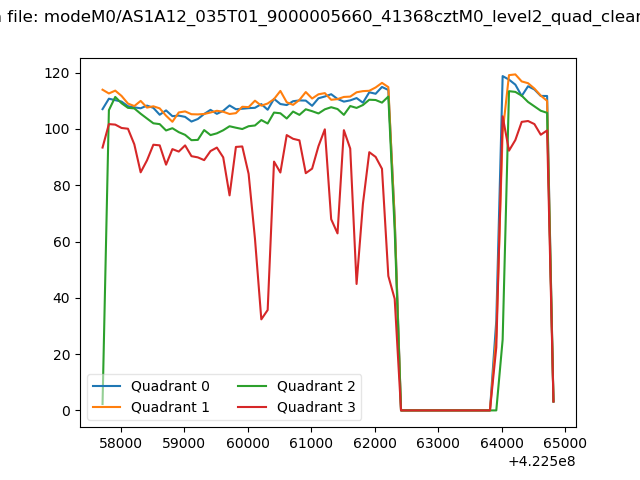 |
|
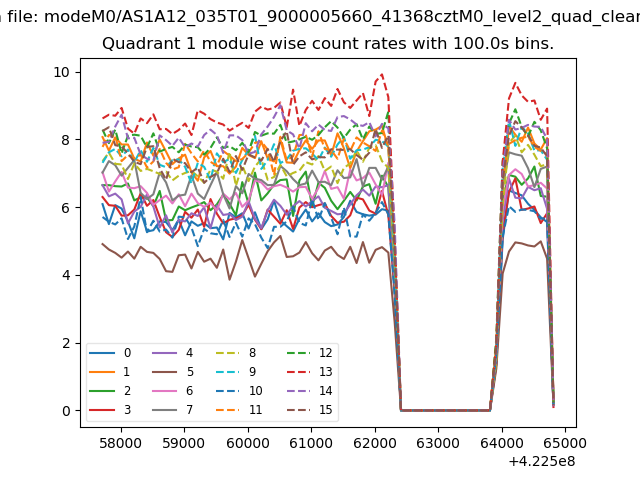
| Module-wise count rates for Quadrant A Data is divided into 100 sec bins |
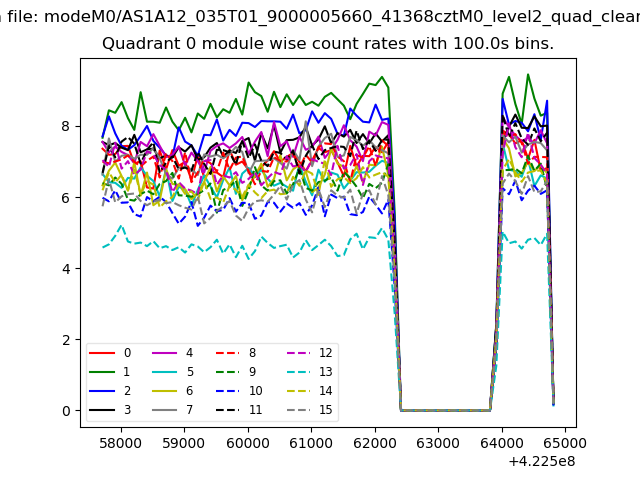 |
 |
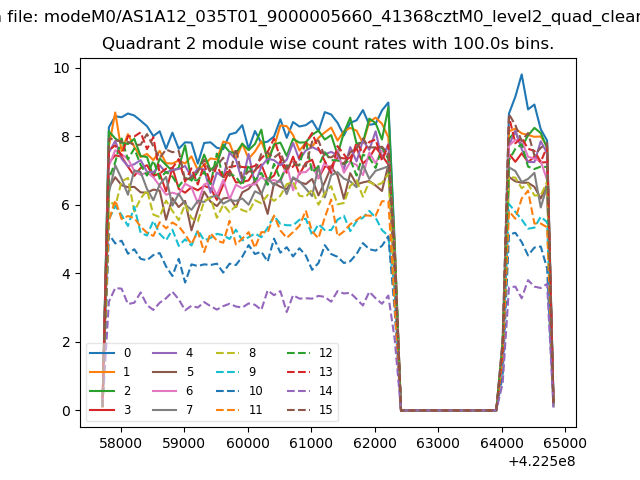
| Module-wise count rates for Quadrant B Data is divided into 100 sec bins |
 |
 |
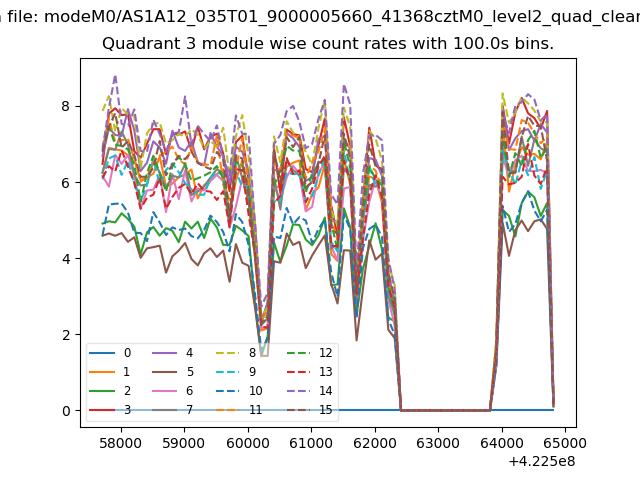
| Module-wise count rates for Quadrant C Data is divided into 100 sec bins |
 |
 |
| Module-wise count rates for Quadrant D Data is divided into 100 sec bins |
 |
 |
| Parameter | Plot |
|---|---|
| CZT HV Monitor |  |
| D_VDD |  |
| Temperature 1 | 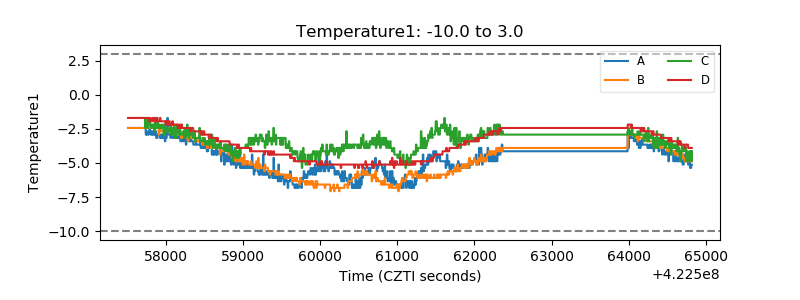 |
| Veto HV Monitor | 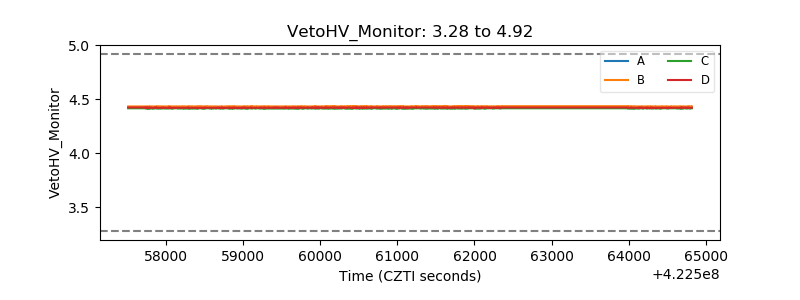 |
| Veto LLD | 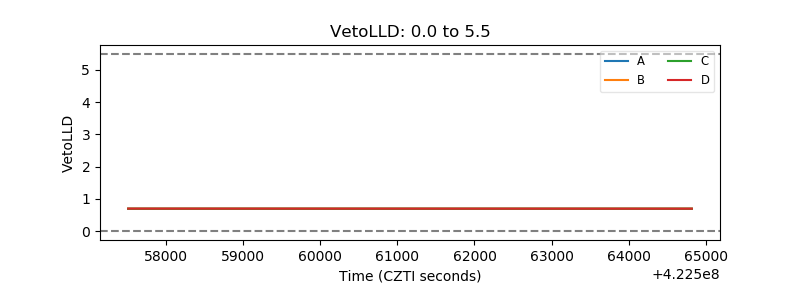 |
| Alpha Counter | 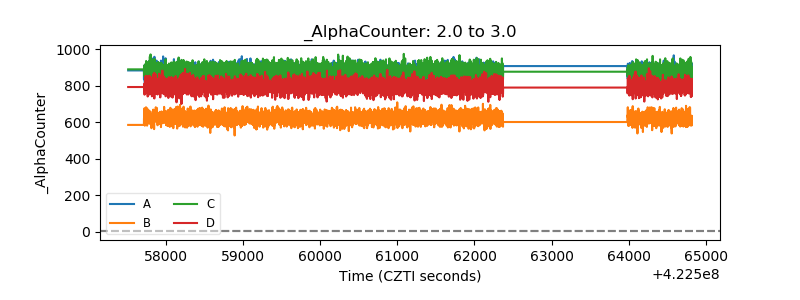 |
| _CPM_Rate |  |
| CZT Counter |  |
| +2.5 Volts monitor |  |
| +5 Volts monitor | 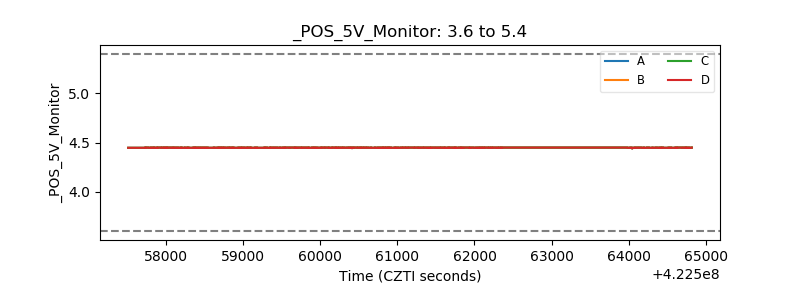 |
| _ROLL_ROT | 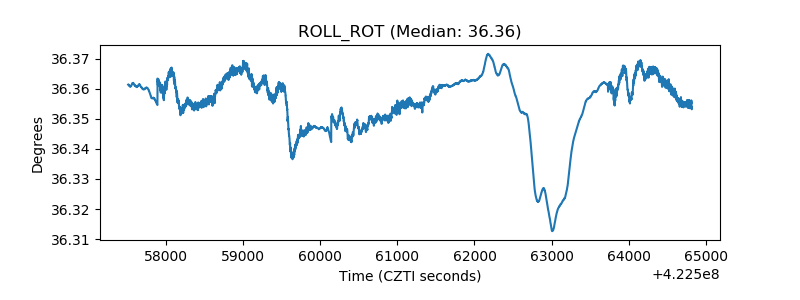 |
| _Roll_DEC | 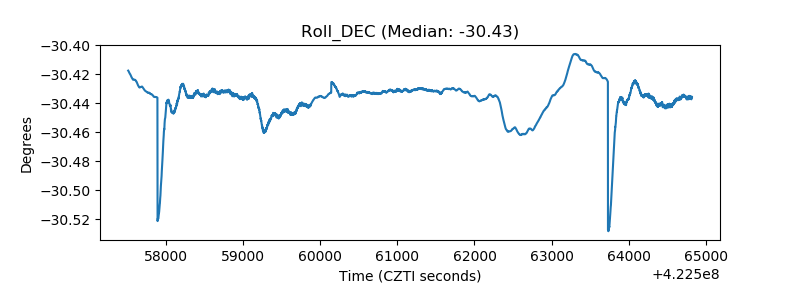 |
| _Roll_RA | 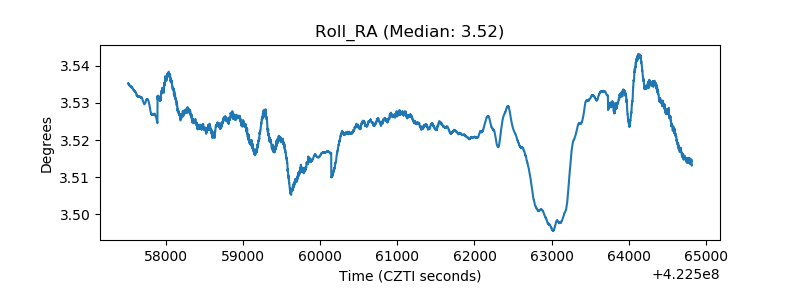 |
| Veto Counter | 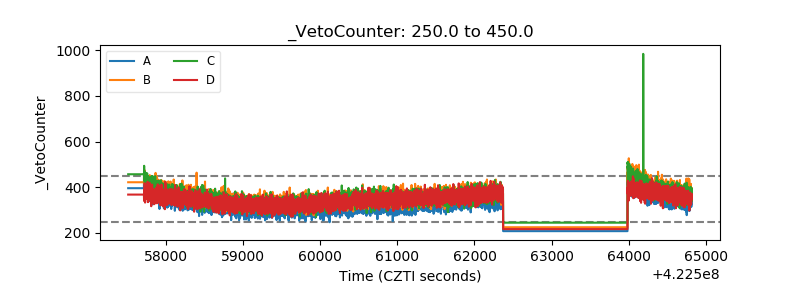 |