| Param | Original file | Final file |
|---|---|---|
| Filename | modeM0/AS1A12_035T01_9000005660_41370cztM0_level2.fits | modeM0/AS1A12_035T01_9000005660_41370cztM0_level2_quad_clean.evt |
| Size (bytes) | 353,485,440 | 93,496,320 |
| Size | 337.1 MB | 89.2 MB |
| Events in quadrant A | 3,007,644 | 641,165 |
| Events in quadrant B | 2,812,682 | 647,654 |
| Events in quadrant C | 3,180,026 | 588,448 |
| Events in quadrant D | 3,641,954 | 556,631 |
| Mode M0 | |||
|---|---|---|---|
| Quadrant | BADHDUFLAG | Total packets | Discarded packets |
| A | 0 | 12393 | 3 |
| B | 0 | 12271 | 2 |
| C | 0 | 13005 | 2 |
| D | 0 | 14790 | 2 |
| Mode SS | |||
|---|---|---|---|
| Quadrant | BADHDUFLAG | Total packets | Discarded packets |
| A | 0 | 116 | 0 |
| B | 0 | 116 | 0 |
| C | 0 | 116 | 0 |
| D | 0 | 116 | 0 |
| Mode M9 | |||
|---|---|---|---|
| Quadrant | BADHDUFLAG | Total packets | Discarded packets |
| A | 0 | 34 | 0 |
| B | 0 | 34 | 0 |
| C | 0 | 34 | 0 |
| D | 0 | 34 | 0 |
| Quadrant | Total seconds | Saturated seconds | Saturation percentage |
|---|---|---|---|
| A | 5683 | 15 | 0.263945% |
| B | 5683 | 59 | 1.038184% |
| C | 5683 | 232 | 4.082351% |
| D | 5683 | 232 | 4.082351% |
Noise dominated data is calculated using 1-second bins in cleaned event files. If a bin has >2000 counts, and if more than 50% of those come from <1% of pixels, then it is considered to be noise-dominated and hence unusable.
| Quadrant | # 1 sec bins | Bins with >0 counts | Bins with >2000 counts | High rate bins dominated by noise | Noise dominated (total time) | Noise dominated (detector-on time) | Marked lightcurve |
|---|---|---|---|---|---|---|---|
| A | 9058 | 5685 | 3 | 3 | 0.03% | 0.05% | 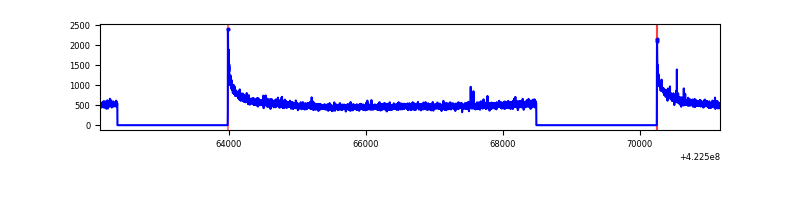 |
| B | 9058 | 5685 | 23 | 23 | 0.25% | 0.40% | 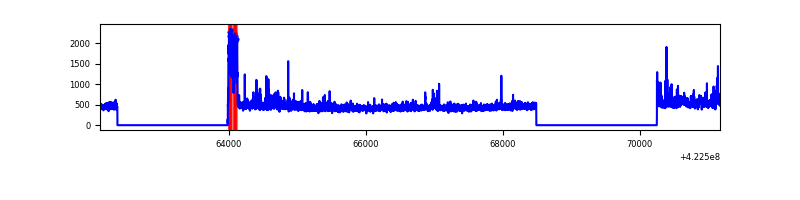 |
| C | 9058 | 5685 | 224 | 224 | 2.47% | 3.94% | 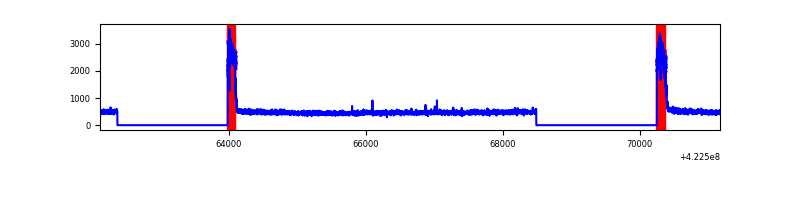 |
| D | 9058 | 5685 | 208 | 208 | 2.30% | 3.66% | 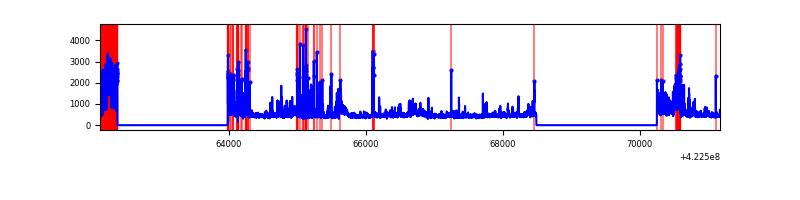 |
Top three noisy pixels from each quadrant. If the there are fewer than three noisy pixels in the level2.evt file, extra rows are filled as -1
| Pixel properties | Quadrant properties | ||||||
|---|---|---|---|---|---|---|---|
| Quadrant | DetID | PixID | Counts | Sigma | Mean | Median | Sigma |
| A | 10 | 83 | 537625 | 4129.38 | 632 | 619 | 130.0 |
| A | 12 | 189 | 15976 | 118.09 | 632 | 619 | 130.0 |
| A | 3 | 137 | 7175 | 50.41 | 632 | 619 | 130.0 |
| B | 0 | 186 | 143165 | 1168.4 | 627 | 608 | 122.0 |
| B | 0 | 190 | 93353 | 760.14 | 627 | 608 | 122.0 |
| B | 0 | 229 | 63562 | 515.97 | 627 | 608 | 122.0 |
| C | 0 | 10 | 605592 | 4330.21 | 599 | 602 | 139.7 |
| C | 15 | 214 | 235661 | 1682.43 | 599 | 602 | 139.7 |
| C | 13 | 61 | 3866 | 23.36 | 599 | 602 | 139.7 |
| D | 1 | 52 | 778655 | 5257.32 | 606 | 588 | 148.0 |
| D | 5 | 222 | 258842 | 1745.0 | 606 | 588 | 148.0 |
| D | 13 | 249 | 116296 | 781.83 | 606 | 588 | 148.0 |
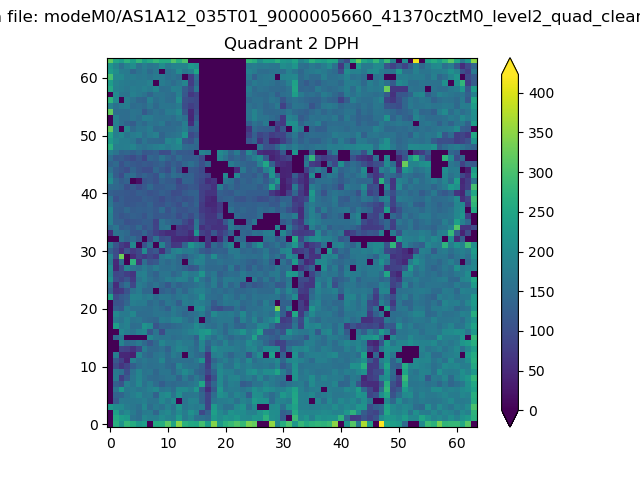
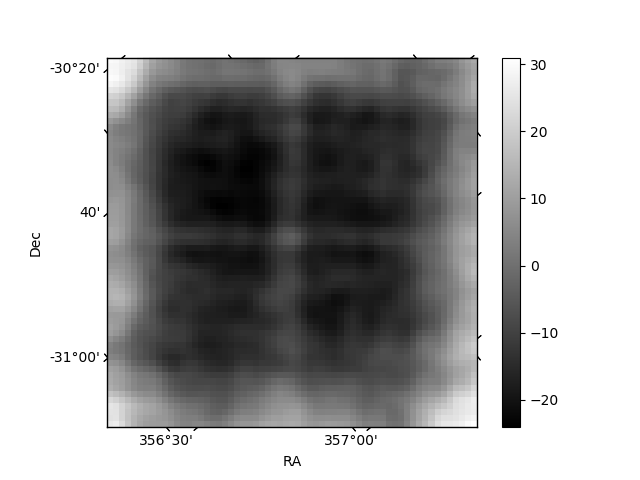
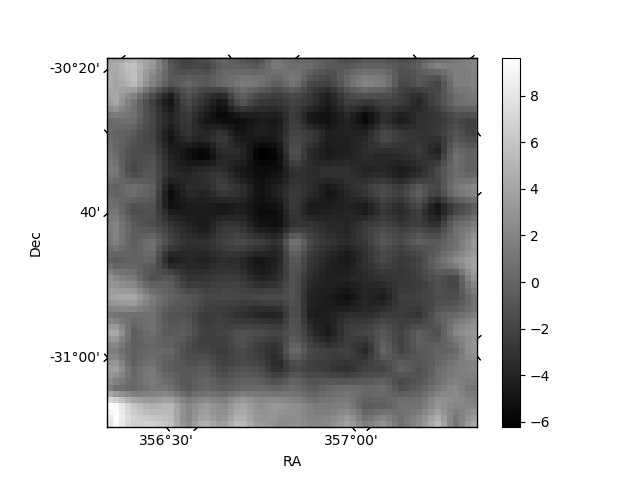
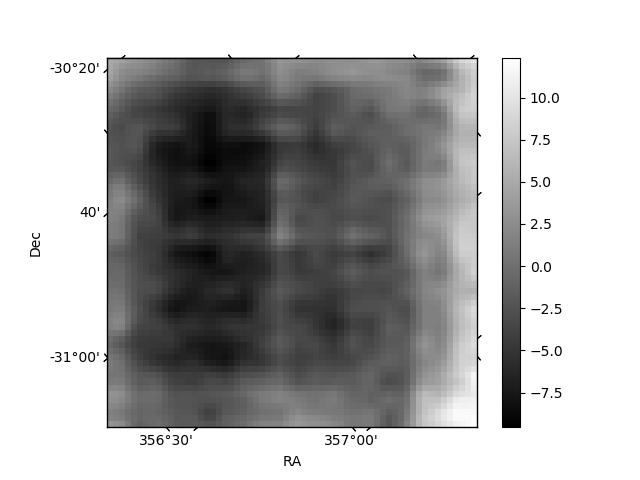
Histogram calculated using DETX and DETY for each event in the final _common_clean file
| Quadrant A | 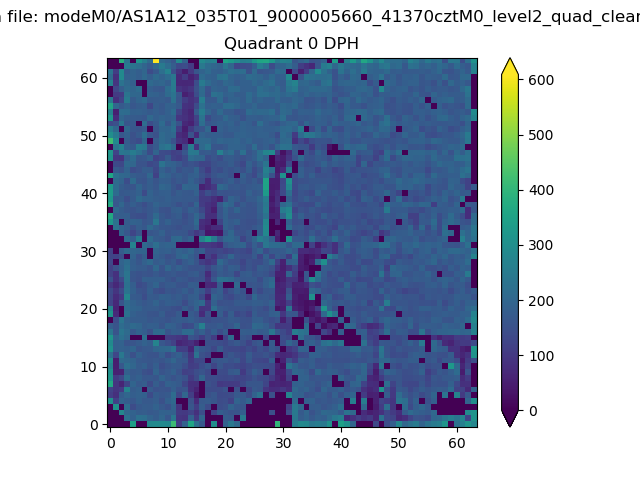 |
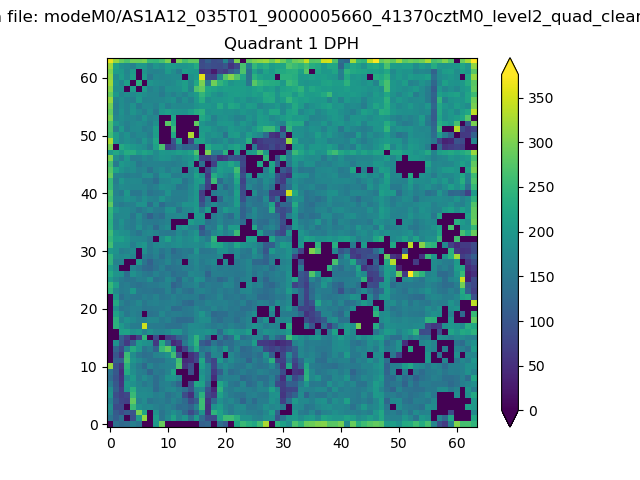 |
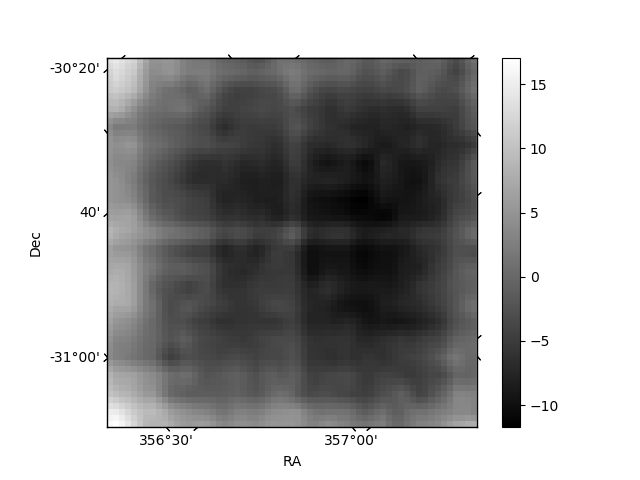
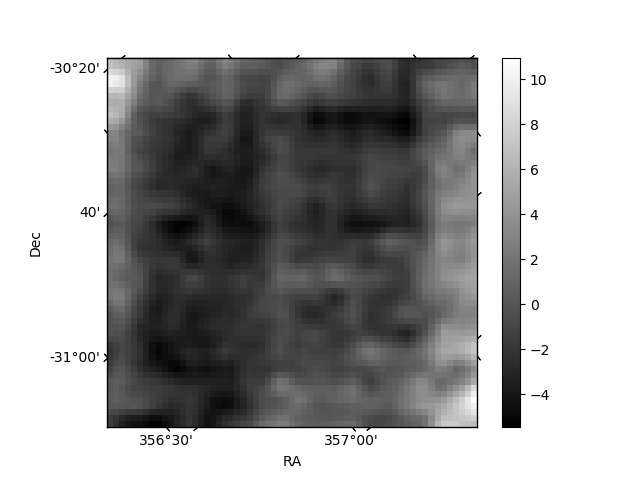
Quadrant B |
|---|---|---|---|
| Quadrant D | 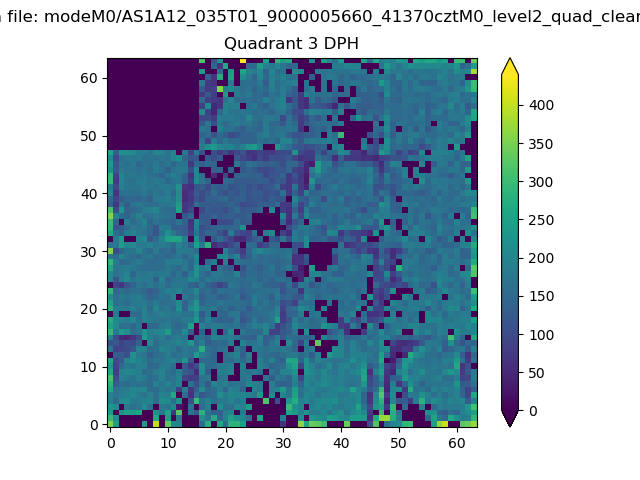 |
 |
Quadrant C |
| Plot type | Count rate plots | Images |
|---|---|---|
| Comparison with Poisson distribution Blue bars denote a histogram of data divided into 1 sec bins. Red curve is a Poisson curve with rate = median count rate of data. |
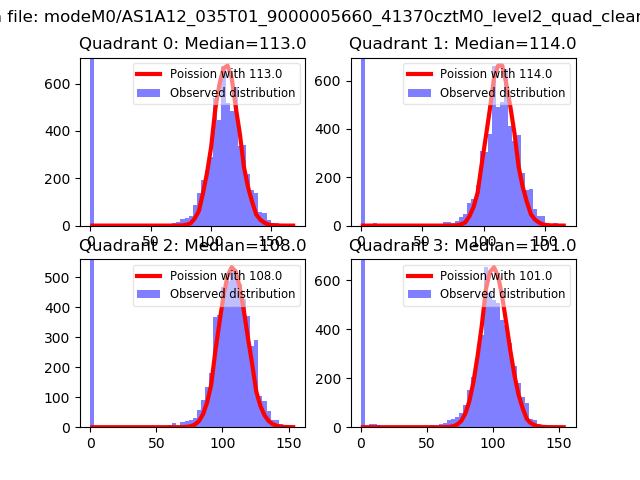 |
 |
| Quadrant-wise count rates Data is divided into 100 sec bins |
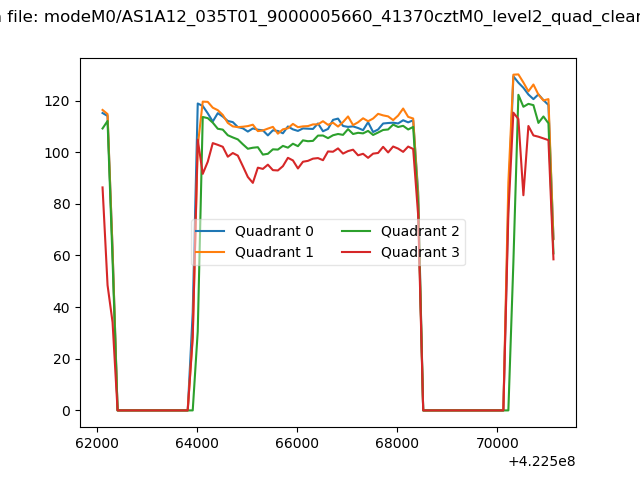 |
|
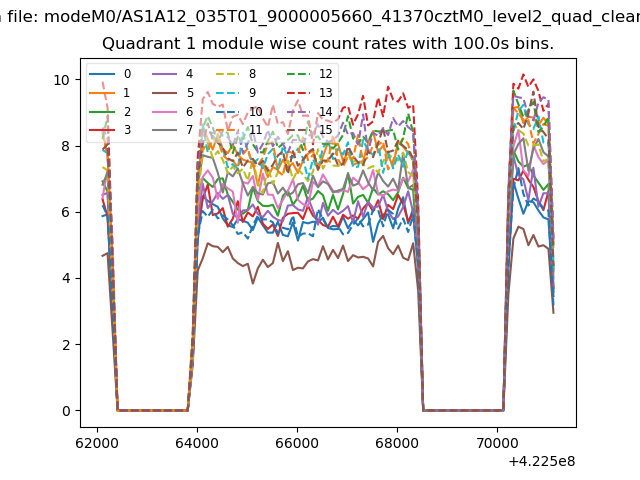
| Module-wise count rates for Quadrant A Data is divided into 100 sec bins |
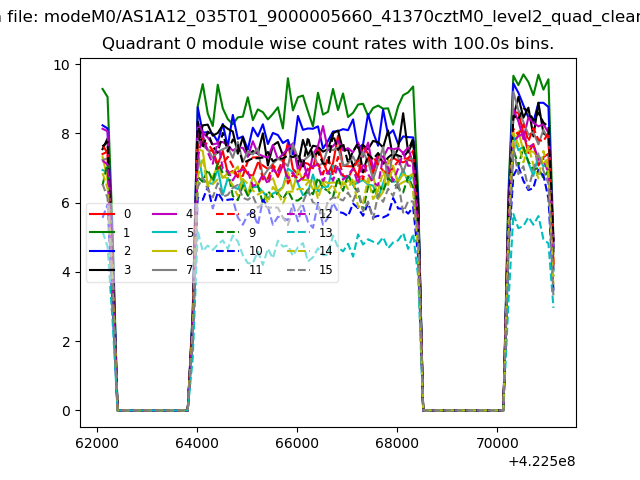 |
 |
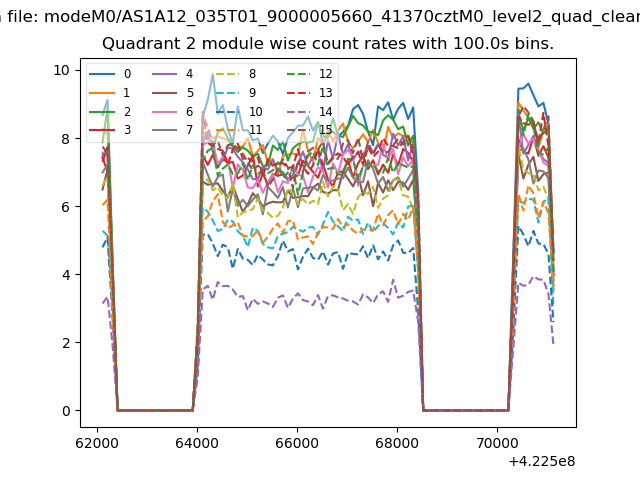
| Module-wise count rates for Quadrant B Data is divided into 100 sec bins |
 |
 |
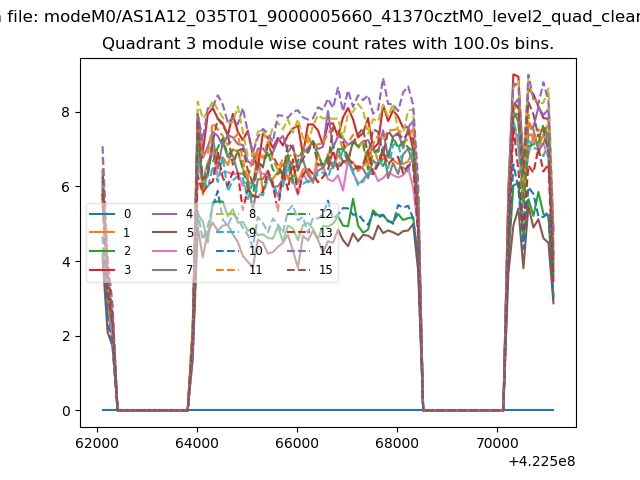
| Module-wise count rates for Quadrant C Data is divided into 100 sec bins |
 |
 |
| Module-wise count rates for Quadrant D Data is divided into 100 sec bins |
 |
 |
| Parameter | Plot |
|---|---|
| CZT HV Monitor | 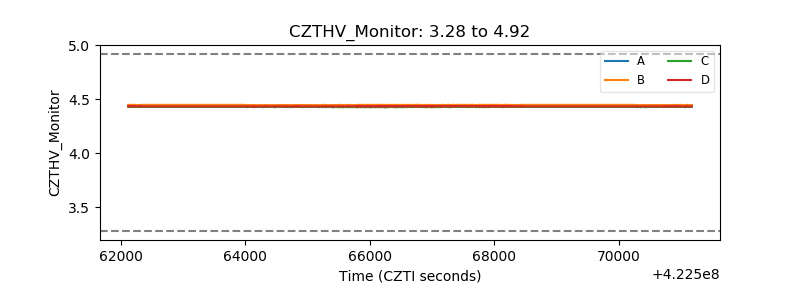 |
| D_VDD | 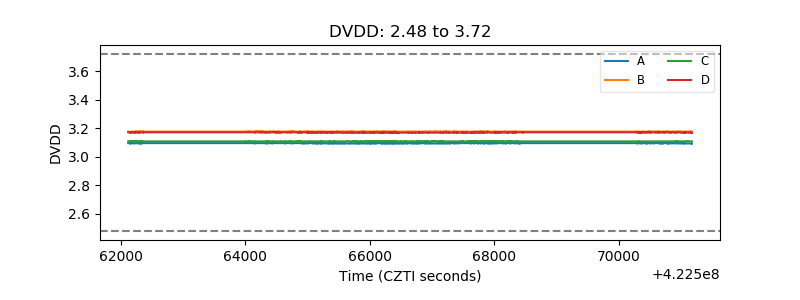 |
| Temperature 1 | 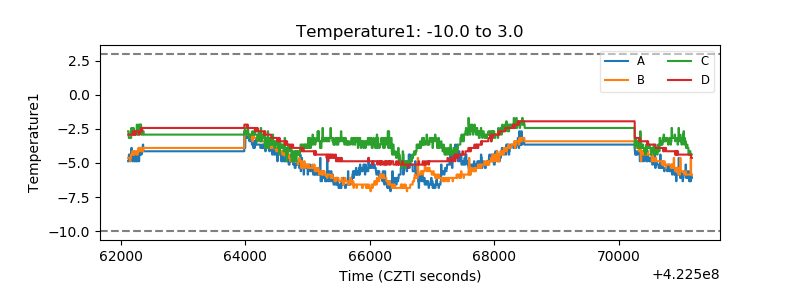 |
| Veto HV Monitor |  |
| Veto LLD | 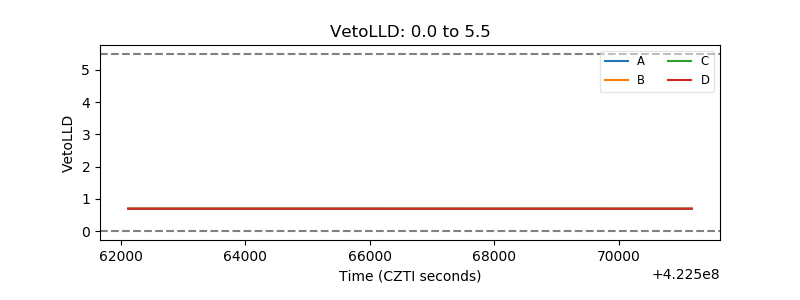 |
| Alpha Counter | 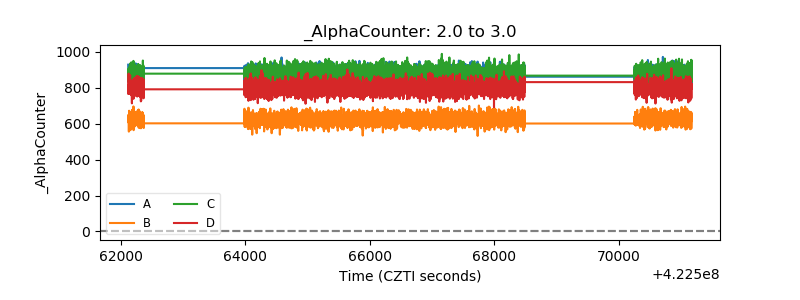 |
| _CPM_Rate | 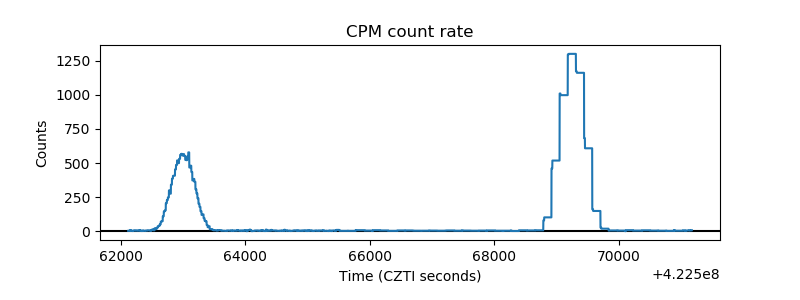 |
| CZT Counter | 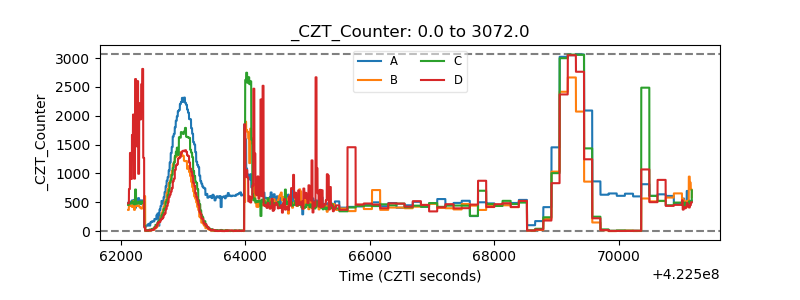 |
| +2.5 Volts monitor |  |
| +5 Volts monitor | 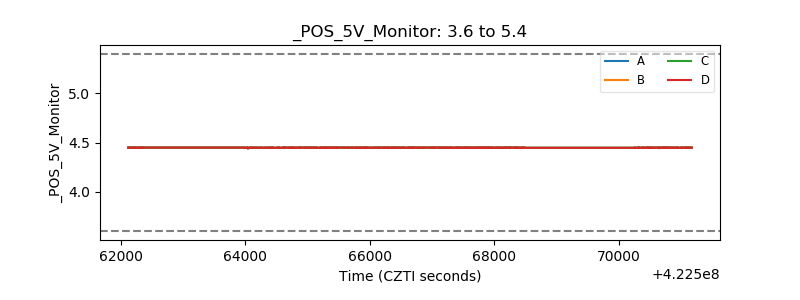 |
| _ROLL_ROT | 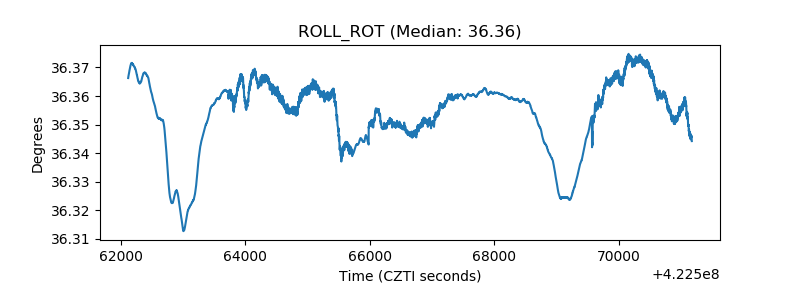 |
| _Roll_DEC | 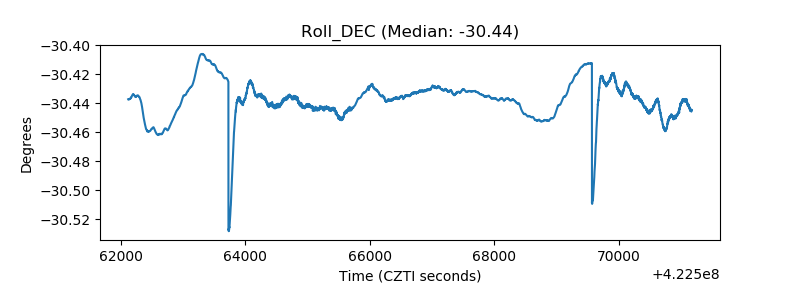 |
| _Roll_RA | 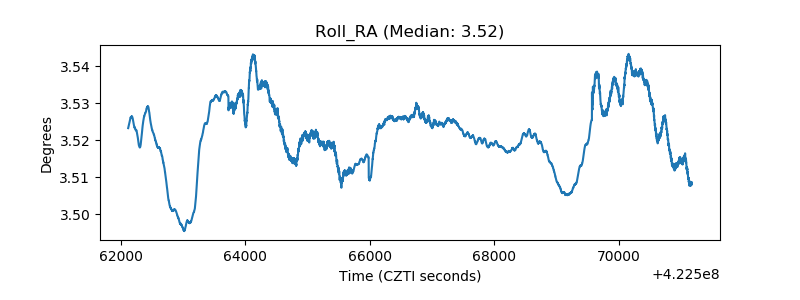 |
| Veto Counter | 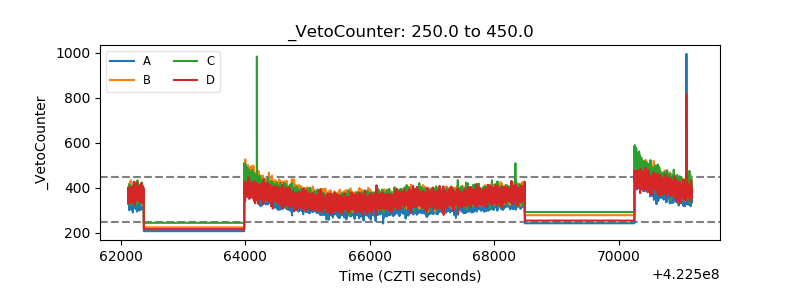 |