| Param | Original file | Final file |
|---|---|---|
| Filename | modeM0/AS1A12_035T01_9000005660_41371cztM0_level2.fits | modeM0/AS1A12_035T01_9000005660_41371cztM0_level2_quad_clean.evt |
| Size (bytes) | 331,355,520 | 90,360,000 |
| Size | 316.0 MB | 86.2 MB |
| Events in quadrant A | 2,840,370 | 619,570 |
| Events in quadrant B | 2,962,970 | 631,851 |
| Events in quadrant C | 3,103,693 | 567,148 |
| Events in quadrant D | 2,949,333 | 549,939 |
| Mode M0 | |||
|---|---|---|---|
| Quadrant | BADHDUFLAG | Total packets | Discarded packets |
| A | 0 | 11636 | 3 |
| B | 0 | 12180 | 2 |
| C | 0 | 12389 | 2 |
| D | 0 | 12476 | 2 |
| Mode SS | |||
|---|---|---|---|
| Quadrant | BADHDUFLAG | Total packets | Discarded packets |
| A | 0 | 106 | 0 |
| B | 0 | 106 | 0 |
| C | 0 | 106 | 0 |
| D | 0 | 106 | 0 |
| Mode M9 | |||
|---|---|---|---|
| Quadrant | BADHDUFLAG | Total packets | Discarded packets |
| A | 0 | 34 | 0 |
| B | 0 | 34 | 0 |
| C | 0 | 34 | 0 |
| D | 0 | 35 | 0 |
| Quadrant | Total seconds | Saturated seconds | Saturation percentage |
|---|---|---|---|
| A | 5254 | 12 | 0.228397% |
| B | 5254 | 18 | 0.342596% |
| C | 5254 | 255 | 4.853445% |
| D | 5254 | 54 | 1.027788% |
Noise dominated data is calculated using 1-second bins in cleaned event files. If a bin has >2000 counts, and if more than 50% of those come from <1% of pixels, then it is considered to be noise-dominated and hence unusable.
| Quadrant | # 1 sec bins | Bins with >0 counts | Bins with >2000 counts | High rate bins dominated by noise | Noise dominated (total time) | Noise dominated (detector-on time) | Marked lightcurve |
|---|---|---|---|---|---|---|---|
| A | 7137 | 5255 | 3 | 3 | 0.04% | 0.06% | 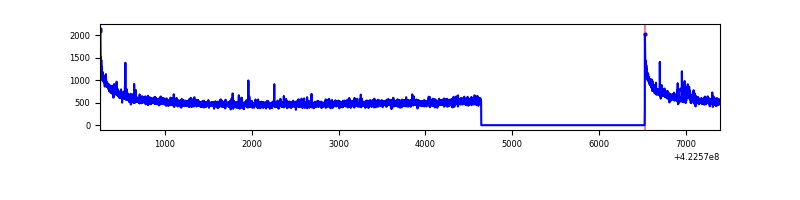 |
| B | 7137 | 5255 | 9 | 9 | 0.13% | 0.17% | 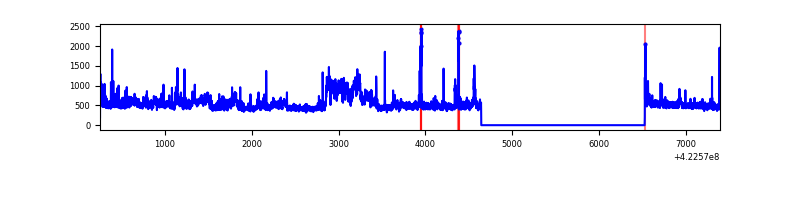 |
| C | 7137 | 5255 | 247 | 247 | 3.46% | 4.70% | 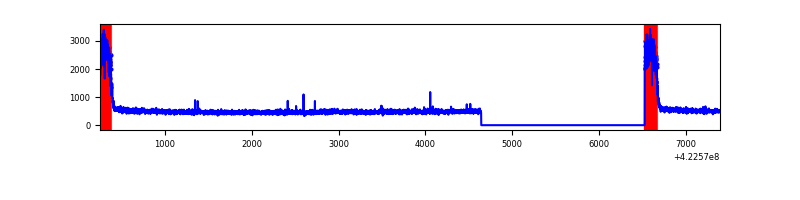 |
| D | 7137 | 5255 | 57 | 57 | 0.80% | 1.08% | 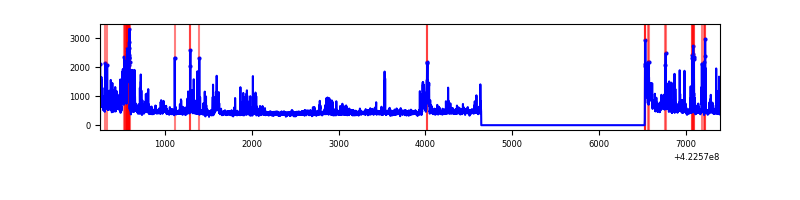 |
Top three noisy pixels from each quadrant. If the there are fewer than three noisy pixels in the level2.evt file, extra rows are filled as -1
| Pixel properties | Quadrant properties | ||||||
|---|---|---|---|---|---|---|---|
| Quadrant | DetID | PixID | Counts | Sigma | Mean | Median | Sigma |
| A | 10 | 83 | 498334 | 4072.81 | 597 | 585 | 122.2 |
| A | 9 | 240 | 19355 | 153.58 | 597 | 585 | 122.2 |
| A | 13 | 254 | 7076 | 53.11 | 597 | 585 | 122.2 |
| B | 0 | 229 | 464852 | 4039.65 | 593 | 576 | 114.9 |
| B | 0 | 190 | 72596 | 626.64 | 593 | 576 | 114.9 |
| B | 5 | 255 | 53250 | 458.32 | 593 | 576 | 114.9 |
| C | 0 | 10 | 673502 | 5067.89 | 567 | 571 | 132.8 |
| C | 15 | 214 | 217699 | 1635.21 | 567 | 571 | 132.8 |
| C | 13 | 61 | 3641 | 23.12 | 567 | 571 | 132.8 |
| D | 1 | 52 | 245456 | 1711.47 | 584 | 567 | 143.1 |
| D | 13 | 249 | 167100 | 1163.86 | 584 | 567 | 143.1 |
| D | 1 | 47 | 119750 | 832.94 | 584 | 567 | 143.1 |
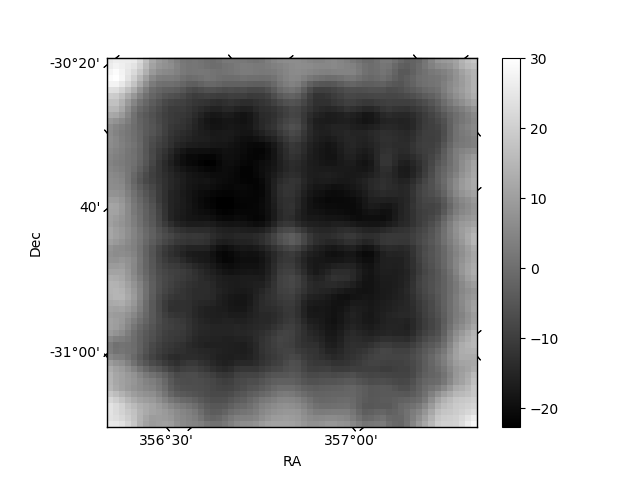
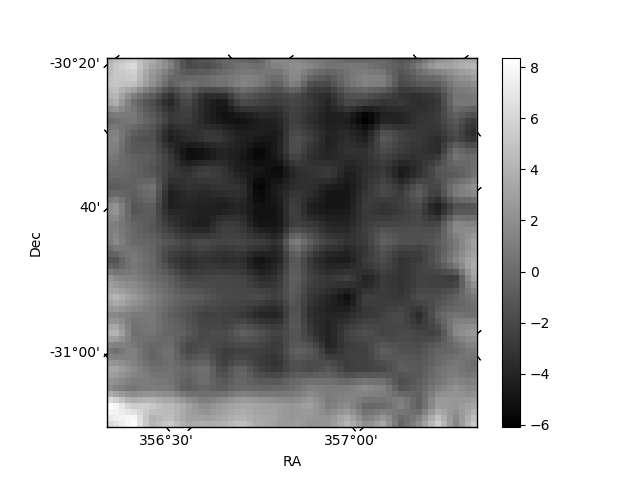
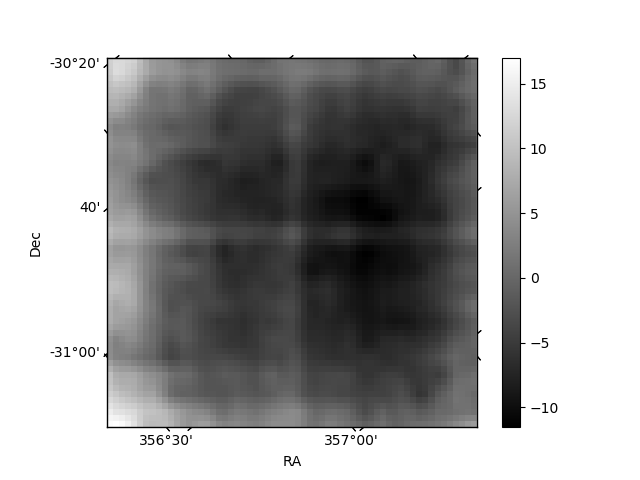
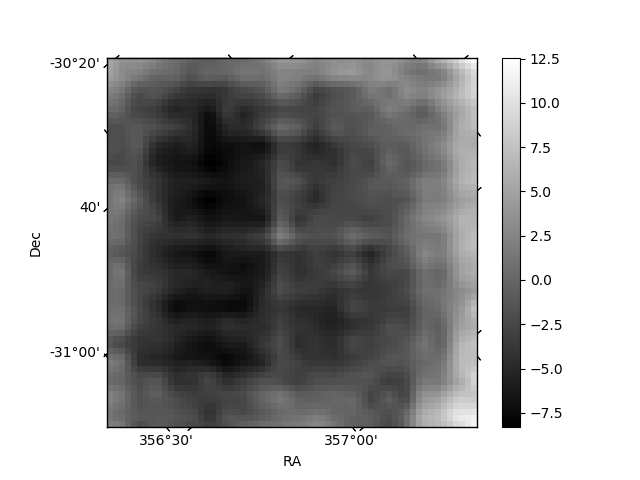
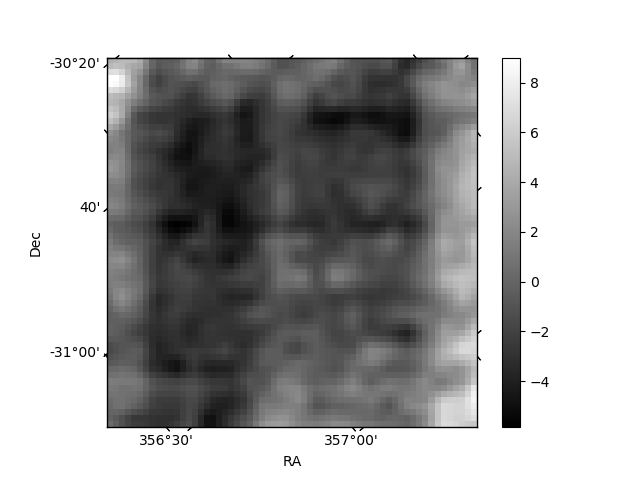
Histogram calculated using DETX and DETY for each event in the final _common_clean file
| Quadrant A | 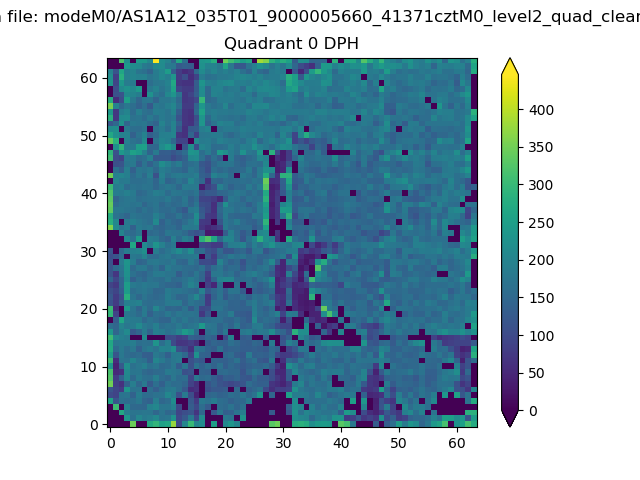 |
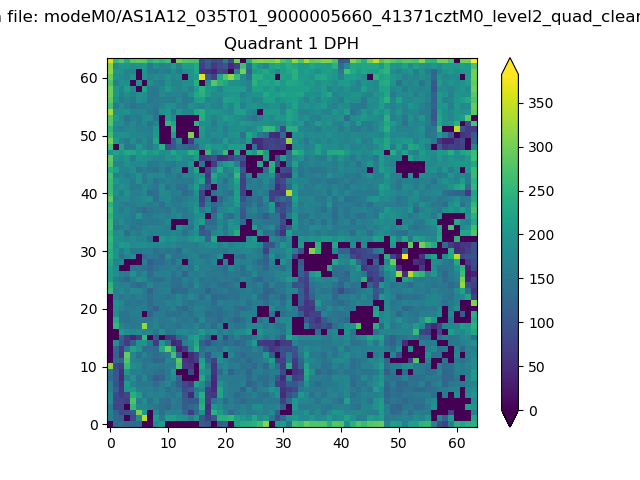 |
Quadrant B |
|---|---|---|---|
| Quadrant D | 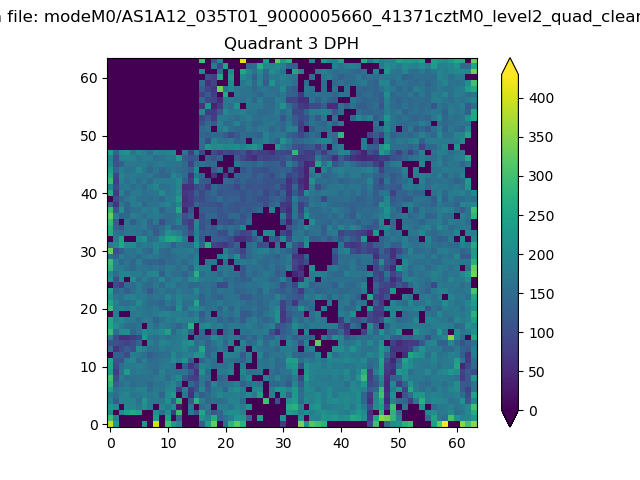 |
 |
Quadrant C |
| Plot type | Count rate plots | Images |
|---|---|---|
| Comparison with Poisson distribution Blue bars denote a histogram of data divided into 1 sec bins. Red curve is a Poisson curve with rate = median count rate of data. |
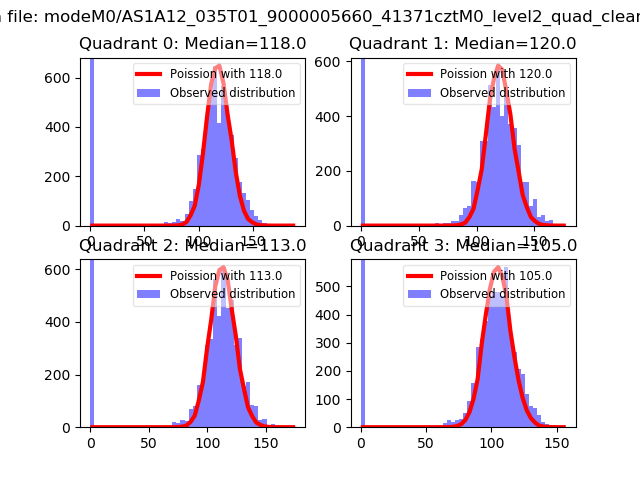 |
 |
| Quadrant-wise count rates Data is divided into 100 sec bins |
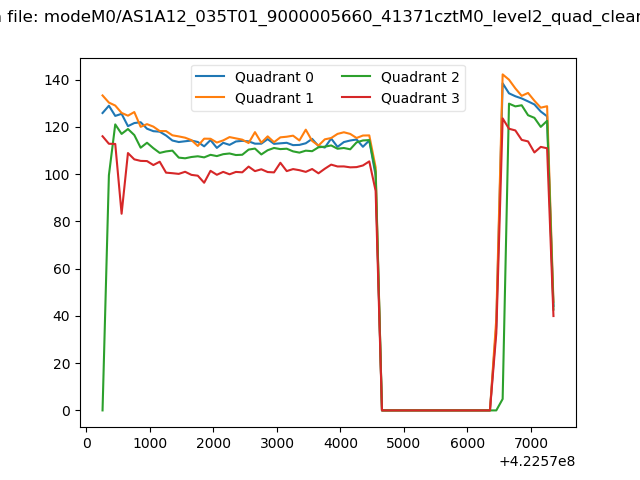 |
|
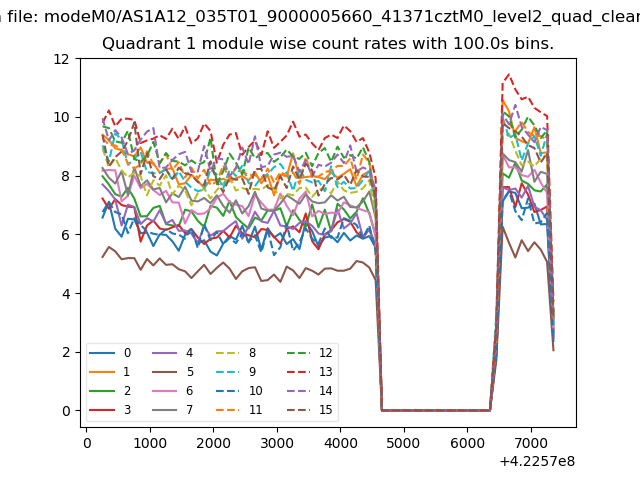
| Module-wise count rates for Quadrant A Data is divided into 100 sec bins |
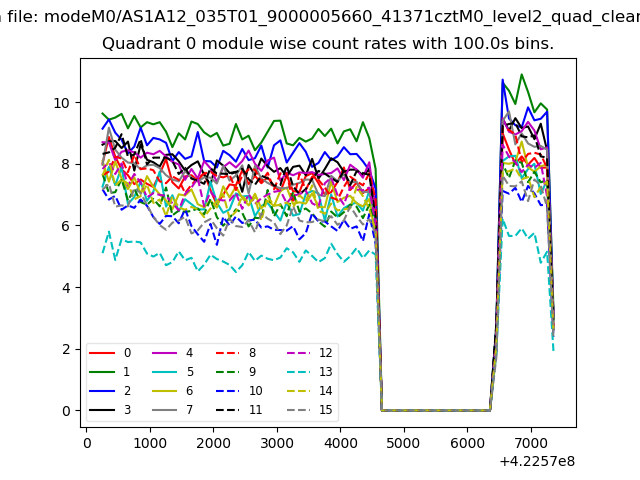 |
 |
| Module-wise count rates for Quadrant B Data is divided into 100 sec bins |
 |
 |
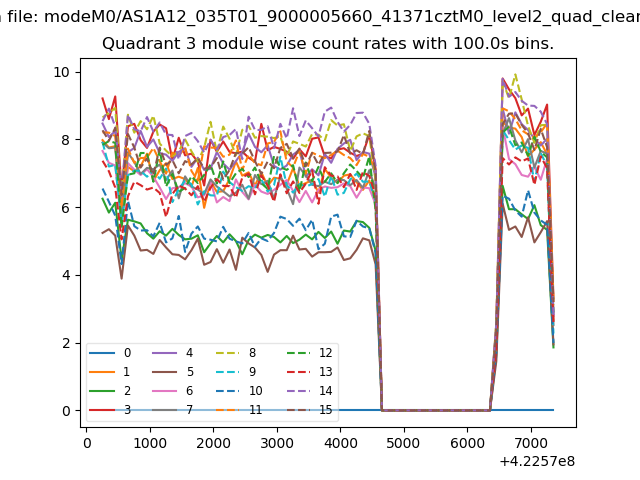
| Module-wise count rates for Quadrant C Data is divided into 100 sec bins |
 |
 |
| Module-wise count rates for Quadrant D Data is divided into 100 sec bins |
 |
 |
| Parameter | Plot |
|---|---|
| CZT HV Monitor | 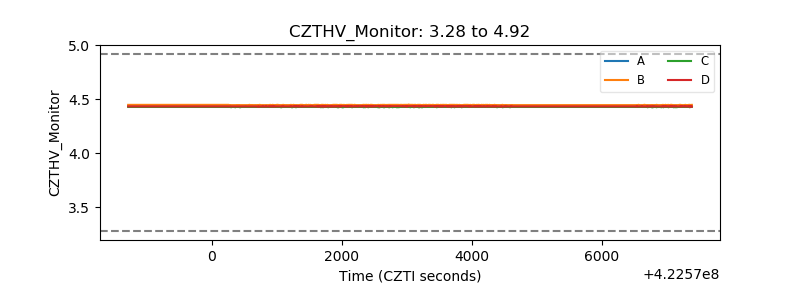 |
| D_VDD | 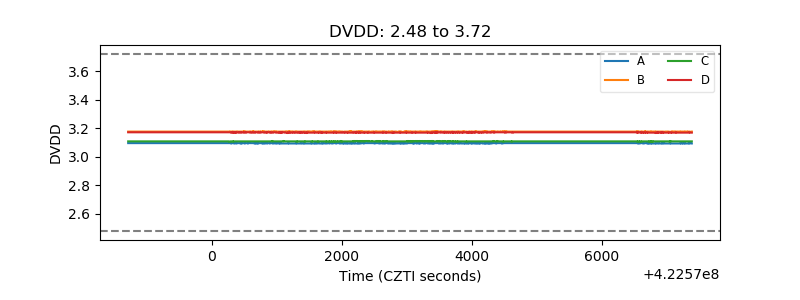 |
| Temperature 1 | 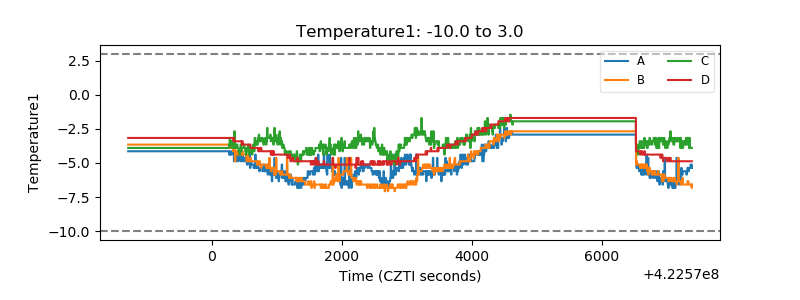 |
| Veto HV Monitor | 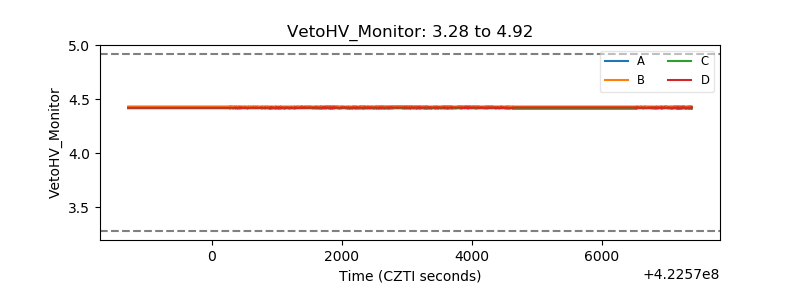 |
| Veto LLD | 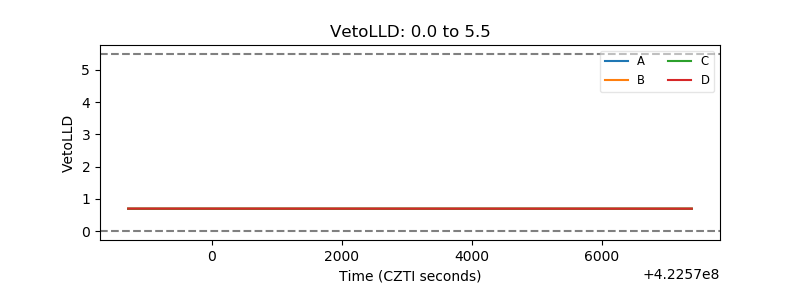 |
| Alpha Counter | 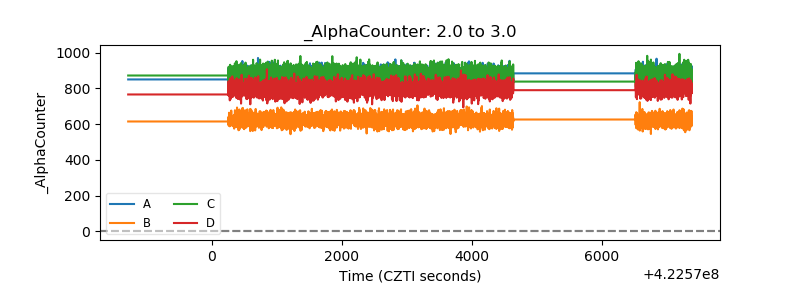 |
| _CPM_Rate | 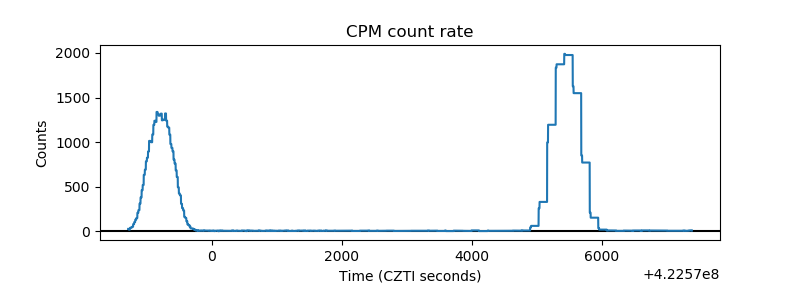 |
| CZT Counter |  |
| +2.5 Volts monitor |  |
| +5 Volts monitor | 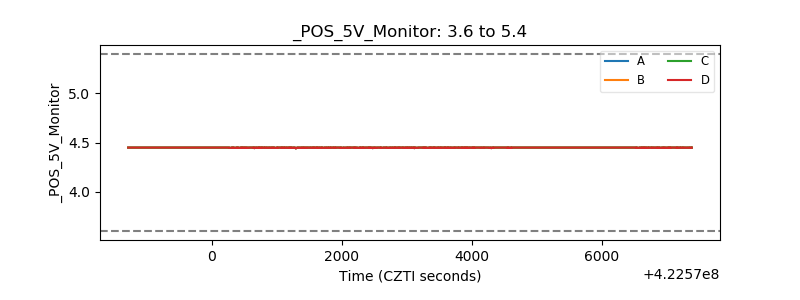 |
| _ROLL_ROT | 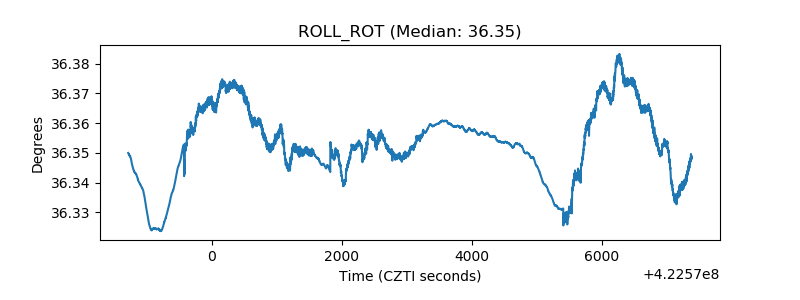 |
| _Roll_DEC | 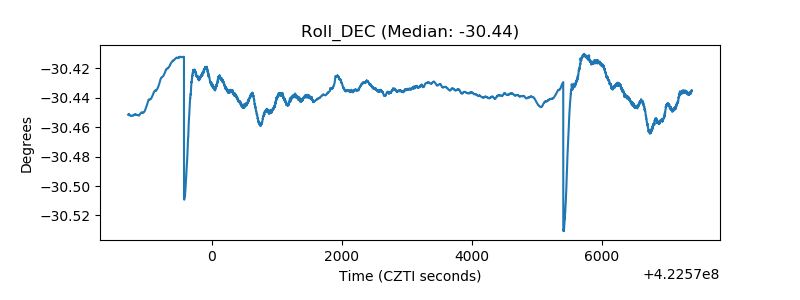 |
| _Roll_RA | 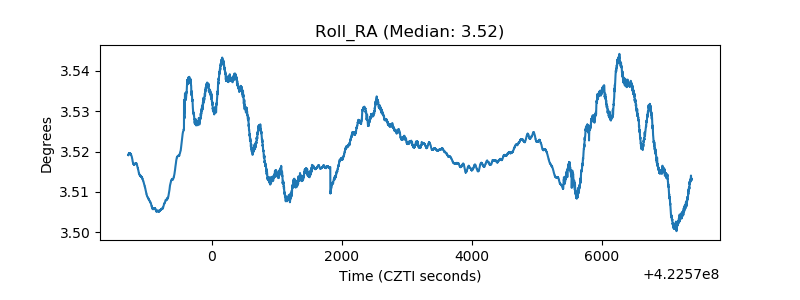 |
| Veto Counter | 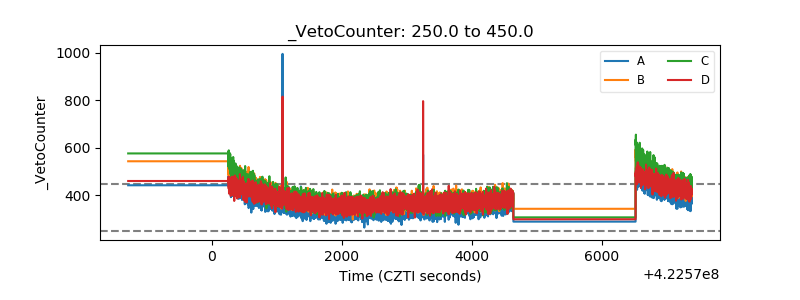 |