| Param | Original file | Final file |
|---|---|---|
| Filename | modeM0/AS1A12_035T01_9000005660_41372cztM0_level2.fits | modeM0/AS1A12_035T01_9000005660_41372cztM0_level2_quad_clean.evt |
| Size (bytes) | 335,445,120 | 96,327,360 |
| Size | 319.9 MB | 91.9 MB |
| Events in quadrant A | 2,977,135 | 658,637 |
| Events in quadrant B | 2,612,418 | 677,595 |
| Events in quadrant C | 3,322,618 | 611,722 |
| Events in quadrant D | 3,079,733 | 587,379 |
| Mode M0 | |||
|---|---|---|---|
| Quadrant | BADHDUFLAG | Total packets | Discarded packets |
| A | 0 | 12122 | 3 |
| B | 0 | 11300 | 2 |
| C | 0 | 13052 | 2 |
| D | 0 | 12858 | 2 |
| Mode SS | |||
|---|---|---|---|
| Quadrant | BADHDUFLAG | Total packets | Discarded packets |
| A | 0 | 112 | 0 |
| B | 0 | 112 | 0 |
| C | 0 | 112 | 0 |
| D | 0 | 112 | 0 |
| Mode M9 | |||
|---|---|---|---|
| Quadrant | BADHDUFLAG | Total packets | Discarded packets |
| A | 0 | 39 | 0 |
| B | 0 | 39 | 0 |
| C | 0 | 39 | 0 |
| D | 0 | 39 | 0 |
| Quadrant | Total seconds | Saturated seconds | Saturation percentage |
|---|---|---|---|
| A | 5457 | 12 | 0.219901% |
| B | 5457 | 11 | 0.201576% |
| C | 5457 | 268 | 4.911123% |
| D | 5457 | 106 | 1.942459% |
Noise dominated data is calculated using 1-second bins in cleaned event files. If a bin has >2000 counts, and if more than 50% of those come from <1% of pixels, then it is considered to be noise-dominated and hence unusable.
| Quadrant | # 1 sec bins | Bins with >0 counts | Bins with >2000 counts | High rate bins dominated by noise | Noise dominated (total time) | Noise dominated (detector-on time) | Marked lightcurve |
|---|---|---|---|---|---|---|---|
| A | 9342 | 5459 | 2 | 2 | 0.02% | 0.04% | 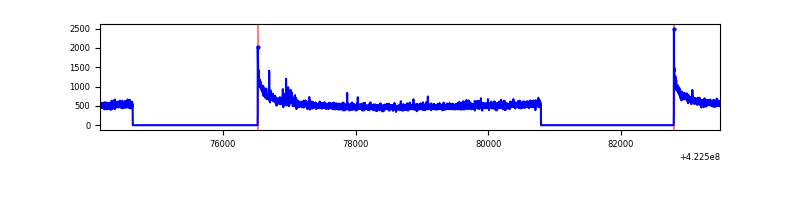 |
| B | 9342 | 5459 | 5 | 5 | 0.05% | 0.09% | 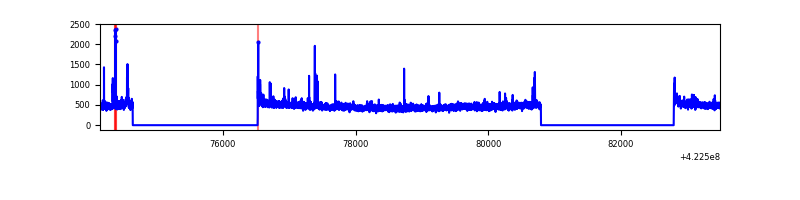 |
| C | 9342 | 5459 | 263 | 263 | 2.82% | 4.82% | 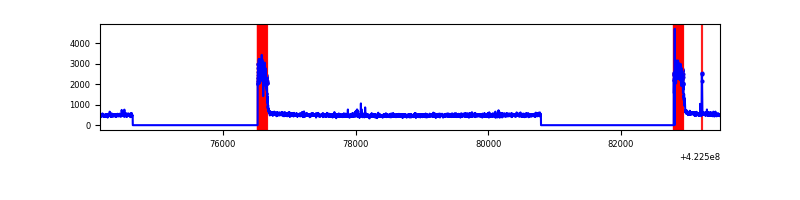 |
| D | 9342 | 5459 | 89 | 89 | 0.95% | 1.63% | 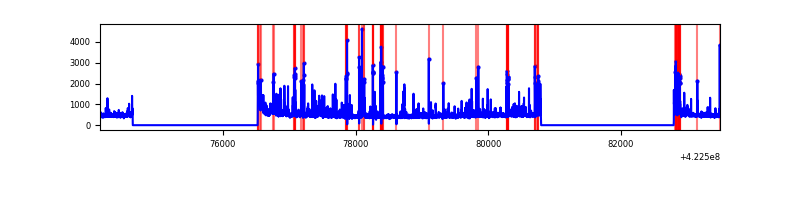 |
Top three noisy pixels from each quadrant. If the there are fewer than three noisy pixels in the level2.evt file, extra rows are filled as -1
| Pixel properties | Quadrant properties | ||||||
|---|---|---|---|---|---|---|---|
| Quadrant | DetID | PixID | Counts | Sigma | Mean | Median | Sigma |
| A | 10 | 83 | 503866 | 3872.19 | 633 | 621 | 130.0 |
| A | 9 | 240 | 19405 | 144.53 | 633 | 621 | 130.0 |
| A | 3 | 137 | 6965 | 48.81 | 633 | 621 | 130.0 |
| B | 0 | 190 | 43452 | 350.19 | 629 | 612 | 122.3 |
| B | 4 | 81 | 30882 | 247.44 | 629 | 612 | 122.3 |
| B | 5 | 255 | 30067 | 240.78 | 629 | 612 | 122.3 |
| C | 0 | 10 | 722696 | 5164.88 | 601 | 606 | 139.8 |
| C | 15 | 214 | 224287 | 1599.92 | 601 | 606 | 139.8 |
| C | 15 | 111 | 25609 | 178.84 | 601 | 606 | 139.8 |
| D | 1 | 52 | 336221 | 2266.83 | 616 | 601 | 148.1 |
| D | 13 | 249 | 150304 | 1011.12 | 616 | 601 | 148.1 |
| D | 5 | 222 | 88324 | 592.5 | 616 | 601 | 148.1 |
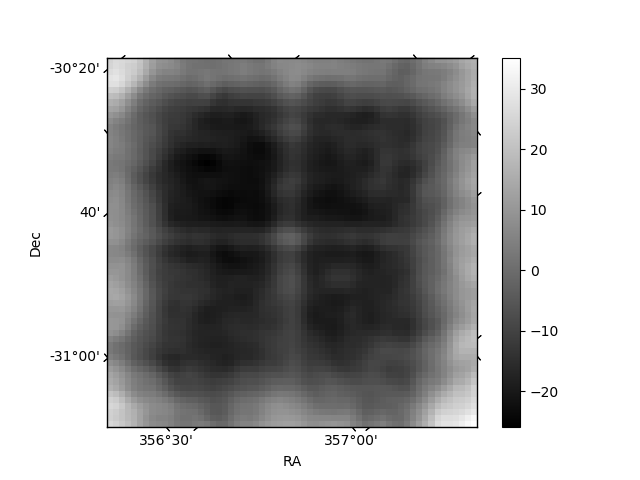
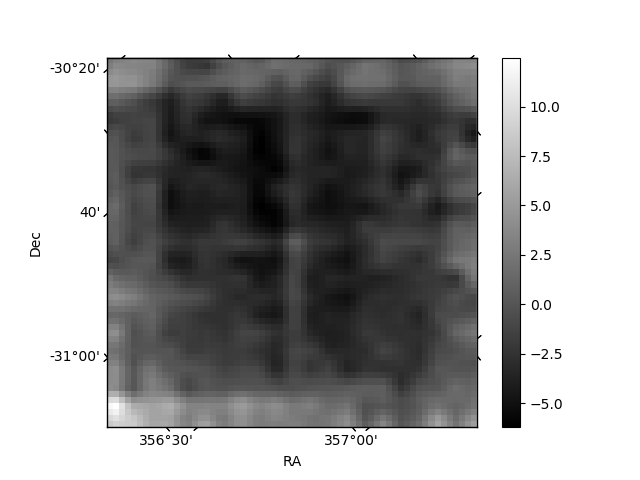
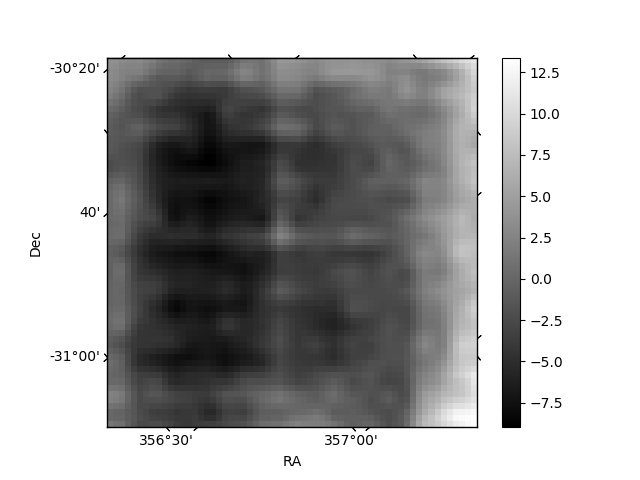
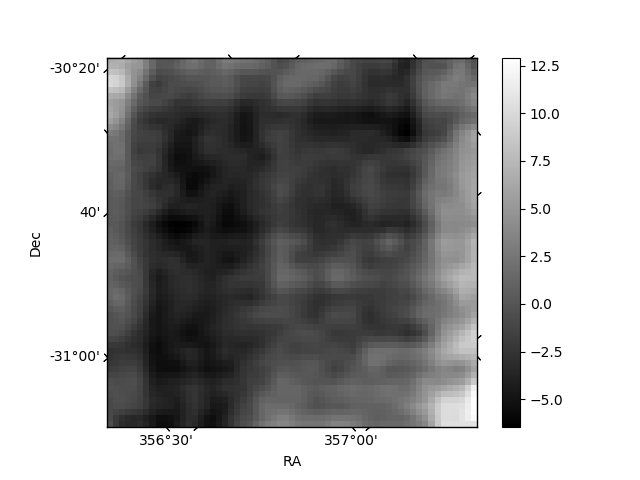
Histogram calculated using DETX and DETY for each event in the final _common_clean file
| Quadrant A | 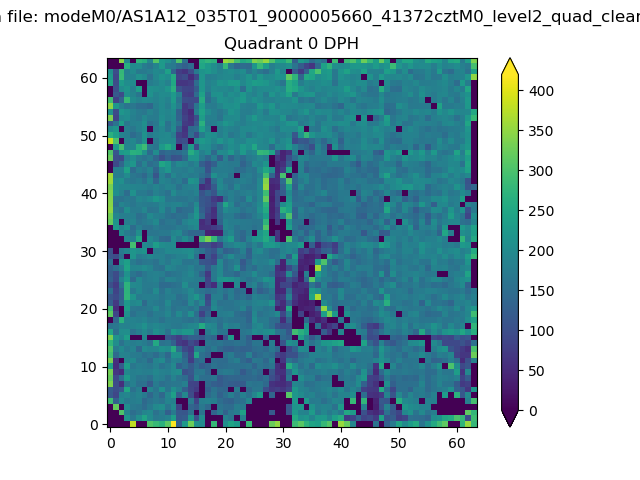 |
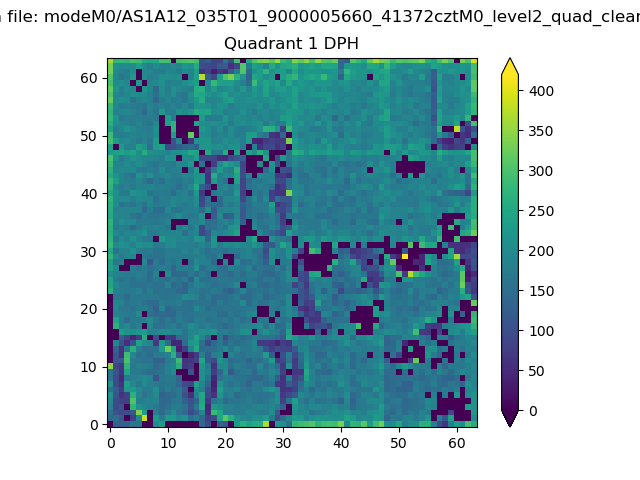 |
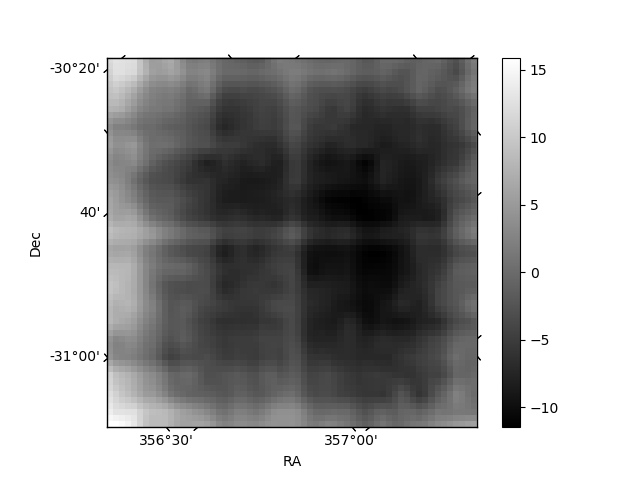
Quadrant B |
|---|---|---|---|
| Quadrant D | 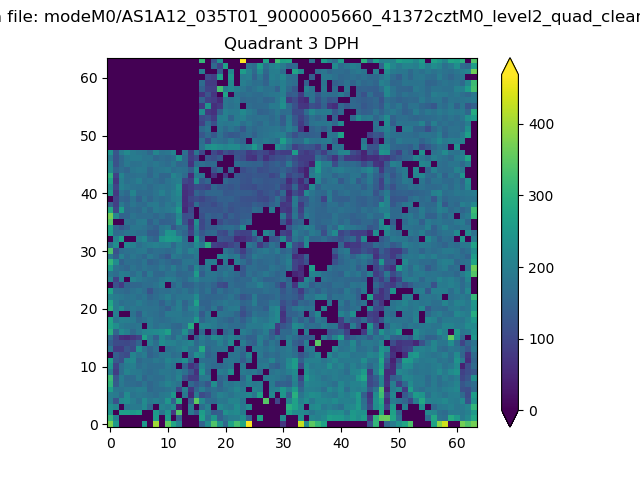 |
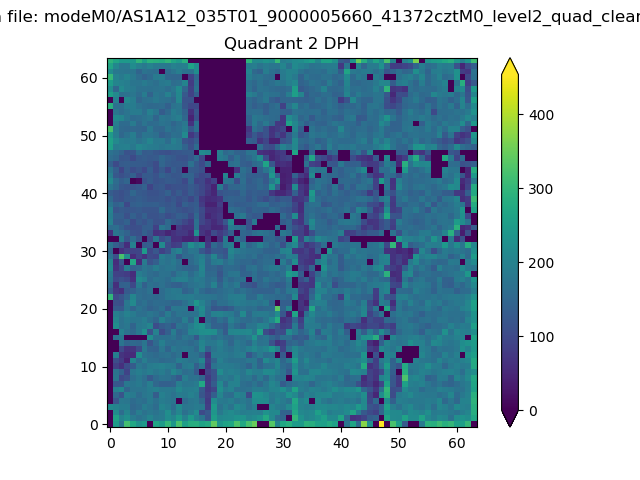 |
Quadrant C |
| Plot type | Count rate plots | Images |
|---|---|---|
| Comparison with Poisson distribution Blue bars denote a histogram of data divided into 1 sec bins. Red curve is a Poisson curve with rate = median count rate of data. |
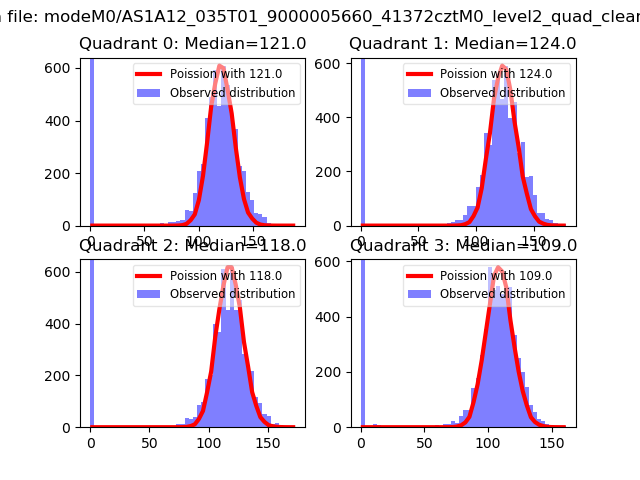 |
 |
| Quadrant-wise count rates Data is divided into 100 sec bins |
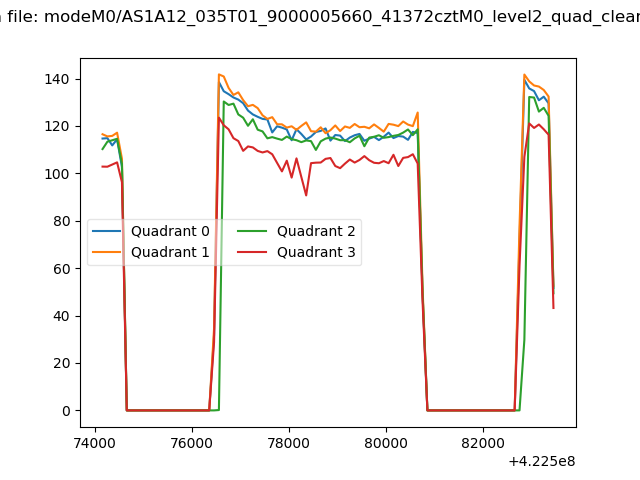 |
|
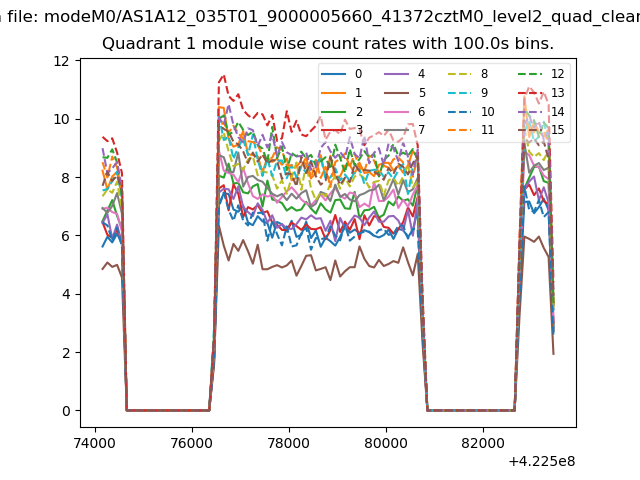
| Module-wise count rates for Quadrant A Data is divided into 100 sec bins |
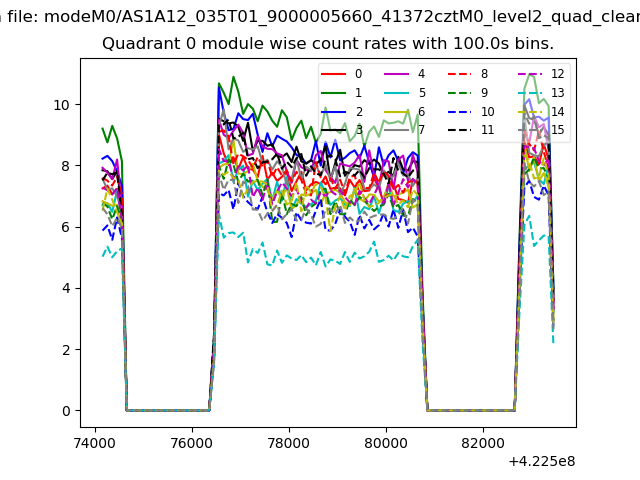 |
 |
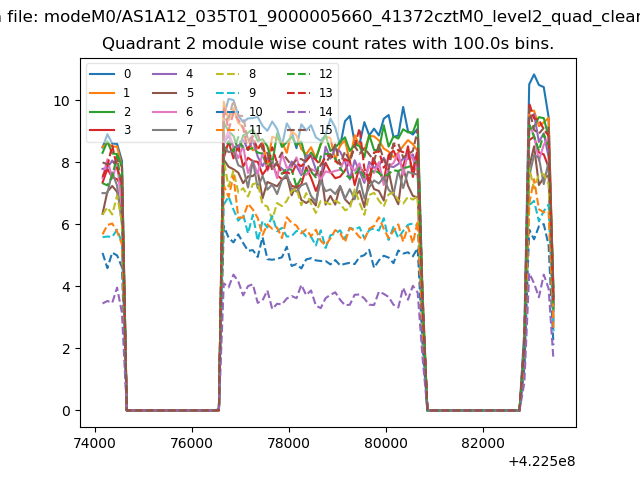
| Module-wise count rates for Quadrant B Data is divided into 100 sec bins |
 |
 |
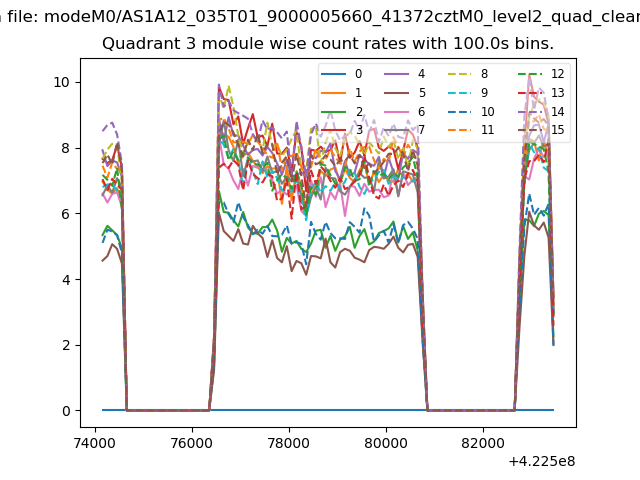
| Module-wise count rates for Quadrant C Data is divided into 100 sec bins |
 |
 |
| Module-wise count rates for Quadrant D Data is divided into 100 sec bins |
 |
 |
| Parameter | Plot |
|---|---|
| CZT HV Monitor | 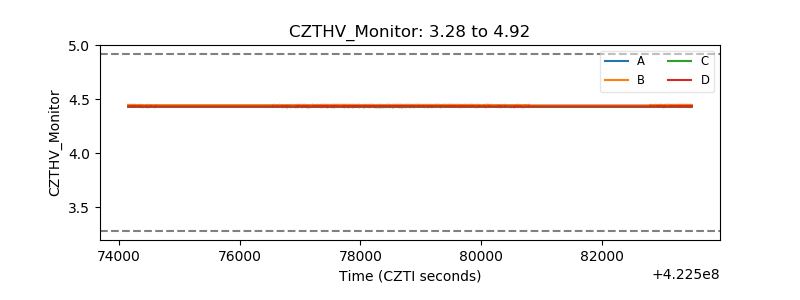 |
| D_VDD | 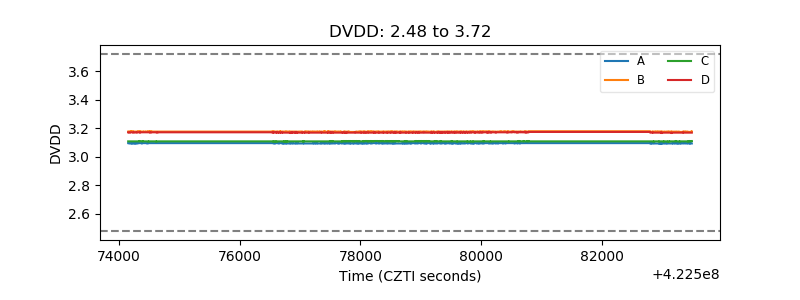 |
| Temperature 1 | 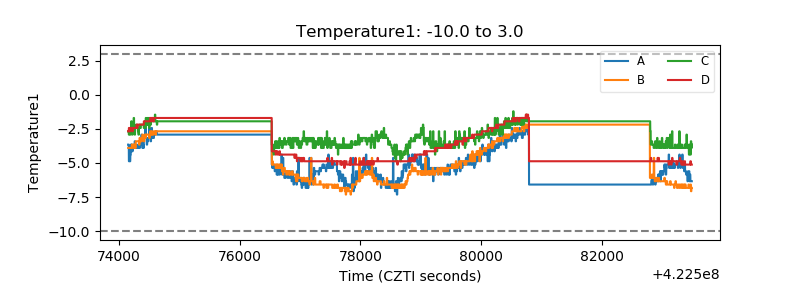 |
| Veto HV Monitor | 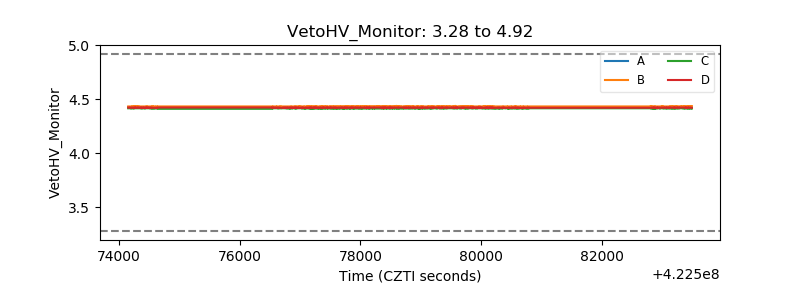 |
| Veto LLD | 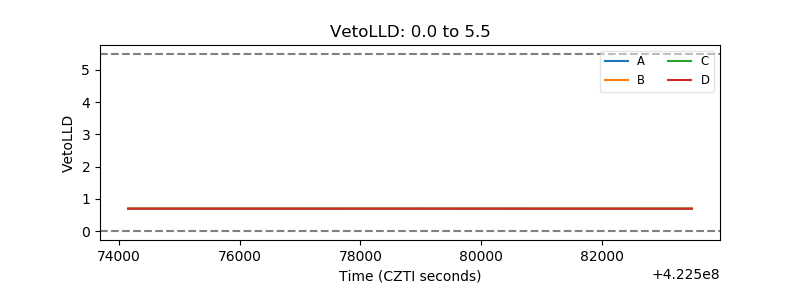 |
| Alpha Counter |  |
| _CPM_Rate | 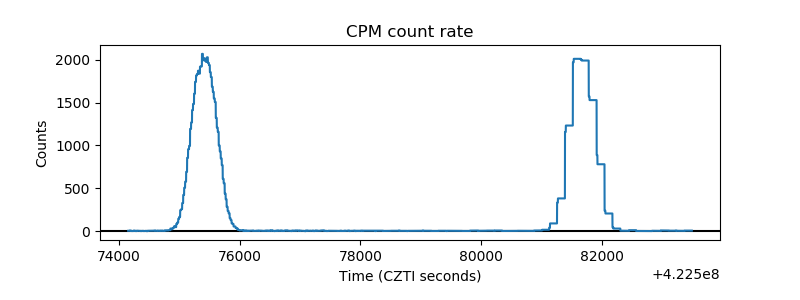 |
| CZT Counter | 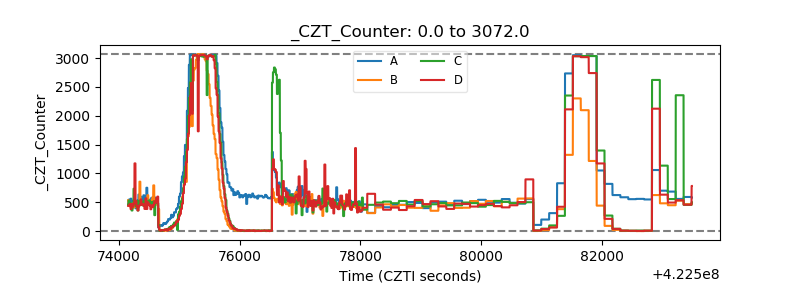 |
| +2.5 Volts monitor | 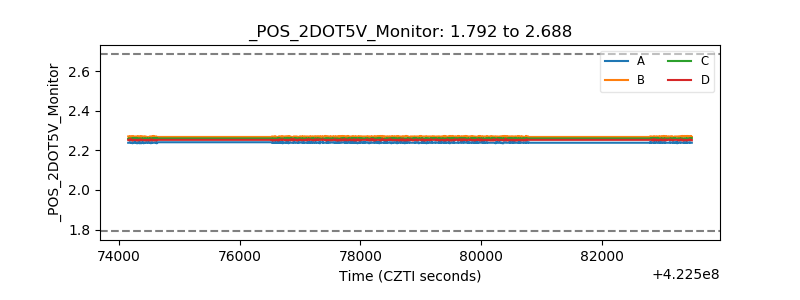 |
| +5 Volts monitor | 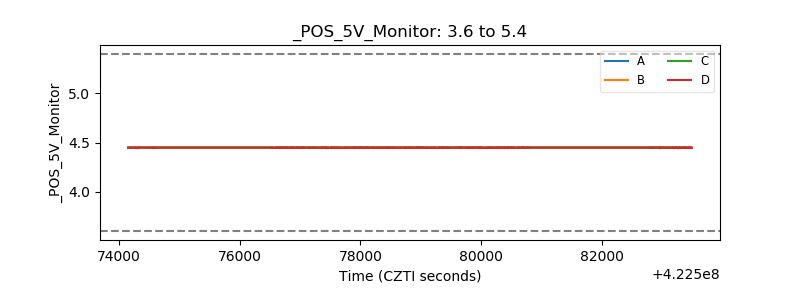 |
| _ROLL_ROT | 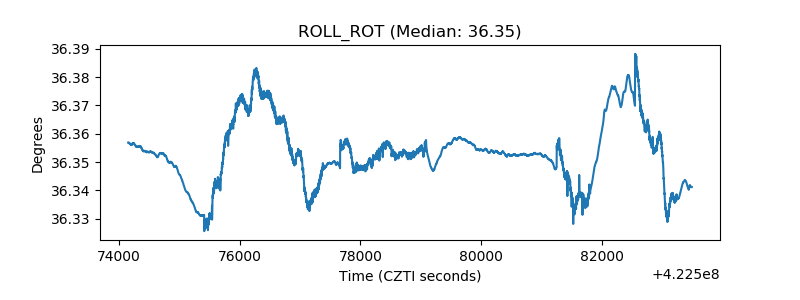 |
| _Roll_DEC | 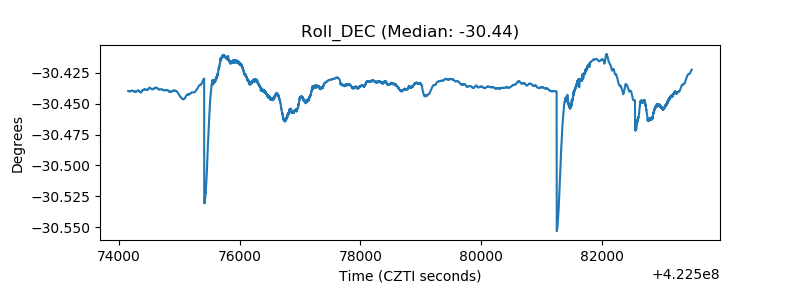 |
| _Roll_RA | 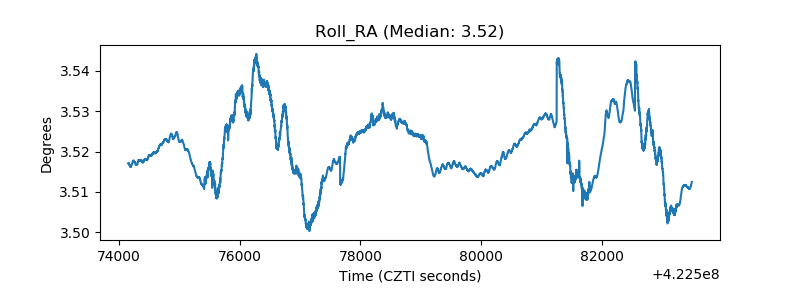 |
| Veto Counter | 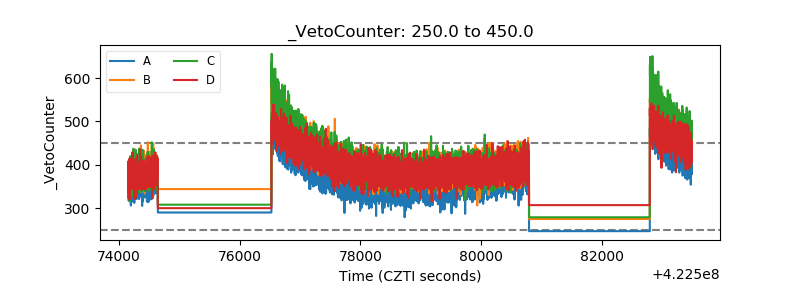 |