| Param | Original file | Final file |
|---|---|---|
| Filename | modeM0/AS1A12_035T01_9000005660_41373cztM0_level2.fits | modeM0/AS1A12_035T01_9000005660_41373cztM0_level2_quad_clean.evt |
| Size (bytes) | 311,765,760 | 87,822,720 |
| Size | 297.3 MB | 83.8 MB |
| Events in quadrant A | 2,709,096 | 599,953 |
| Events in quadrant B | 2,347,236 | 618,950 |
| Events in quadrant C | 3,048,435 | 559,980 |
| Events in quadrant D | 3,051,088 | 534,633 |
| Mode M0 | |||
|---|---|---|---|
| Quadrant | BADHDUFLAG | Total packets | Discarded packets |
| A | 0 | 11025 | 3 |
| B | 0 | 10203 | 2 |
| C | 0 | 11912 | 2 |
| D | 0 | 12446 | 2 |
| Mode SS | |||
|---|---|---|---|
| Quadrant | BADHDUFLAG | Total packets | Discarded packets |
| A | 0 | 100 | 0 |
| B | 0 | 100 | 0 |
| C | 0 | 100 | 0 |
| D | 0 | 100 | 0 |
| Mode M9 | |||
|---|---|---|---|
| Quadrant | BADHDUFLAG | Total packets | Discarded packets |
| A | 0 | 37 | 0 |
| B | 0 | 37 | 0 |
| C | 0 | 37 | 0 |
| D | 0 | 38 | 0 |
| Quadrant | Total seconds | Saturated seconds | Saturation percentage |
|---|---|---|---|
| A | 4933 | 13 | 0.263531% |
| B | 4933 | 8 | 0.162173% |
| C | 4933 | 262 | 5.311170% |
| D | 4933 | 171 | 3.466450% |
Noise dominated data is calculated using 1-second bins in cleaned event files. If a bin has >2000 counts, and if more than 50% of those come from <1% of pixels, then it is considered to be noise-dominated and hence unusable.
| Quadrant | # 1 sec bins | Bins with >0 counts | Bins with >2000 counts | High rate bins dominated by noise | Noise dominated (total time) | Noise dominated (detector-on time) | Marked lightcurve |
|---|---|---|---|---|---|---|---|
| A | 6996 | 4934 | 4 | 4 | 0.06% | 0.08% | 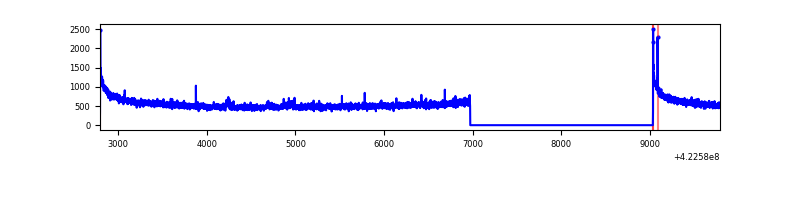 |
| B | 6996 | 4934 | 2 | 2 | 0.03% | 0.04% | 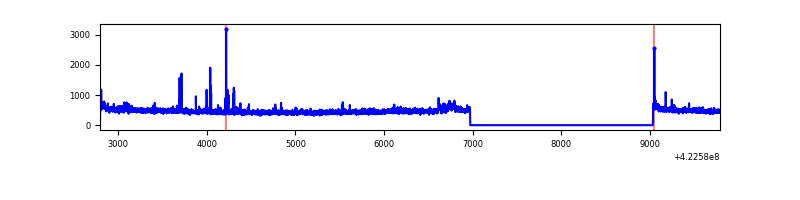 |
| C | 6996 | 4934 | 252 | 252 | 3.60% | 5.11% | 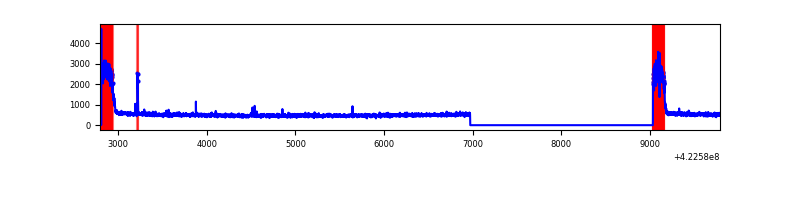 |
| D | 6996 | 4934 | 145 | 145 | 2.07% | 2.94% | 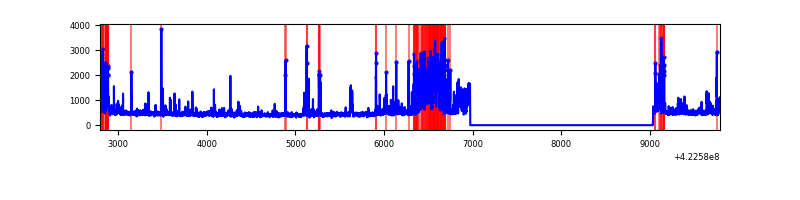 |
Top three noisy pixels from each quadrant. If the there are fewer than three noisy pixels in the level2.evt file, extra rows are filled as -1
| Pixel properties | Quadrant properties | ||||||
|---|---|---|---|---|---|---|---|
| Quadrant | DetID | PixID | Counts | Sigma | Mean | Median | Sigma |
| A | 10 | 83 | 473245 | 4047.4 | 570 | 558 | 116.8 |
| A | 12 | 189 | 27670 | 232.15 | 570 | 558 | 116.8 |
| A | 13 | 254 | 7249 | 57.29 | 570 | 558 | 116.8 |
| B | 4 | 81 | 42182 | 383.91 | 567 | 552 | 108.4 |
| B | 5 | 255 | 38793 | 352.66 | 567 | 552 | 108.4 |
| B | 0 | 190 | 23234 | 209.17 | 567 | 552 | 108.4 |
| C | 0 | 10 | 699513 | 5517.75 | 545 | 548 | 126.7 |
| C | 15 | 214 | 202326 | 1592.87 | 545 | 548 | 126.7 |
| C | 15 | 111 | 17872 | 136.76 | 545 | 548 | 126.7 |
| D | 1 | 47 | 338609 | 2481.02 | 561 | 547 | 136.3 |
| D | 1 | 52 | 246233 | 1803.08 | 561 | 547 | 136.3 |
| D | 13 | 249 | 169228 | 1237.94 | 561 | 547 | 136.3 |
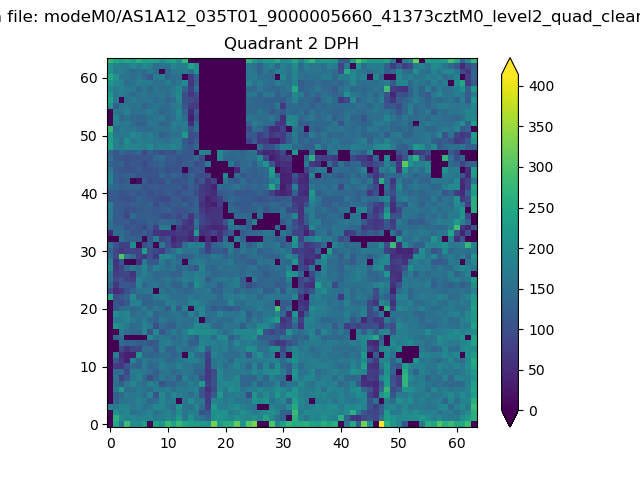
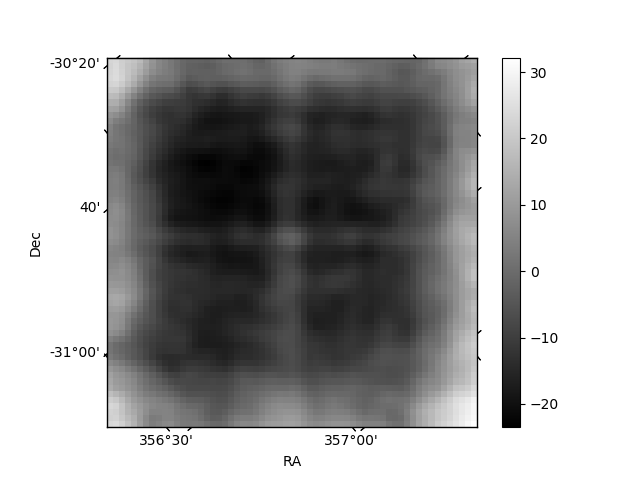
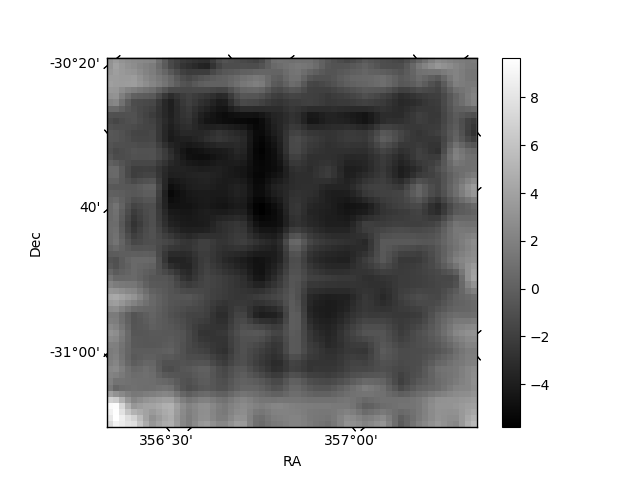
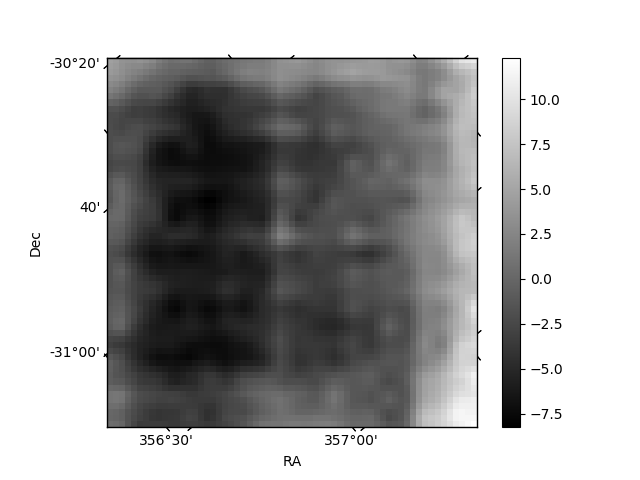
Histogram calculated using DETX and DETY for each event in the final _common_clean file
| Quadrant A | 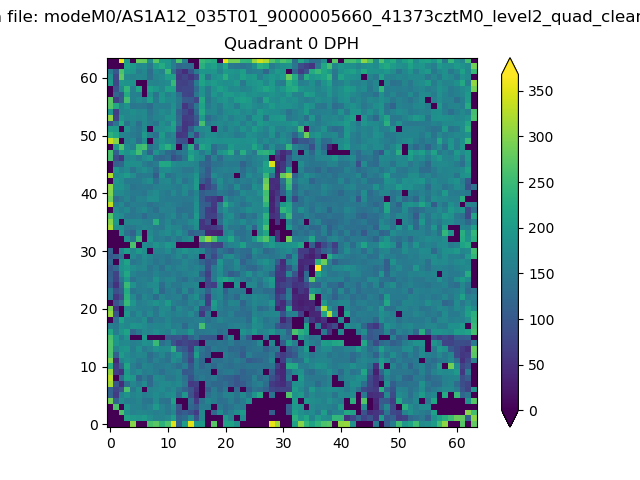 |
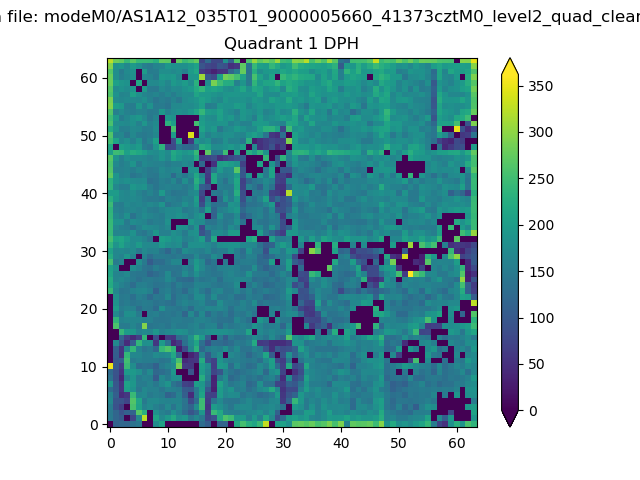 |
Quadrant B |
|---|---|---|---|
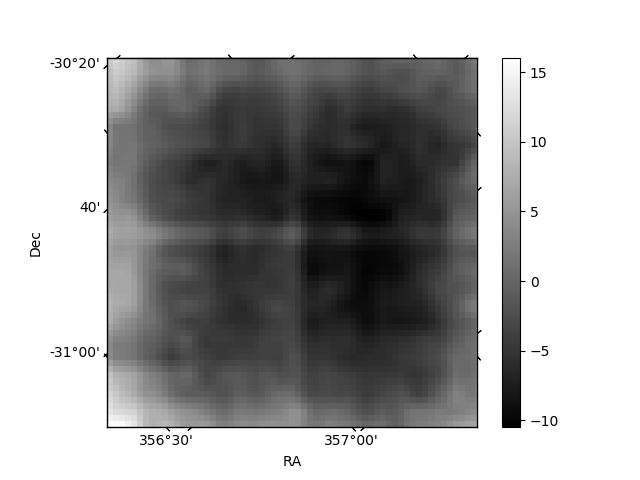
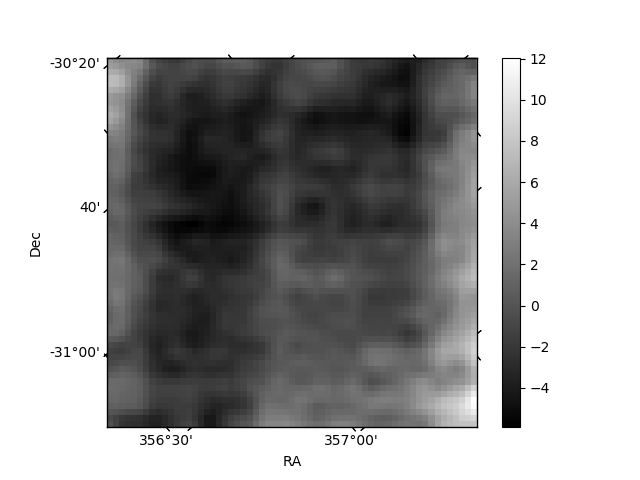
| Quadrant D | 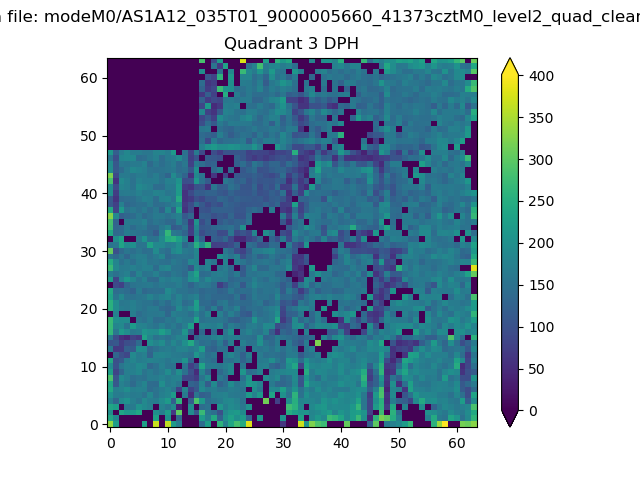 |
 |
Quadrant C |
| Plot type | Count rate plots | Images |
|---|---|---|
| Comparison with Poisson distribution Blue bars denote a histogram of data divided into 1 sec bins. Red curve is a Poisson curve with rate = median count rate of data. |
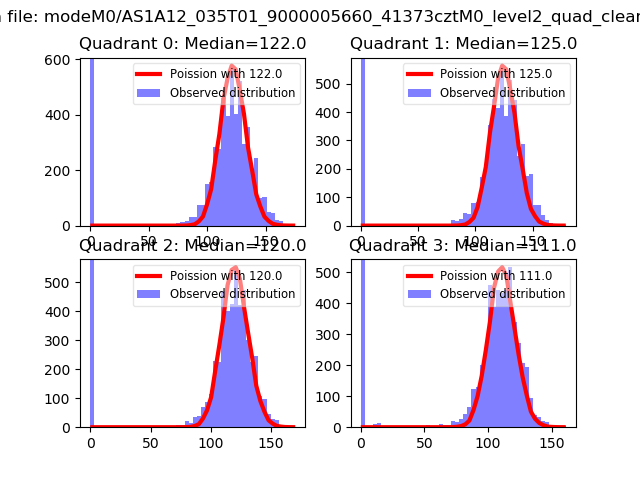 |
 |
| Quadrant-wise count rates Data is divided into 100 sec bins |
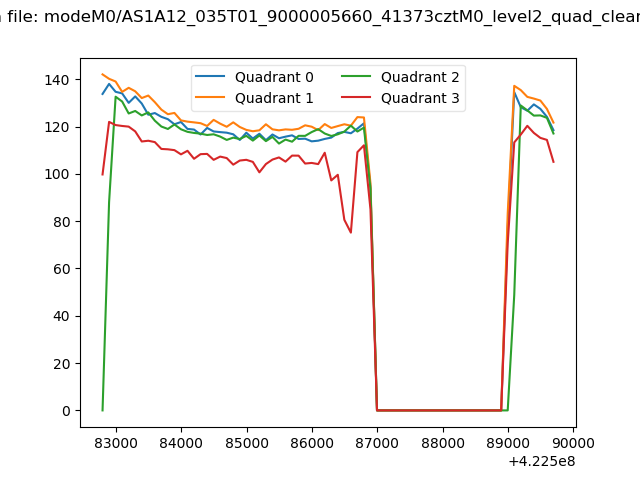 |
|
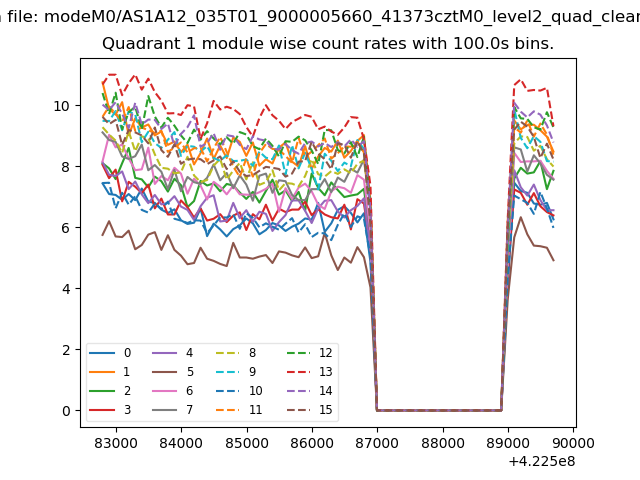
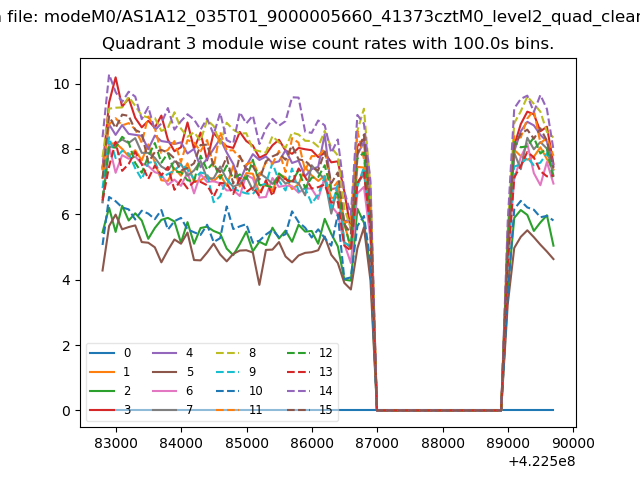
| Module-wise count rates for Quadrant A Data is divided into 100 sec bins |
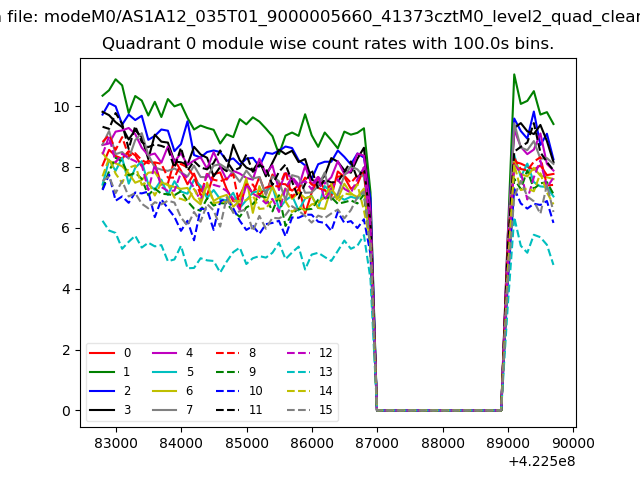 |
 |
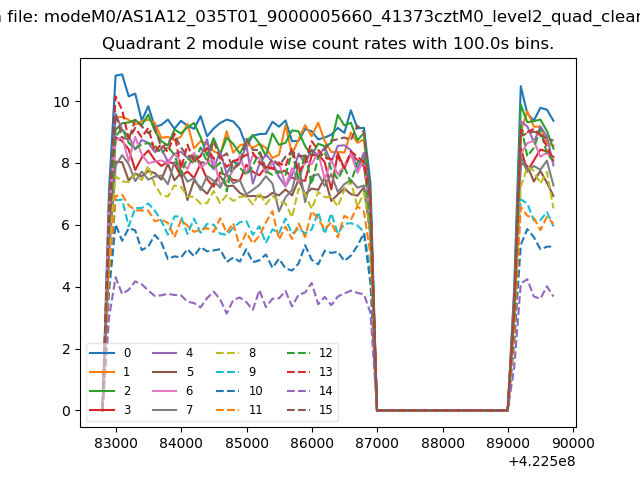
| Module-wise count rates for Quadrant B Data is divided into 100 sec bins |
 |
 |
| Module-wise count rates for Quadrant C Data is divided into 100 sec bins |
 |
 |
| Module-wise count rates for Quadrant D Data is divided into 100 sec bins |
 |
 |
| Parameter | Plot |
|---|---|
| CZT HV Monitor | 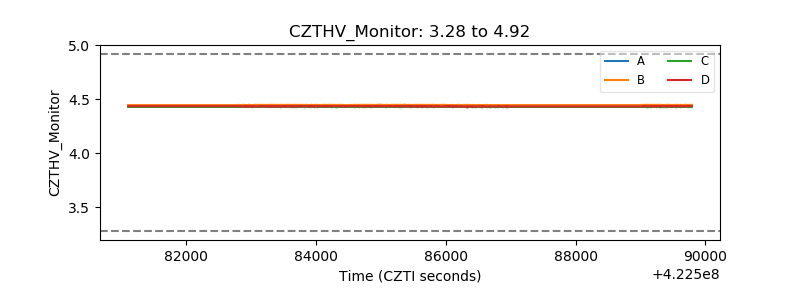 |
| D_VDD | 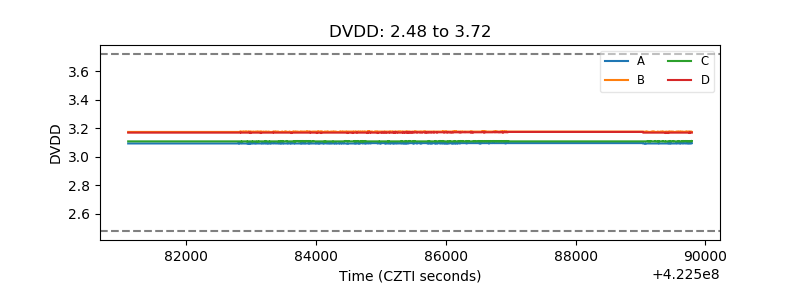 |
| Temperature 1 | 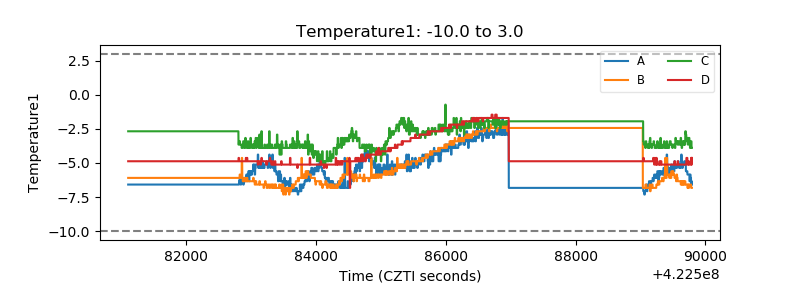 |
| Veto HV Monitor | 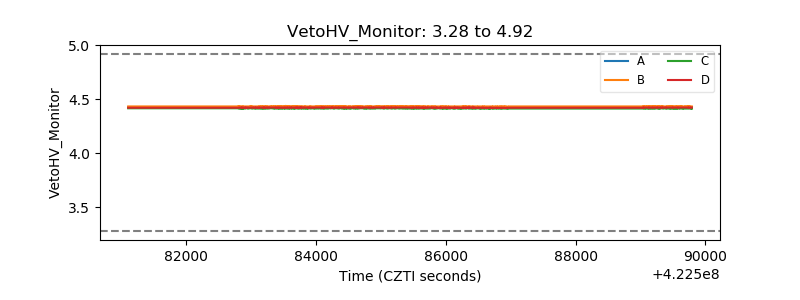 |
| Veto LLD | 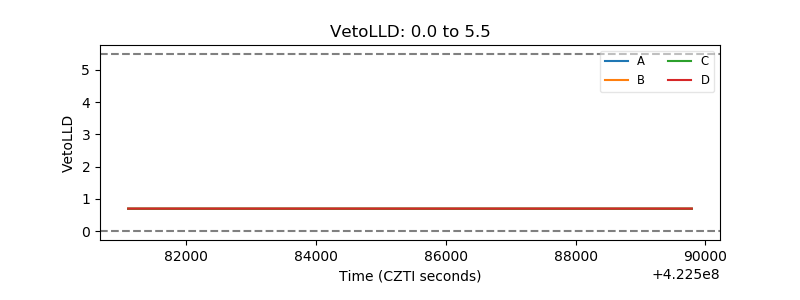 |
| Alpha Counter | 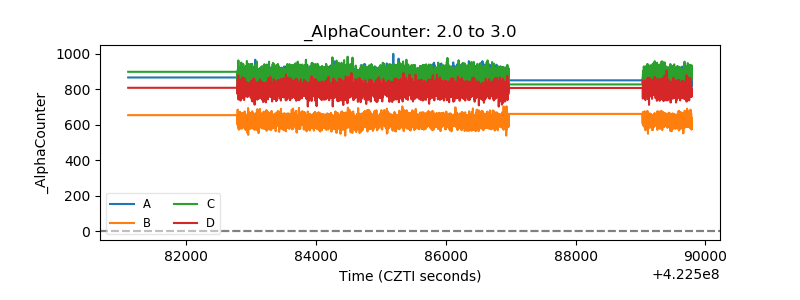 |
| _CPM_Rate | 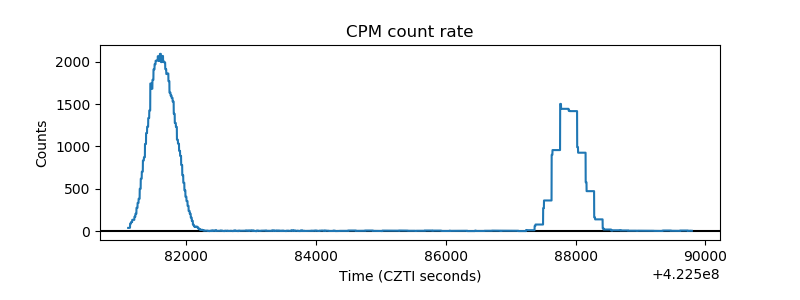 |
| CZT Counter | 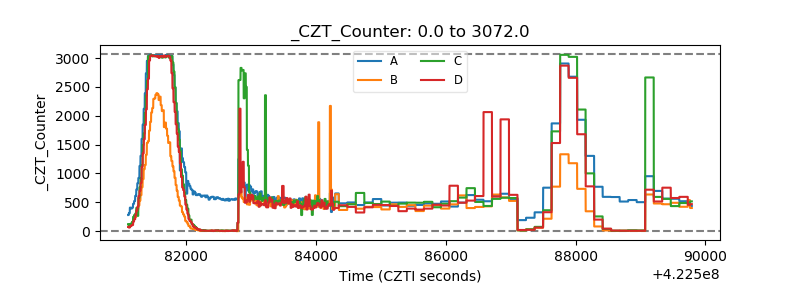 |
| +2.5 Volts monitor |  |
| +5 Volts monitor | 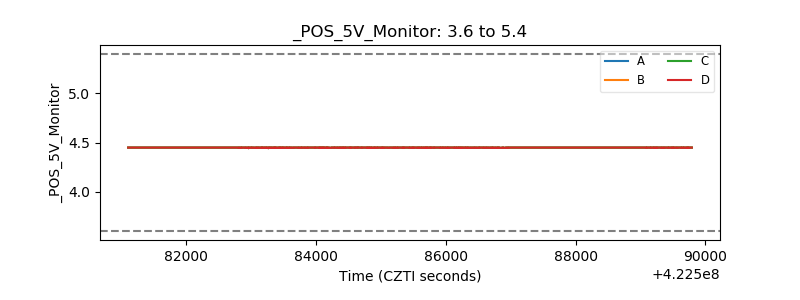 |
| _ROLL_ROT | 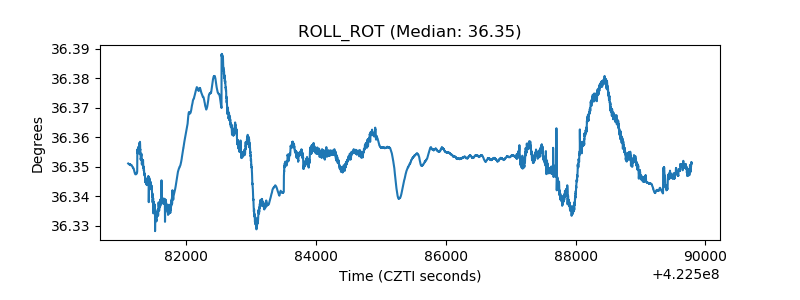 |
| _Roll_DEC | 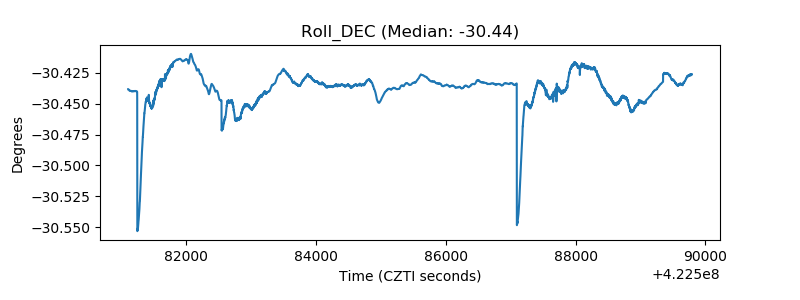 |
| _Roll_RA | 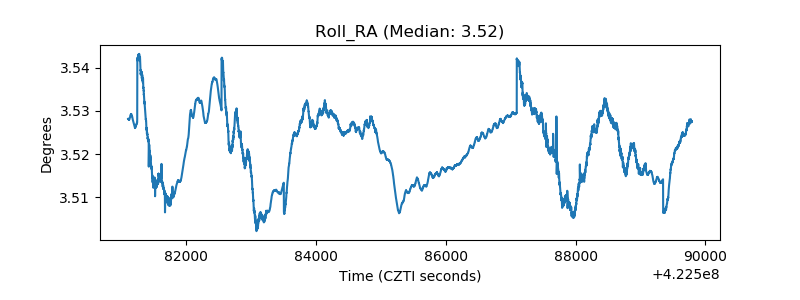 |
| Veto Counter | 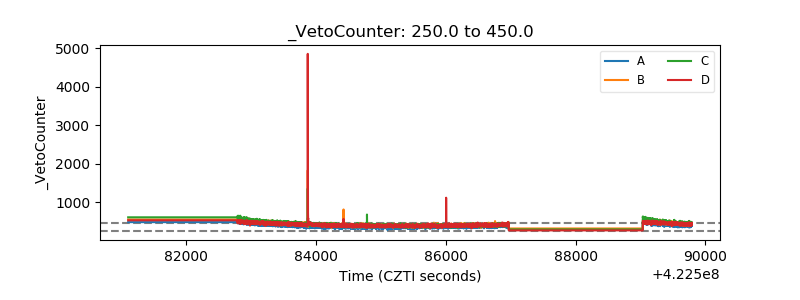 |