| Param | Original file | Final file |
|---|---|---|
| Filename | modeM0/AS1A12_035T01_9000005660_41374cztM0_level2.fits | modeM0/AS1A12_035T01_9000005660_41374cztM0_level2_quad_clean.evt |
| Size (bytes) | 351,826,560 | 95,348,160 |
| Size | 335.5 MB | 90.9 MB |
| Events in quadrant A | 2,939,641 | 644,623 |
| Events in quadrant B | 2,583,730 | 667,778 |
| Events in quadrant C | 3,377,698 | 613,866 |
| Events in quadrant D | 3,696,068 | 578,391 |
| Mode M0 | |||
|---|---|---|---|
| Quadrant | BADHDUFLAG | Total packets | Discarded packets |
| A | 0 | 12010 | 3 |
| B | 0 | 11308 | 2 |
| C | 0 | 13243 | 2 |
| D | 0 | 14645 | 2 |
| Mode SS | |||
|---|---|---|---|
| Quadrant | BADHDUFLAG | Total packets | Discarded packets |
| A | 0 | 112 | 0 |
| B | 0 | 112 | 0 |
| C | 0 | 112 | 0 |
| D | 0 | 112 | 0 |
| Mode M9 | |||
|---|---|---|---|
| Quadrant | BADHDUFLAG | Total packets | Discarded packets |
| A | 0 | 42 | 0 |
| B | 0 | 42 | 0 |
| C | 0 | 42 | 0 |
| D | 0 | 42 | 0 |
| Quadrant | Total seconds | Saturated seconds | Saturation percentage |
|---|---|---|---|
| A | 5475 | 12 | 0.219178% |
| B | 5475 | 8 | 0.146119% |
| C | 5475 | 250 | 4.566210% |
| D | 5475 | 192 | 3.506849% |
Noise dominated data is calculated using 1-second bins in cleaned event files. If a bin has >2000 counts, and if more than 50% of those come from <1% of pixels, then it is considered to be noise-dominated and hence unusable.
| Quadrant | # 1 sec bins | Bins with >0 counts | Bins with >2000 counts | High rate bins dominated by noise | Noise dominated (total time) | Noise dominated (detector-on time) | Marked lightcurve |
|---|---|---|---|---|---|---|---|
| A | 9660 | 5477 | 5 | 5 | 0.05% | 0.09% | 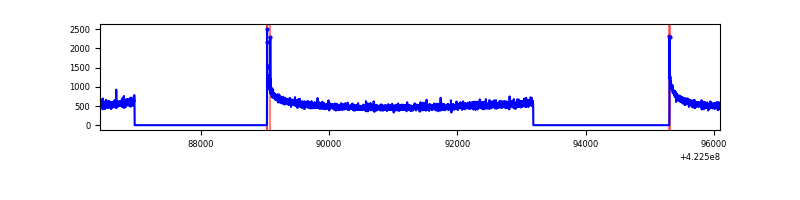 |
| B | 9660 | 5477 | 4 | 4 | 0.04% | 0.07% | 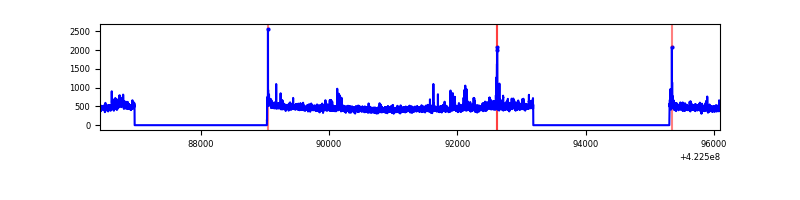 |
| C | 9660 | 5477 | 246 | 246 | 2.55% | 4.49% | 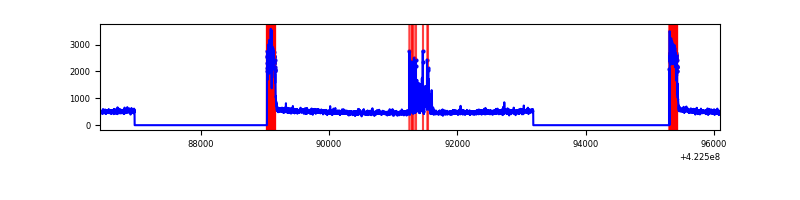 |
| D | 9660 | 5477 | 176 | 176 | 1.82% | 3.21% | 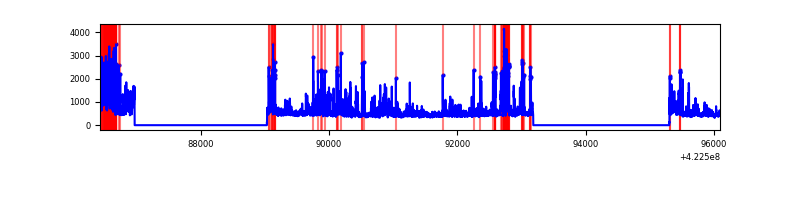 |
Top three noisy pixels from each quadrant. If the there are fewer than three noisy pixels in the level2.evt file, extra rows are filled as -1
| Pixel properties | Quadrant properties | ||||||
|---|---|---|---|---|---|---|---|
| Quadrant | DetID | PixID | Counts | Sigma | Mean | Median | Sigma |
| A | 10 | 83 | 509020 | 3956.25 | 625 | 612 | 128.5 |
| A | 12 | 189 | 9596 | 69.91 | 625 | 612 | 128.5 |
| A | 13 | 254 | 7876 | 56.53 | 625 | 612 | 128.5 |
| B | 0 | 190 | 69572 | 573.83 | 622 | 604 | 120.2 |
| B | 5 | 255 | 31040 | 253.23 | 622 | 604 | 120.2 |
| B | 4 | 81 | 26005 | 211.34 | 622 | 604 | 120.2 |
| C | 0 | 10 | 643593 | 4605.67 | 600 | 605 | 139.6 |
| C | 15 | 214 | 226522 | 1618.22 | 600 | 605 | 139.6 |
| C | 2 | 16 | 167167 | 1193.07 | 600 | 605 | 139.6 |
| D | 1 | 47 | 500822 | 3378.05 | 613 | 598 | 148.1 |
| D | 13 | 249 | 369219 | 2489.33 | 613 | 598 | 148.1 |
| D | 1 | 52 | 325602 | 2194.78 | 613 | 598 | 148.1 |
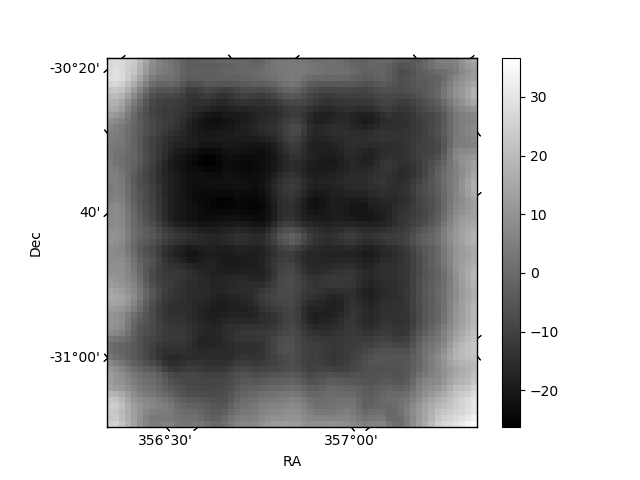
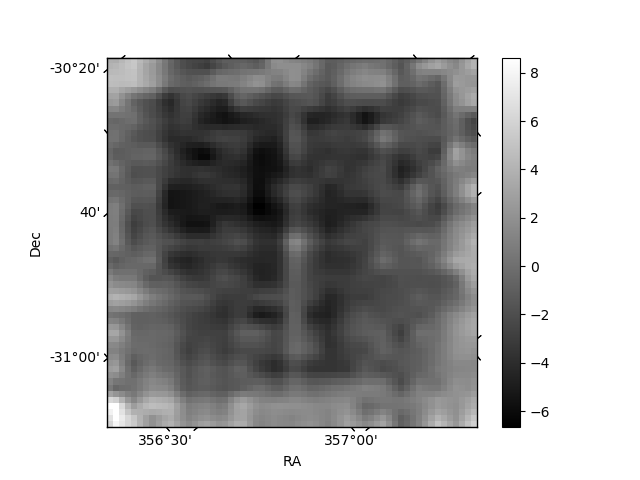
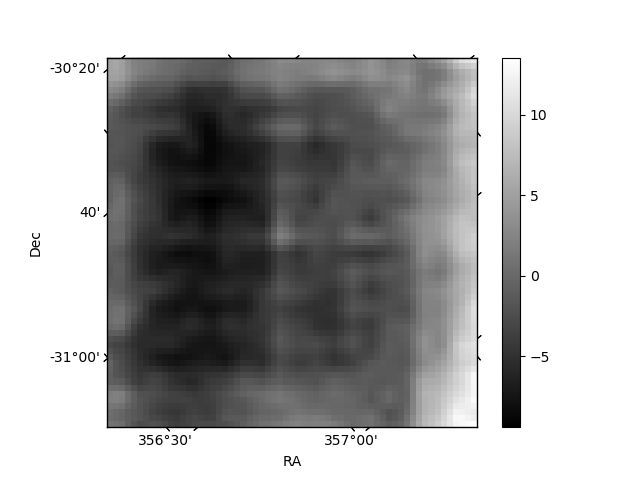
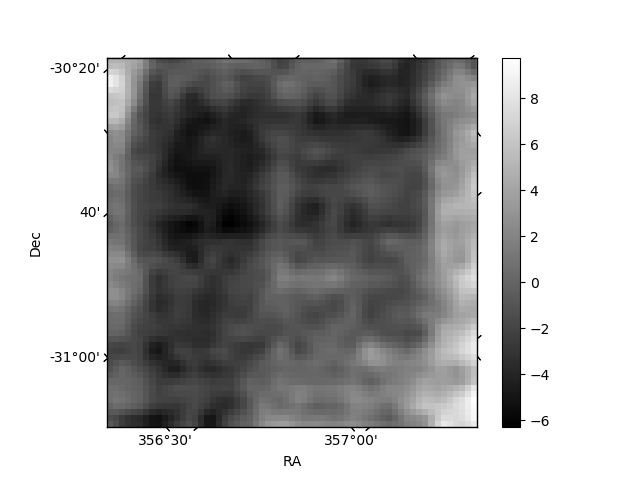
Histogram calculated using DETX and DETY for each event in the final _common_clean file
| Quadrant A | 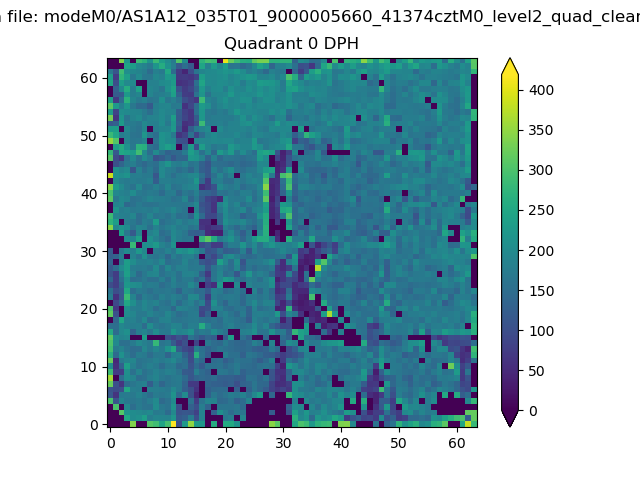 |
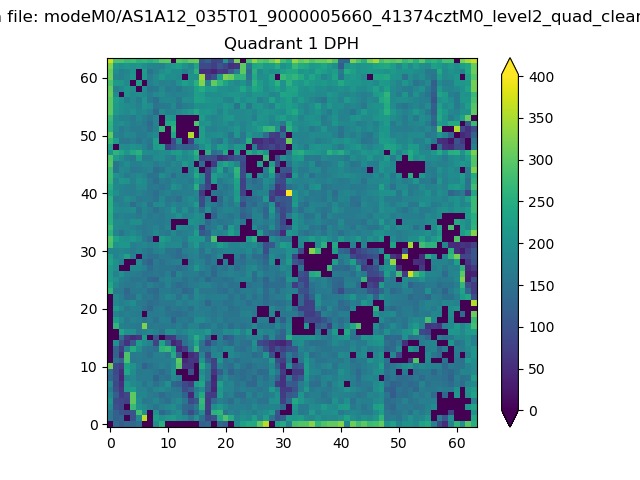 |
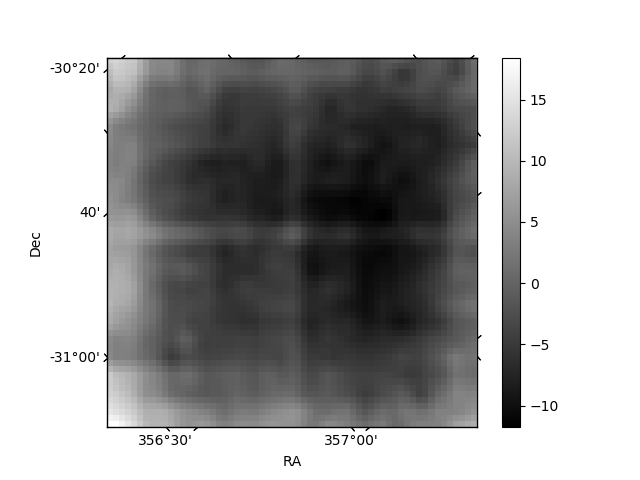
Quadrant B |
|---|---|---|---|
| Quadrant D | 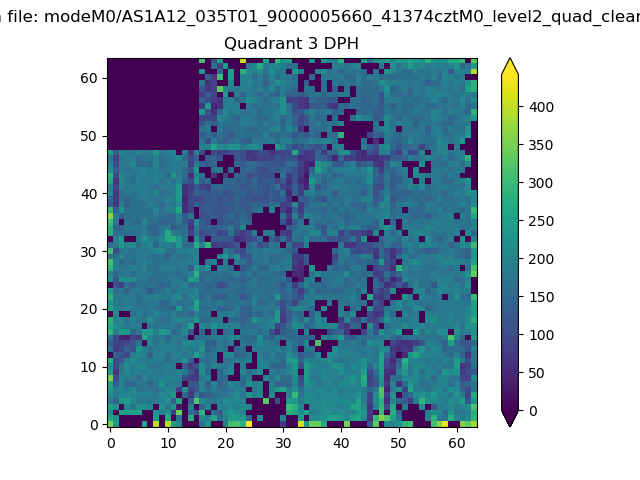 |
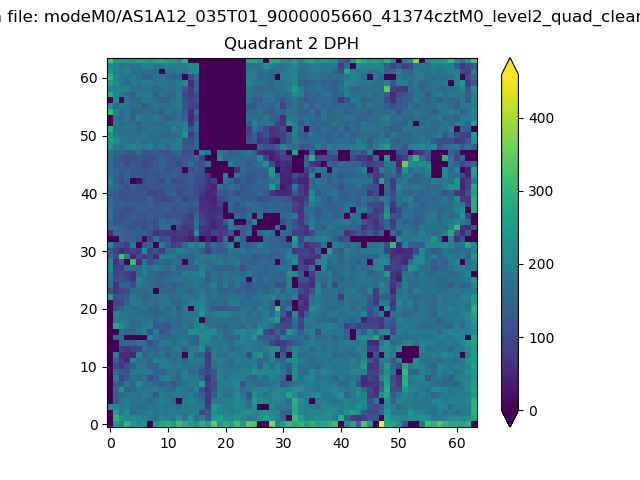 |
Quadrant C |
| Plot type | Count rate plots | Images |
|---|---|---|
| Comparison with Poisson distribution Blue bars denote a histogram of data divided into 1 sec bins. Red curve is a Poisson curve with rate = median count rate of data. |
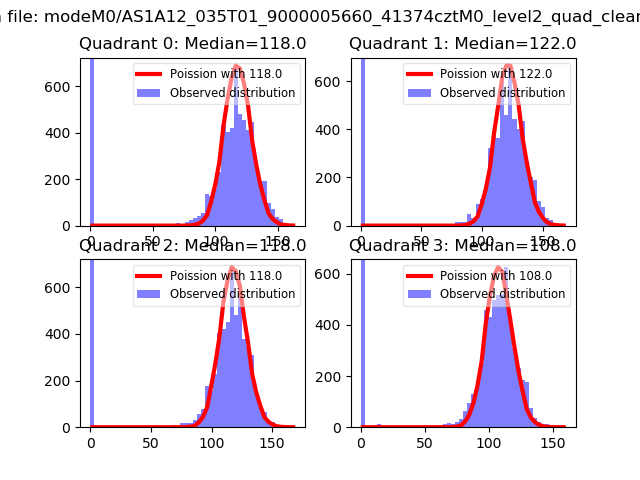 |
 |
| Quadrant-wise count rates Data is divided into 100 sec bins |
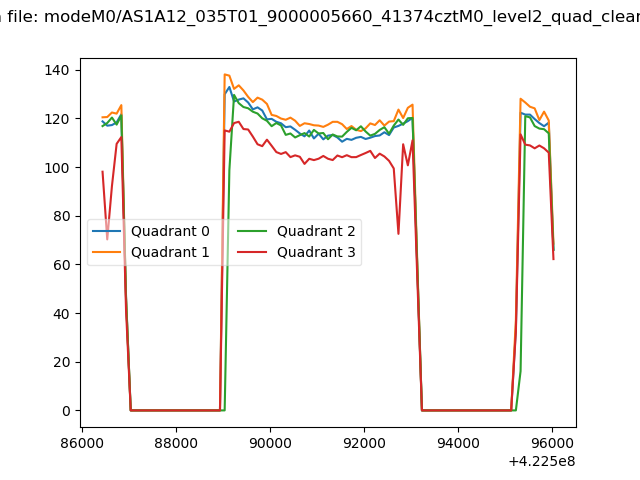 |
|
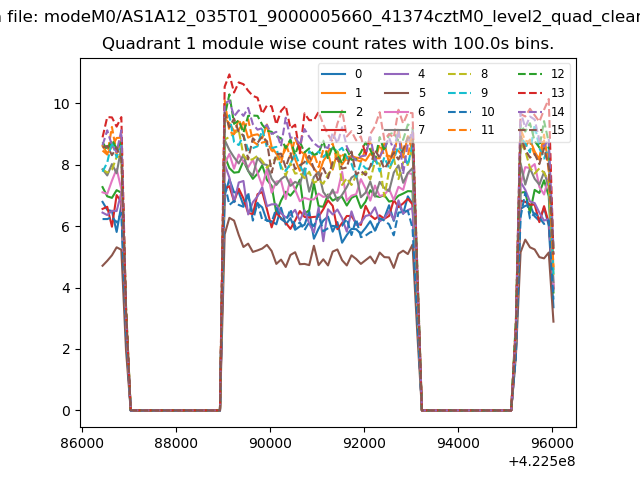
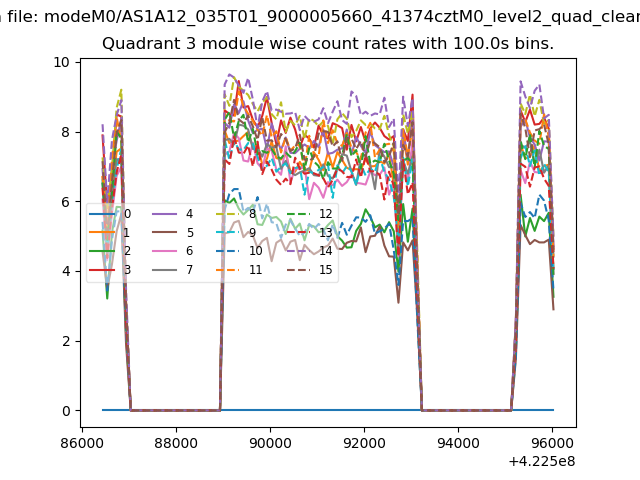
| Module-wise count rates for Quadrant A Data is divided into 100 sec bins |
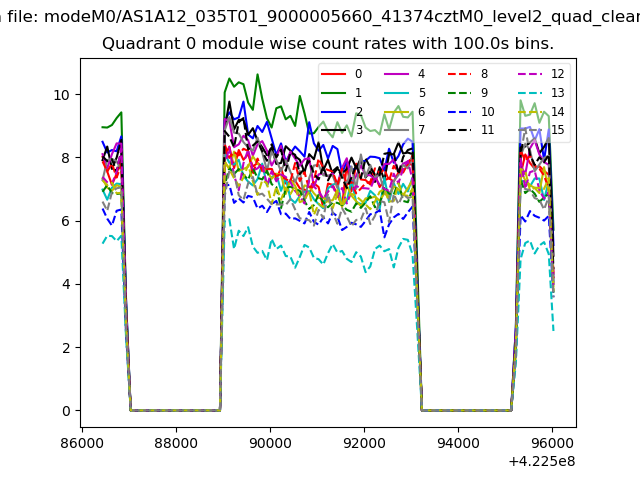 |
 |
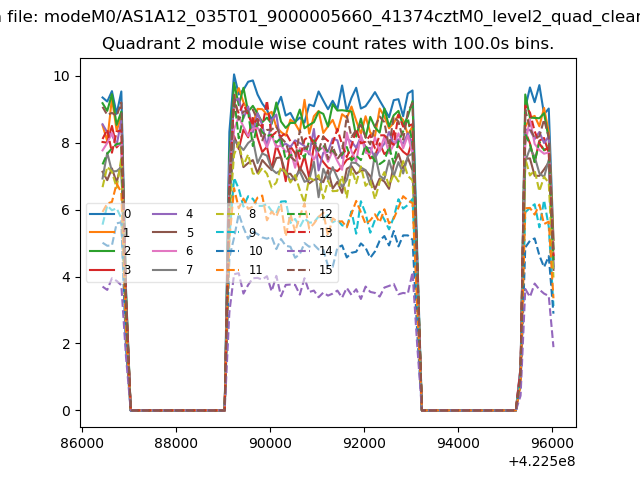
| Module-wise count rates for Quadrant B Data is divided into 100 sec bins |
 |
 |
| Module-wise count rates for Quadrant C Data is divided into 100 sec bins |
 |
 |
| Module-wise count rates for Quadrant D Data is divided into 100 sec bins |
 |
 |
| Parameter | Plot |
|---|---|
| CZT HV Monitor | 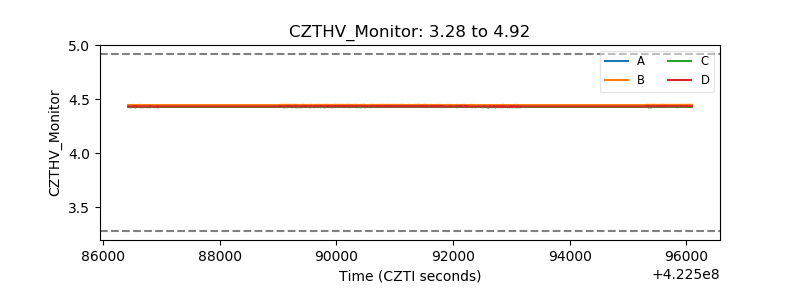 |
| D_VDD | 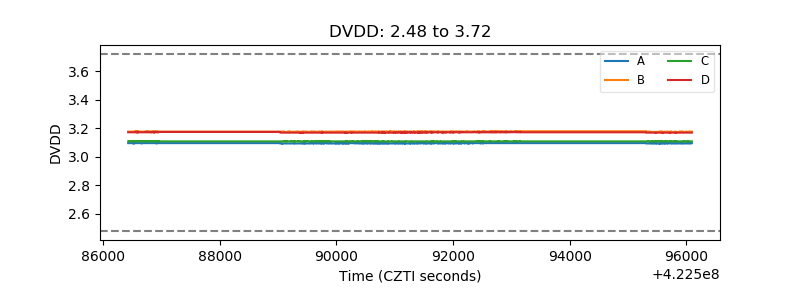 |
| Temperature 1 | 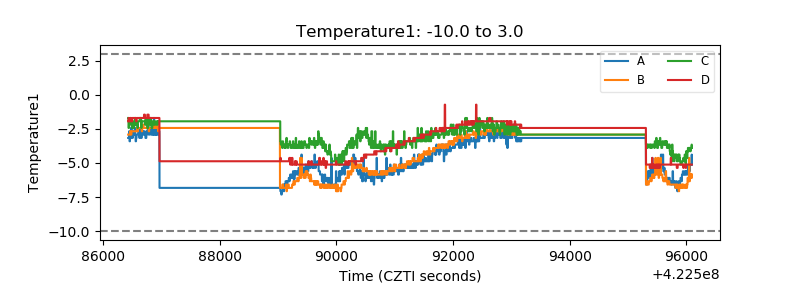 |
| Veto HV Monitor | 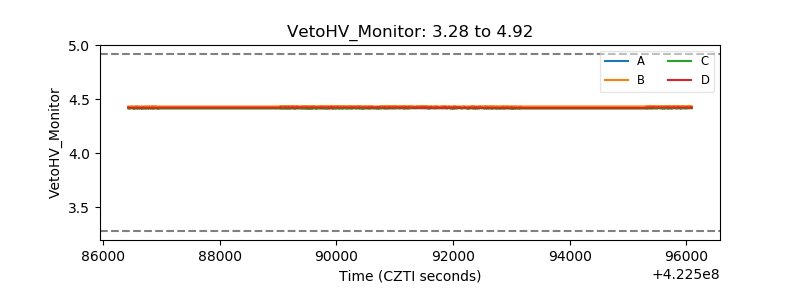 |
| Veto LLD | 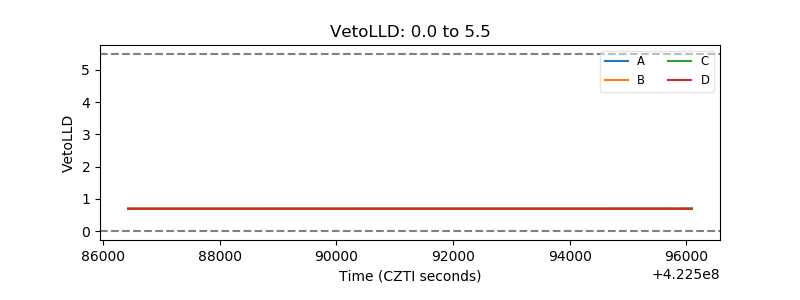 |
| Alpha Counter | 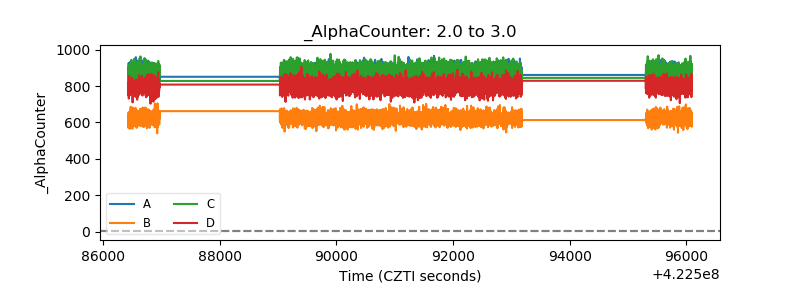 |
| _CPM_Rate | 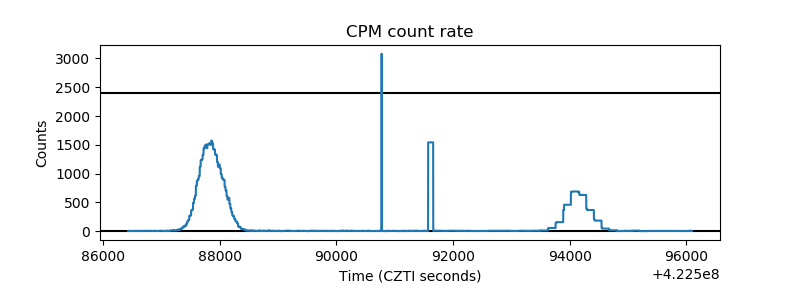 |
| CZT Counter | 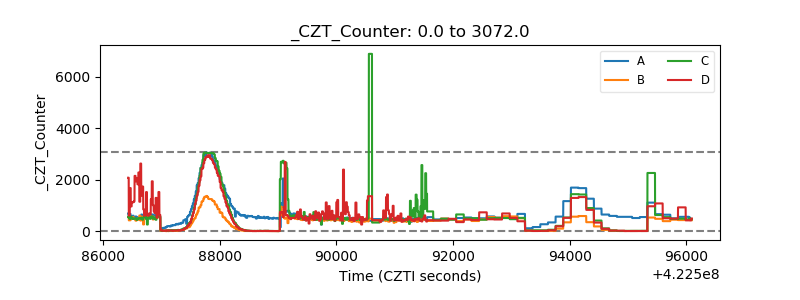 |
| +2.5 Volts monitor | 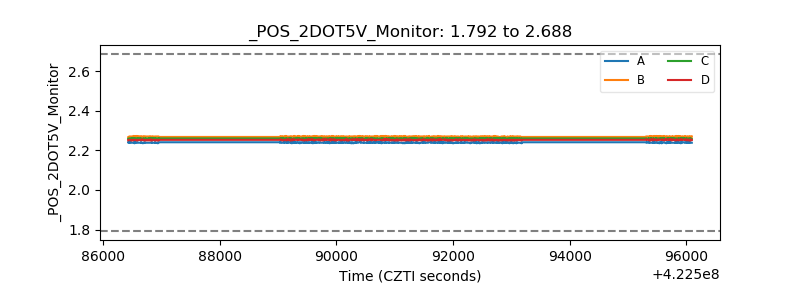 |
| +5 Volts monitor | 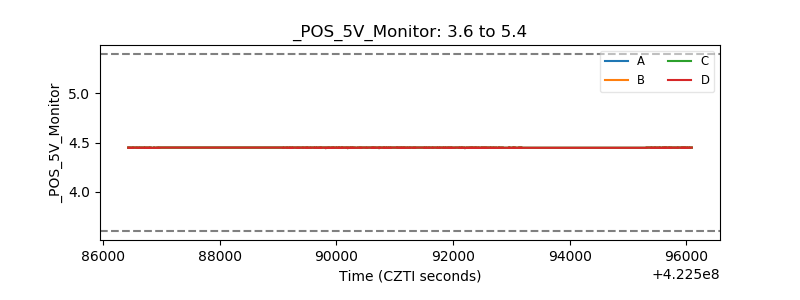 |
| _ROLL_ROT | 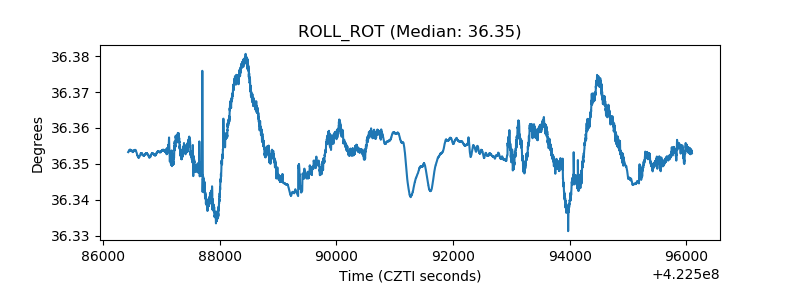 |
| _Roll_DEC | 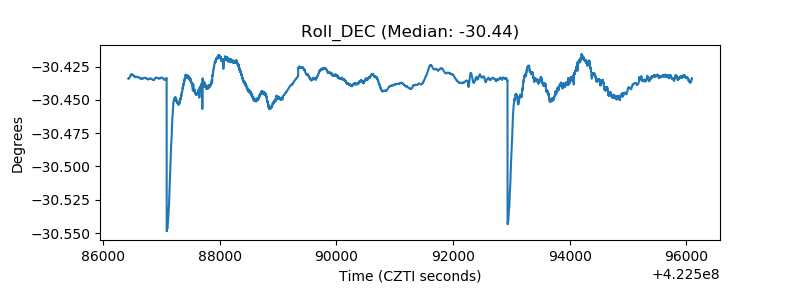 |
| _Roll_RA | 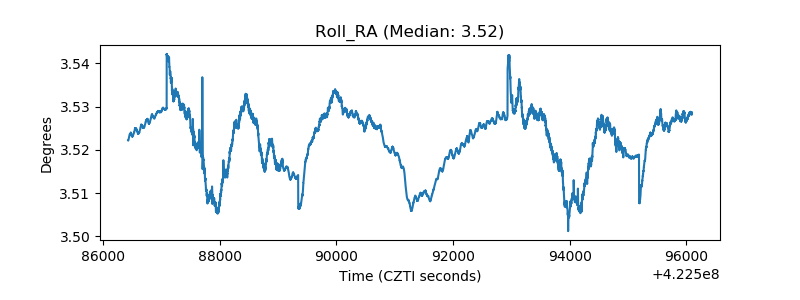 |
| Veto Counter | 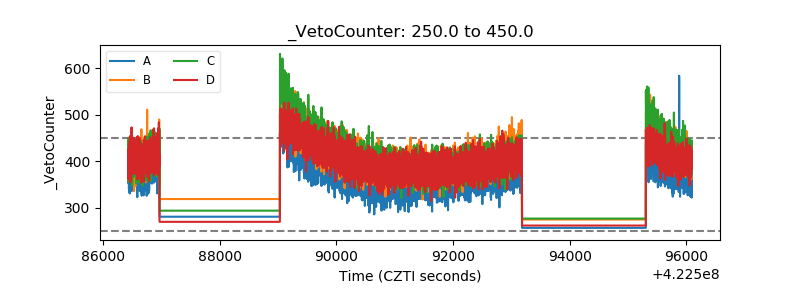 |