| Param | Original file | Final file |
|---|---|---|
| Filename | modeM0/AS1A12_035T01_9000005660_41375cztM0_level2.fits | modeM0/AS1A12_035T01_9000005660_41375cztM0_level2_quad_clean.evt |
| Size (bytes) | 328,628,160 | 81,371,520 |
| Size | 313.4 MB | 77.6 MB |
| Events in quadrant A | 2,606,965 | 554,112 |
| Events in quadrant B | 2,220,935 | 569,234 |
| Events in quadrant C | 2,861,008 | 524,131 |
| Events in quadrant D | 4,092,916 | 472,023 |
| Mode M0 | |||
|---|---|---|---|
| Quadrant | BADHDUFLAG | Total packets | Discarded packets |
| A | 0 | 10709 | 3 |
| B | 0 | 10032 | 2 |
| C | 0 | 11531 | 2 |
| D | 0 | 15594 | 2 |
| Mode SS | |||
|---|---|---|---|
| Quadrant | BADHDUFLAG | Total packets | Discarded packets |
| A | 0 | 100 | 0 |
| B | 0 | 100 | 0 |
| C | 0 | 100 | 0 |
| D | 0 | 100 | 0 |
| Mode M9 | |||
|---|---|---|---|
| Quadrant | BADHDUFLAG | Total packets | Discarded packets |
| A | 0 | 39 | 0 |
| B | 0 | 39 | 0 |
| C | 0 | 39 | 0 |
| D | 0 | 40 | 0 |
| Quadrant | Total seconds | Saturated seconds | Saturation percentage |
|---|---|---|---|
| A | 4911 | 8 | 0.162900% |
| B | 4911 | 10 | 0.203625% |
| C | 4911 | 239 | 4.866626% |
| D | 4911 | 437 | 8.898391% |
Noise dominated data is calculated using 1-second bins in cleaned event files. If a bin has >2000 counts, and if more than 50% of those come from <1% of pixels, then it is considered to be noise-dominated and hence unusable.
| Quadrant | # 1 sec bins | Bins with >0 counts | Bins with >2000 counts | High rate bins dominated by noise | Noise dominated (total time) | Noise dominated (detector-on time) | Marked lightcurve |
|---|---|---|---|---|---|---|---|
| A | 7004 | 4912 | 4 | 4 | 0.06% | 0.08% | 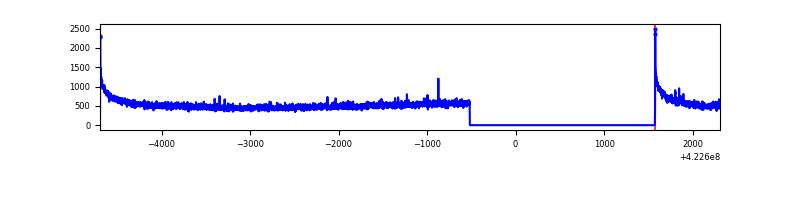 |
| B | 7004 | 4912 | 3 | 3 | 0.04% | 0.06% | 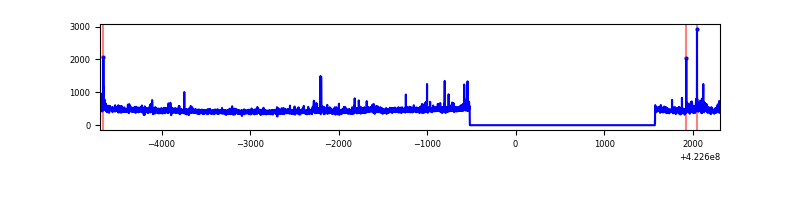 |
| C | 7004 | 4912 | 232 | 232 | 3.31% | 4.72% | 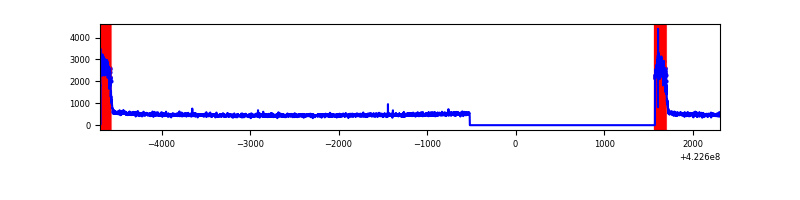 |
| D | 7004 | 4912 | 380 | 380 | 5.43% | 7.74% | 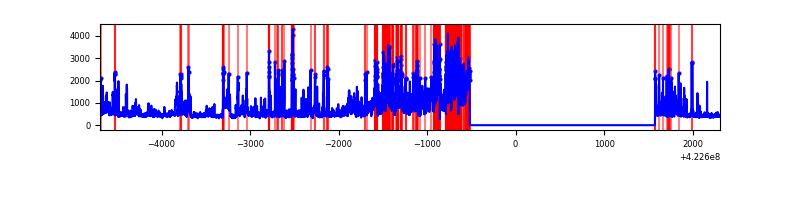 |
Top three noisy pixels from each quadrant. If the there are fewer than three noisy pixels in the level2.evt file, extra rows are filled as -1
| Pixel properties | Quadrant properties | ||||||
|---|---|---|---|---|---|---|---|
| Quadrant | DetID | PixID | Counts | Sigma | Mean | Median | Sigma |
| A | 10 | 83 | 486970 | 4323.77 | 542 | 531 | 112.5 |
| A | 12 | 189 | 15411 | 132.26 | 542 | 531 | 112.5 |
| A | 13 | 254 | 7151 | 58.84 | 542 | 531 | 112.5 |
| B | 0 | 190 | 52068 | 493.37 | 537 | 524 | 104.5 |
| B | 5 | 255 | 36966 | 348.82 | 537 | 524 | 104.5 |
| B | 12 | 111 | 13073 | 120.12 | 537 | 524 | 104.5 |
| C | 0 | 10 | 637045 | 5219.53 | 518 | 519 | 122.0 |
| C | 15 | 214 | 204844 | 1675.47 | 518 | 519 | 122.0 |
| C | 13 | 61 | 3349 | 23.21 | 518 | 519 | 122.0 |
| D | 13 | 249 | 960608 | 7666.99 | 513 | 499 | 125.2 |
| D | 1 | 47 | 474988 | 3789.05 | 513 | 499 | 125.2 |
| D | 1 | 52 | 295235 | 2353.63 | 513 | 499 | 125.2 |
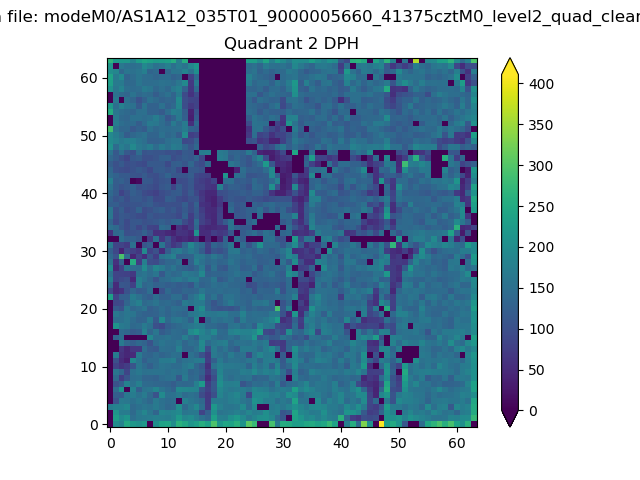
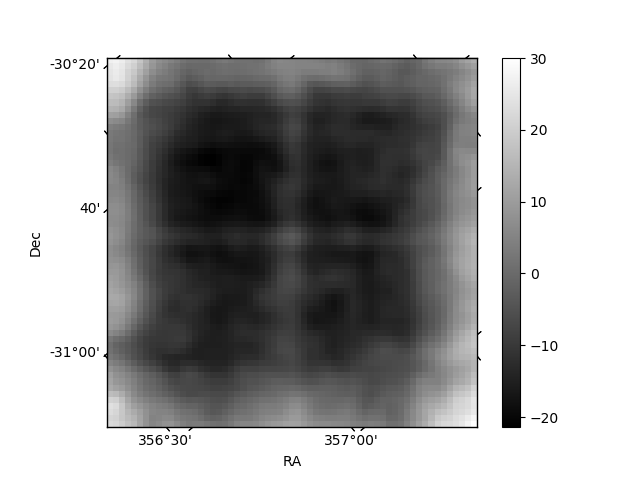
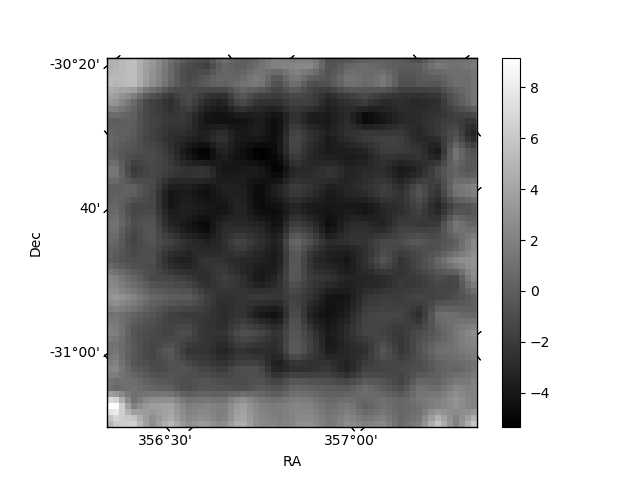
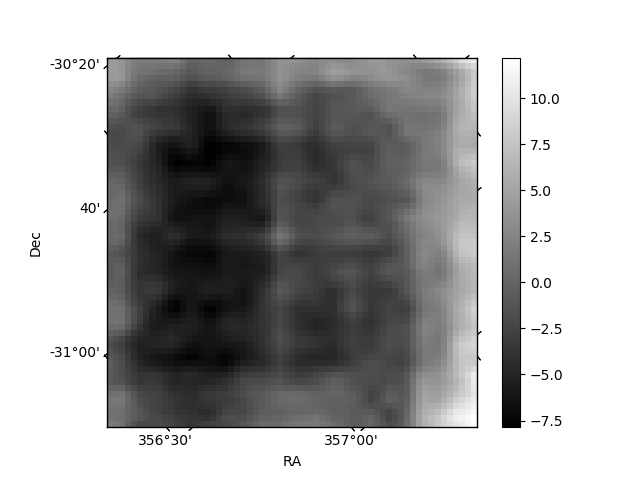
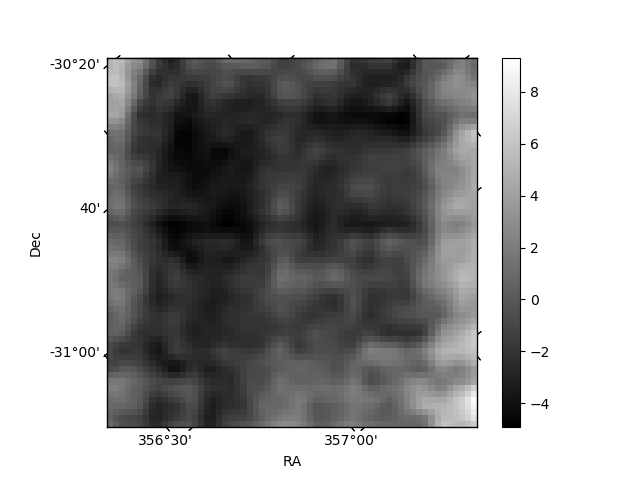
Histogram calculated using DETX and DETY for each event in the final _common_clean file
| Quadrant A | 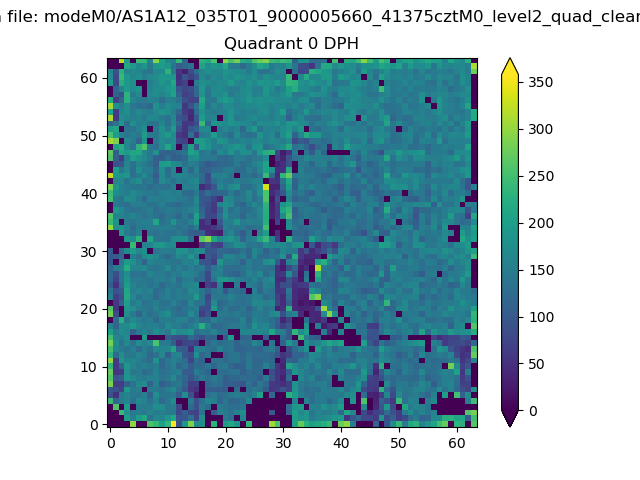 |
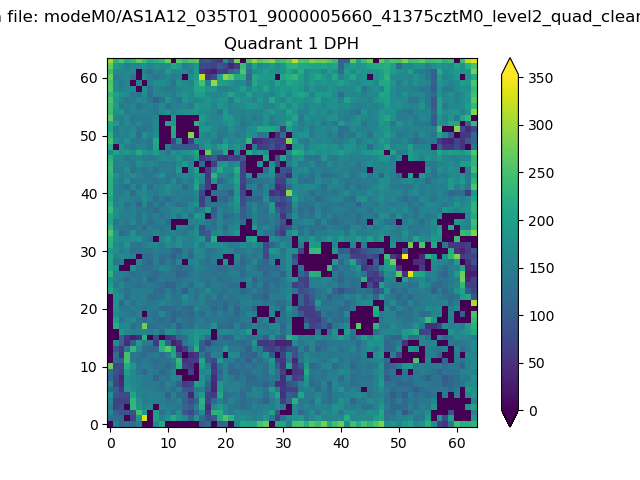 |
Quadrant B |
|---|---|---|---|
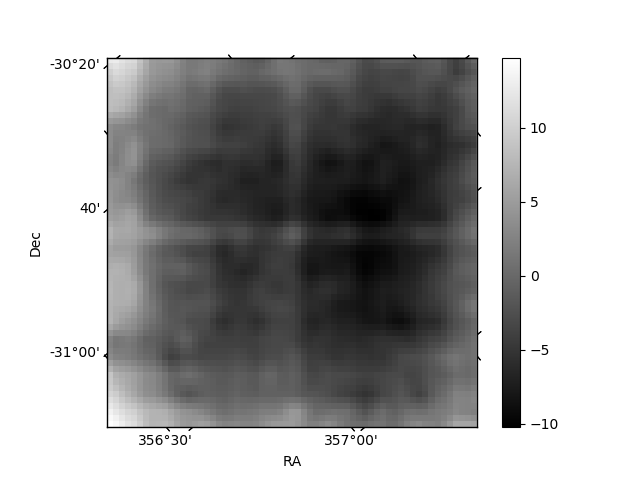
| Quadrant D | 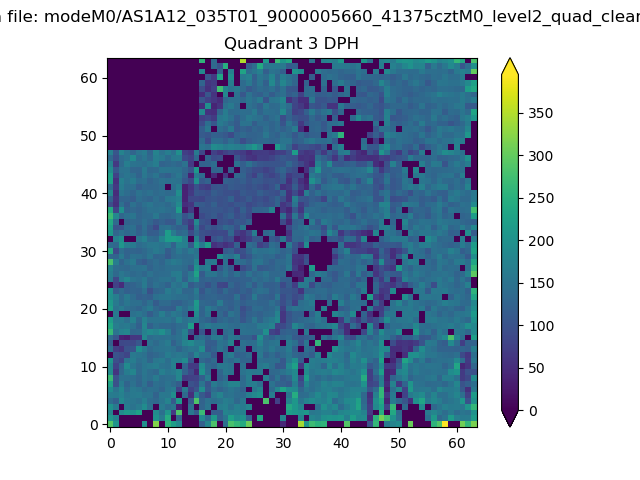 |
 |
Quadrant C |
| Plot type | Count rate plots | Images |
|---|---|---|
| Comparison with Poisson distribution Blue bars denote a histogram of data divided into 1 sec bins. Red curve is a Poisson curve with rate = median count rate of data. |
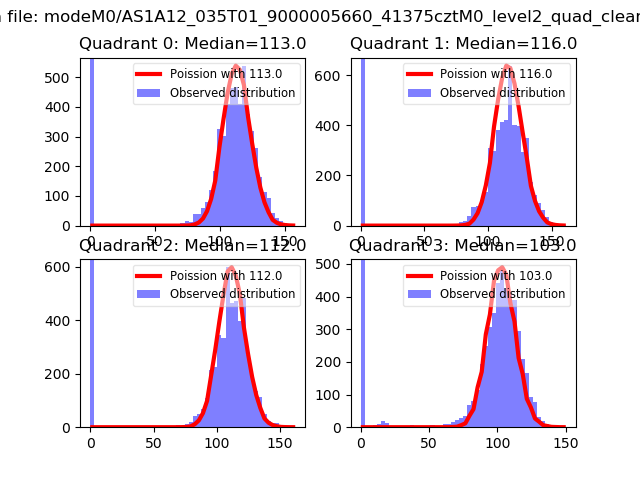 |
 |
| Quadrant-wise count rates Data is divided into 100 sec bins |
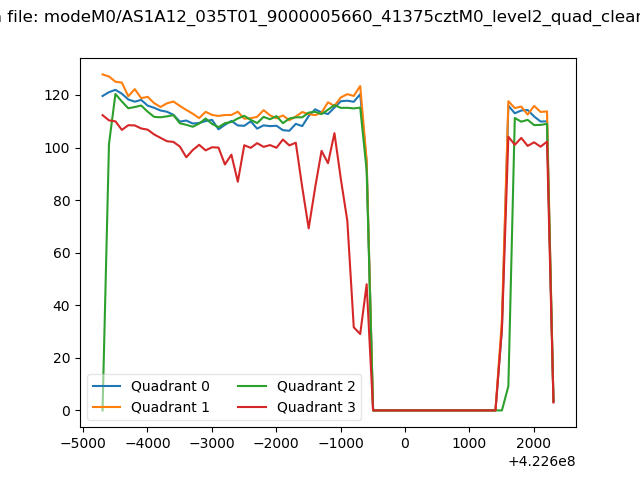 |
|
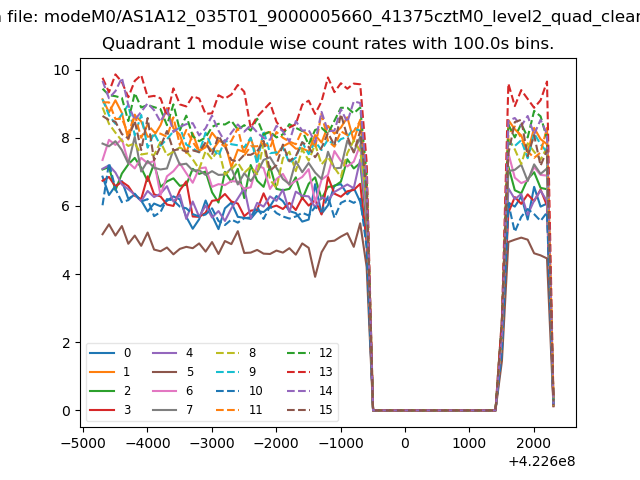
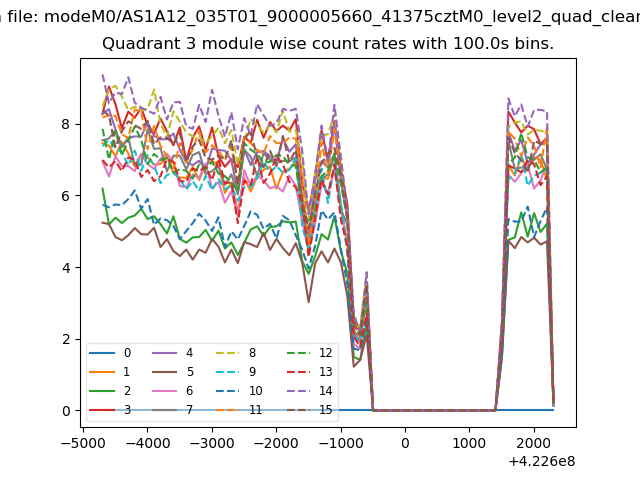
| Module-wise count rates for Quadrant A Data is divided into 100 sec bins |
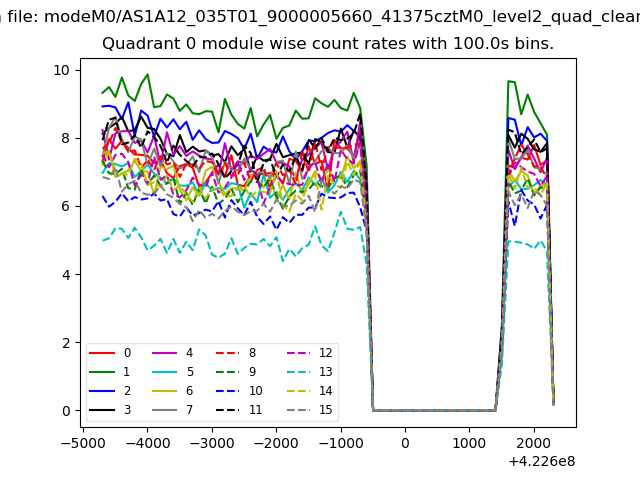 |
 |
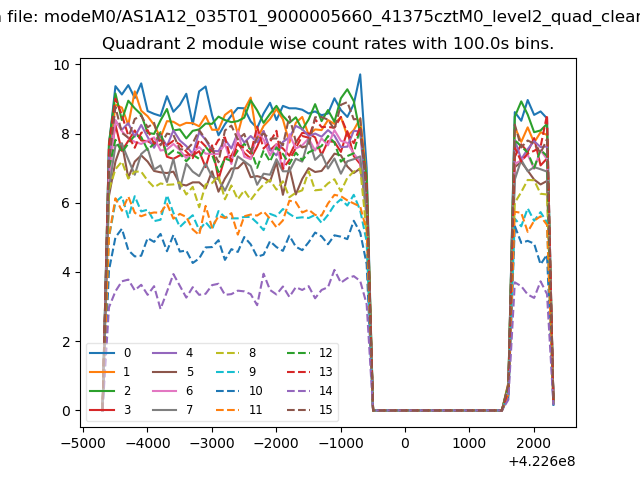
| Module-wise count rates for Quadrant B Data is divided into 100 sec bins |
 |
 |
| Module-wise count rates for Quadrant C Data is divided into 100 sec bins |
 |
 |
| Module-wise count rates for Quadrant D Data is divided into 100 sec bins |
 |
 |
| Parameter | Plot |
|---|---|
| CZT HV Monitor | 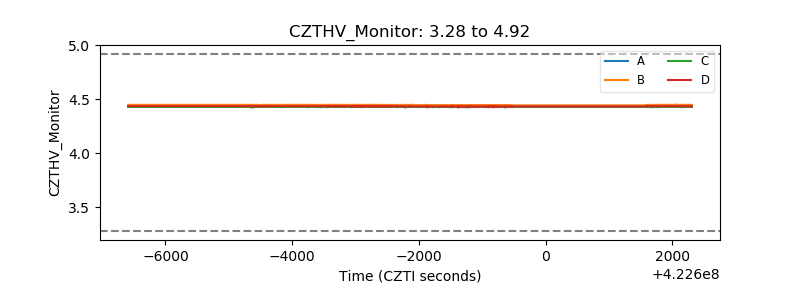 |
| D_VDD | 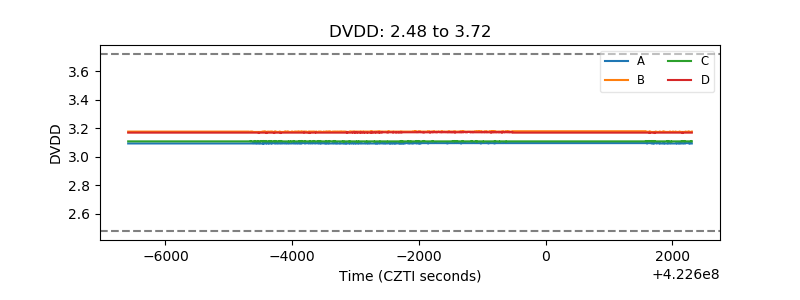 |
| Temperature 1 | 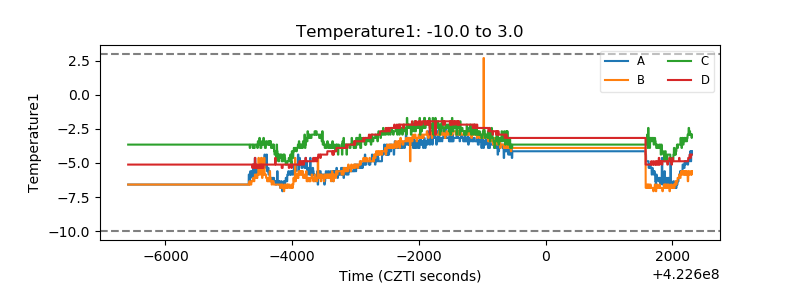 |
| Veto HV Monitor | 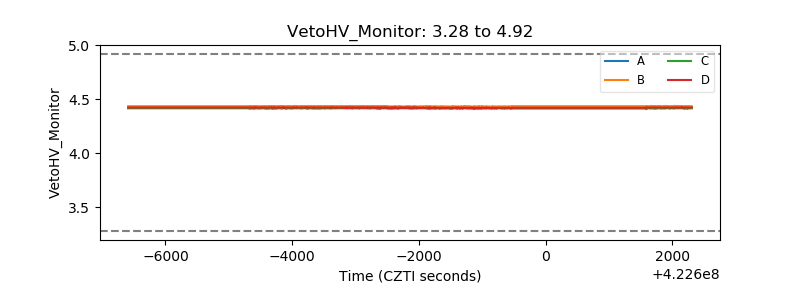 |
| Veto LLD | 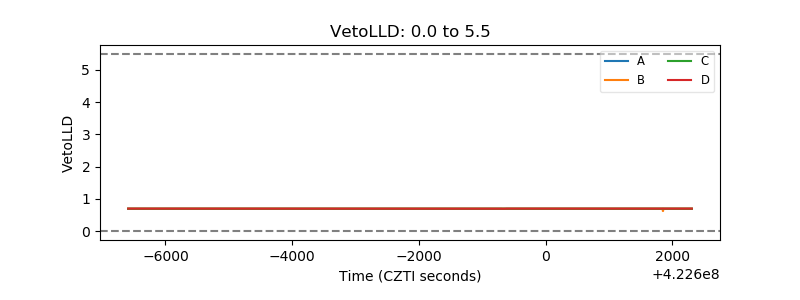 |
| Alpha Counter | 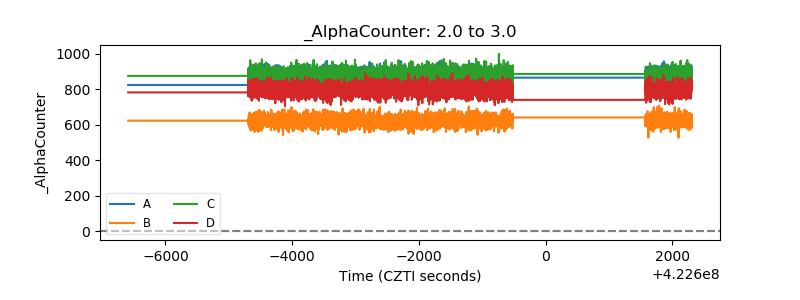 |
| _CPM_Rate | 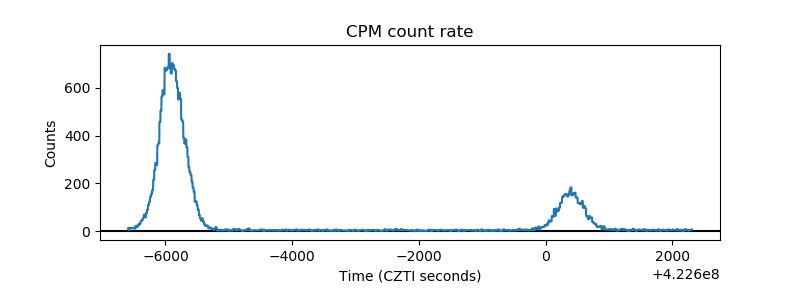 |
| CZT Counter | 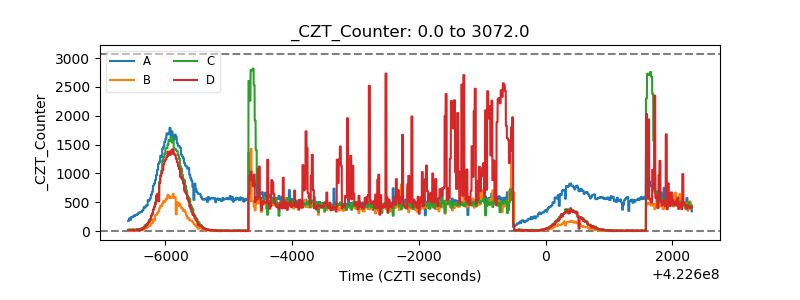 |
| +2.5 Volts monitor | 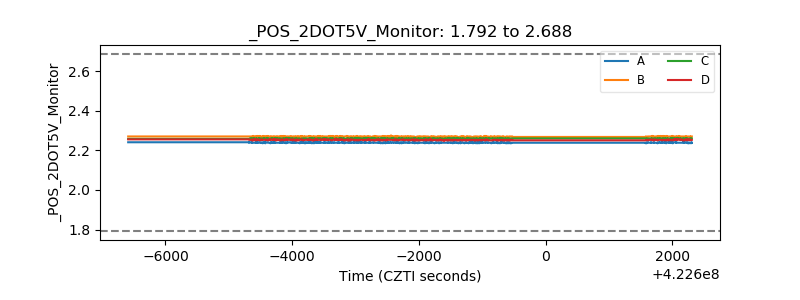 |
| +5 Volts monitor | 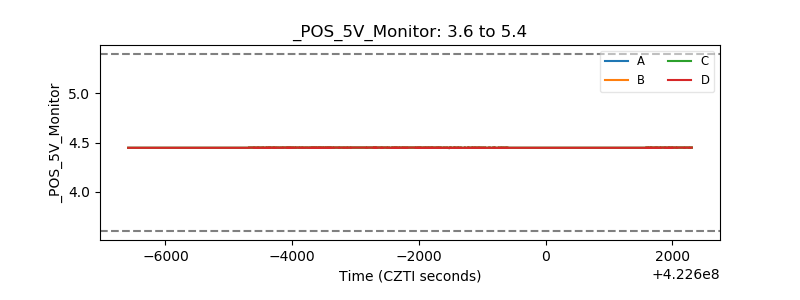 |
| _ROLL_ROT | 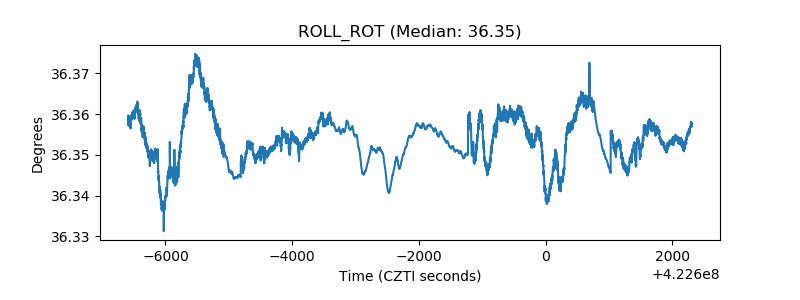 |
| _Roll_DEC | 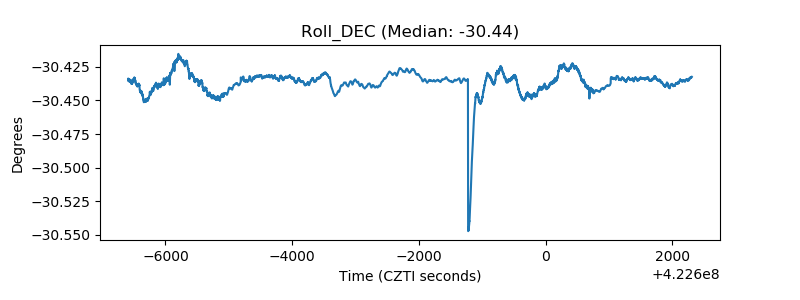 |
| _Roll_RA | 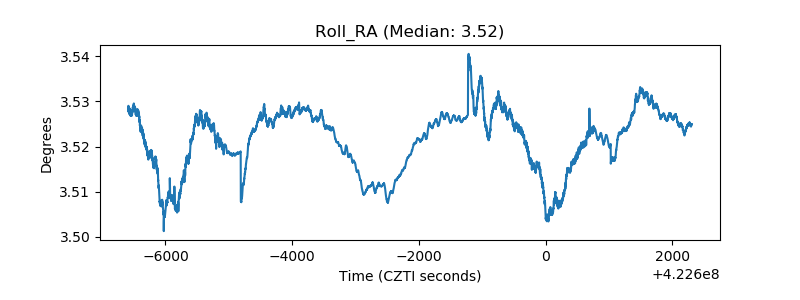 |
| Veto Counter | 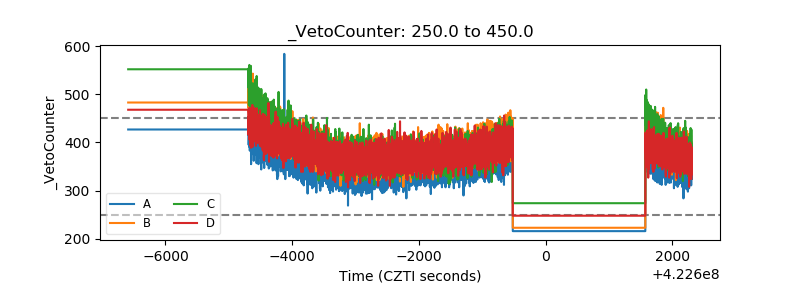 |