| Param | Original file | Final file |
|---|---|---|
| Filename | modeM0/AS1A12_035T01_9000005660_41376cztM0_level2.fits | modeM0/AS1A12_035T01_9000005660_41376cztM0_level2_quad_clean.evt |
| Size (bytes) | 365,618,880 | 82,998,720 |
| Size | 348.7 MB | 79.2 MB |
| Events in quadrant A | 2,762,087 | 566,339 |
| Events in quadrant B | 2,385,714 | 581,724 |
| Events in quadrant C | 2,970,404 | 534,653 |
| Events in quadrant D | 5,011,990 | 466,879 |
| Mode M0 | |||
|---|---|---|---|
| Quadrant | BADHDUFLAG | Total packets | Discarded packets |
| A | 0 | 11297 | 3 |
| B | 0 | 10697 | 2 |
| C | 0 | 12111 | 2 |
| D | 0 | 18451 | 2 |
| Mode SS | |||
|---|---|---|---|
| Quadrant | BADHDUFLAG | Total packets | Discarded packets |
| A | 0 | 106 | 0 |
| B | 0 | 106 | 0 |
| C | 0 | 106 | 0 |
| D | 0 | 106 | 0 |
| Mode M9 | |||
|---|---|---|---|
| Quadrant | BADHDUFLAG | Total packets | Discarded packets |
| A | 0 | 25 | 0 |
| B | 0 | 25 | 0 |
| C | 0 | 25 | 0 |
| D | 0 | 26 | 0 |
| Quadrant | Total seconds | Saturated seconds | Saturation percentage |
|---|---|---|---|
| A | 5185 | 14 | 0.270010% |
| B | 5185 | 9 | 0.173578% |
| C | 5185 | 247 | 4.763742% |
| D | 5185 | 628 | 12.111861% |
Noise dominated data is calculated using 1-second bins in cleaned event files. If a bin has >2000 counts, and if more than 50% of those come from <1% of pixels, then it is considered to be noise-dominated and hence unusable.
| Quadrant | # 1 sec bins | Bins with >0 counts | Bins with >2000 counts | High rate bins dominated by noise | Noise dominated (total time) | Noise dominated (detector-on time) | Marked lightcurve |
|---|---|---|---|---|---|---|---|
| A | 7067 | 5186 | 6 | 6 | 0.08% | 0.12% | 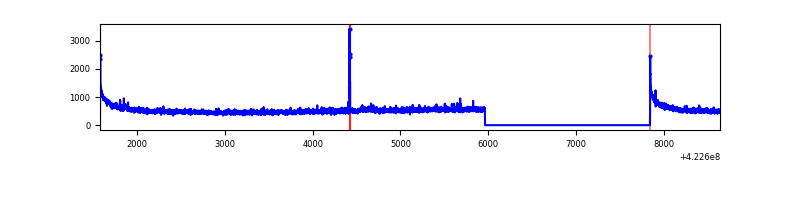 |
| B | 7067 | 5186 | 4 | 4 | 0.06% | 0.08% | 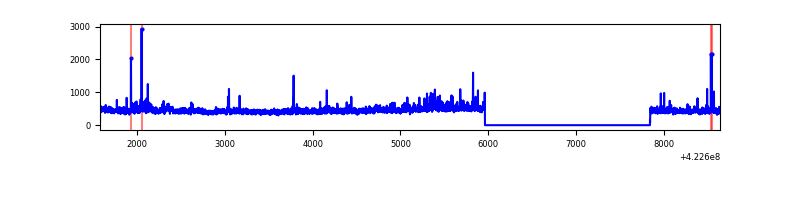 |
| C | 7067 | 5186 | 242 | 242 | 3.42% | 4.67% | 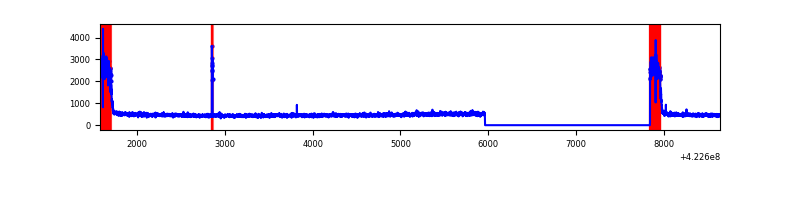 |
| D | 7067 | 5186 | 597 | 597 | 8.45% | 11.51% | 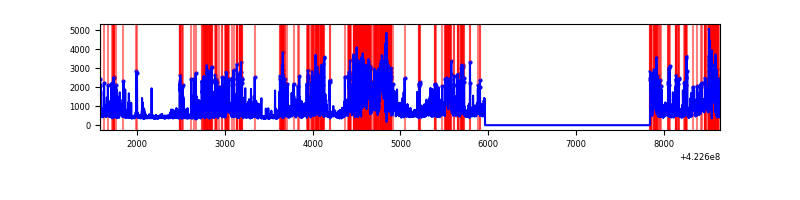 |
Top three noisy pixels from each quadrant. If the there are fewer than three noisy pixels in the level2.evt file, extra rows are filled as -1
| Pixel properties | Quadrant properties | ||||||
|---|---|---|---|---|---|---|---|
| Quadrant | DetID | PixID | Counts | Sigma | Mean | Median | Sigma |
| A | 10 | 83 | 524848 | 4443.03 | 566 | 554 | 118.0 |
| A | 12 | 189 | 24323 | 201.43 | 566 | 554 | 118.0 |
| A | 13 | 248 | 15059 | 122.92 | 566 | 554 | 118.0 |
| B | 0 | 190 | 105666 | 955.44 | 560 | 542 | 110.0 |
| B | 5 | 255 | 40080 | 359.35 | 560 | 542 | 110.0 |
| B | 0 | 229 | 28824 | 257.05 | 560 | 542 | 110.0 |
| C | 0 | 10 | 631410 | 4962.54 | 537 | 541 | 127.1 |
| C | 15 | 214 | 217061 | 1703.19 | 537 | 541 | 127.1 |
| C | 12 | 251 | 23875 | 183.55 | 537 | 541 | 127.1 |
| D | 1 | 47 | 1453939 | 11322.29 | 529 | 513 | 128.4 |
| D | 1 | 52 | 727811 | 5665.7 | 529 | 513 | 128.4 |
| D | 13 | 249 | 463453 | 3606.34 | 529 | 513 | 128.4 |
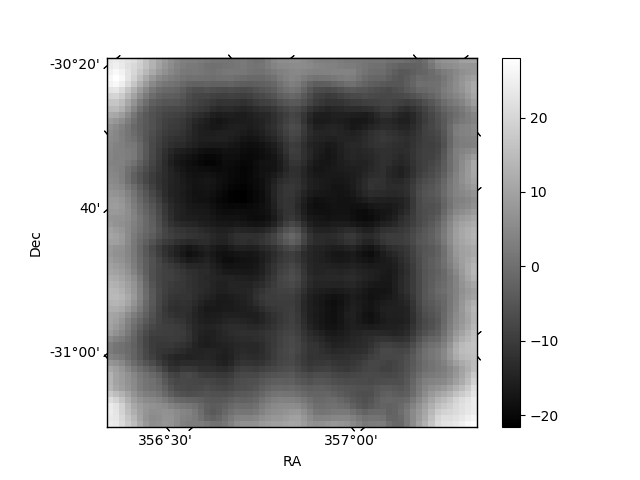
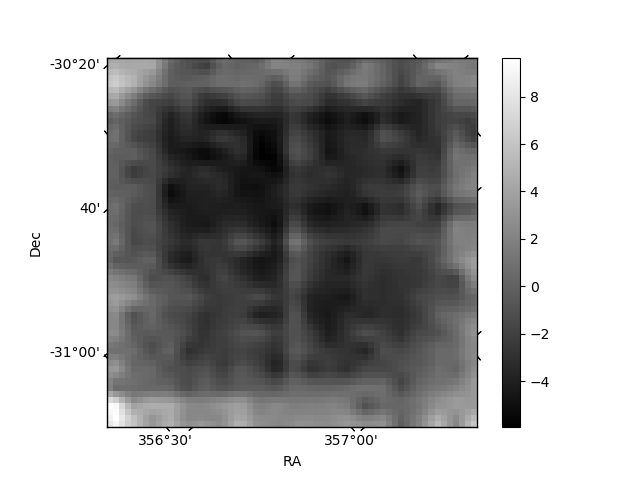
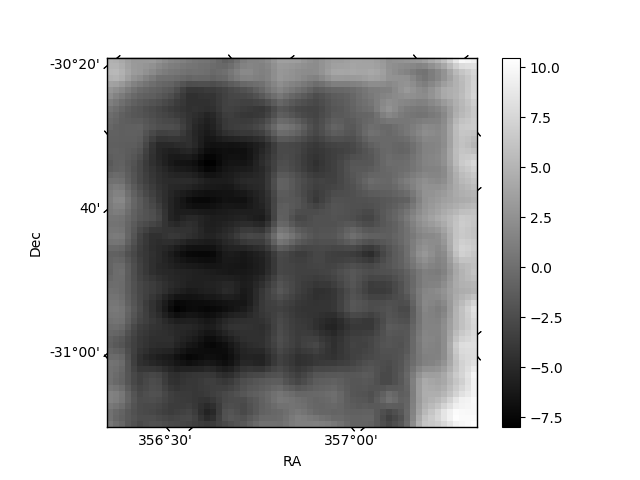
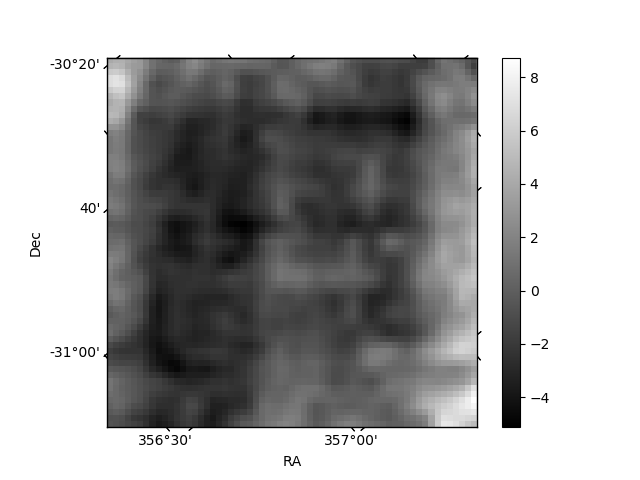
Histogram calculated using DETX and DETY for each event in the final _common_clean file
| Quadrant A | 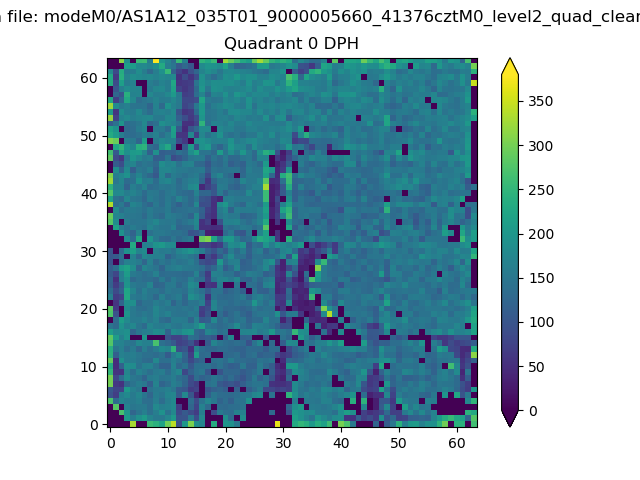 |
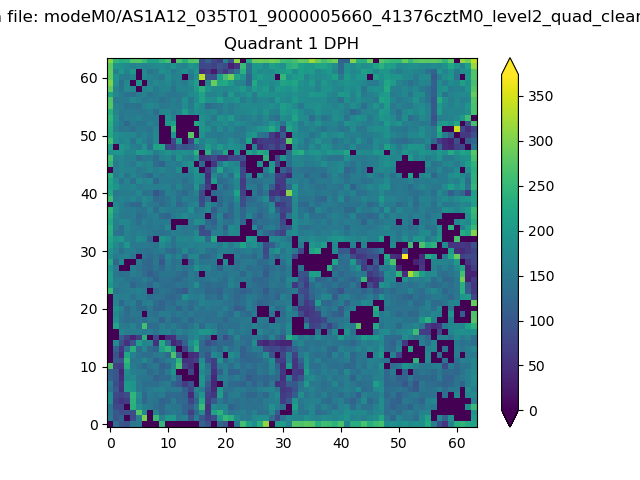 |
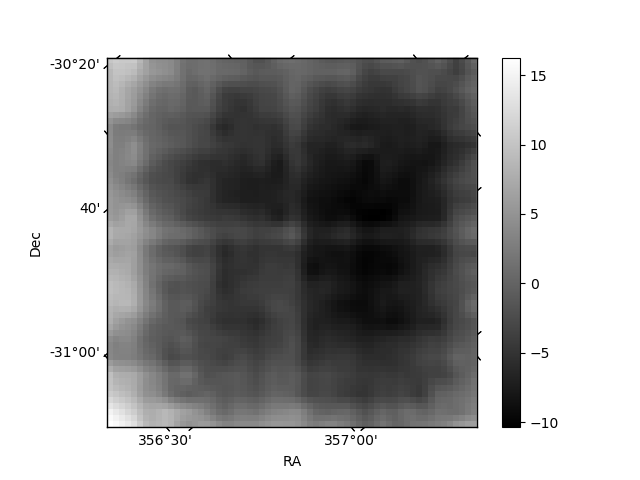
Quadrant B |
|---|---|---|---|
| Quadrant D | 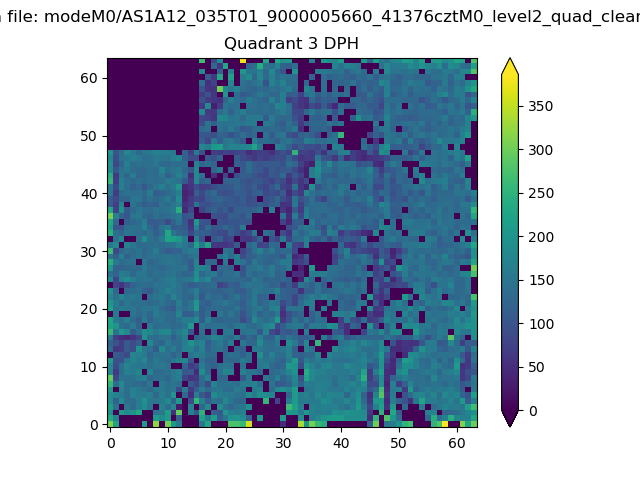 |
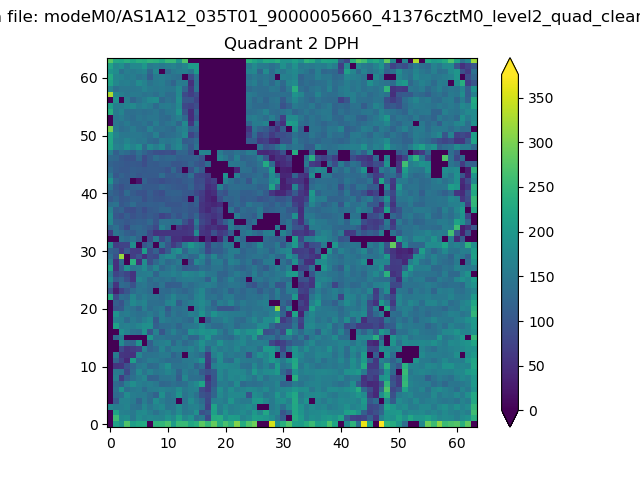 |
Quadrant C |
| Plot type | Count rate plots | Images |
|---|---|---|
| Comparison with Poisson distribution Blue bars denote a histogram of data divided into 1 sec bins. Red curve is a Poisson curve with rate = median count rate of data. |
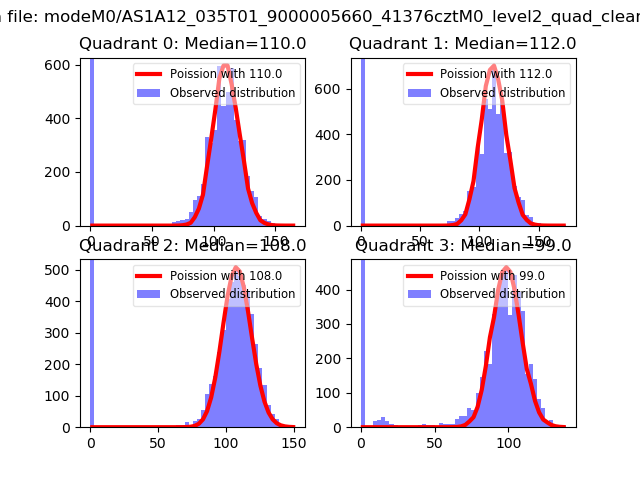 |
 |
| Quadrant-wise count rates Data is divided into 100 sec bins |
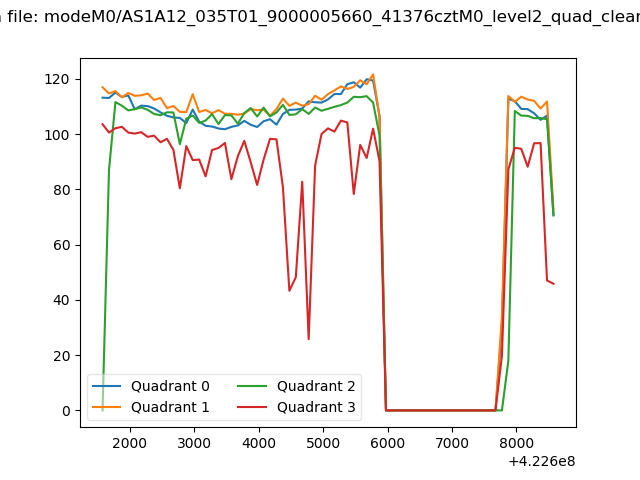 |
|
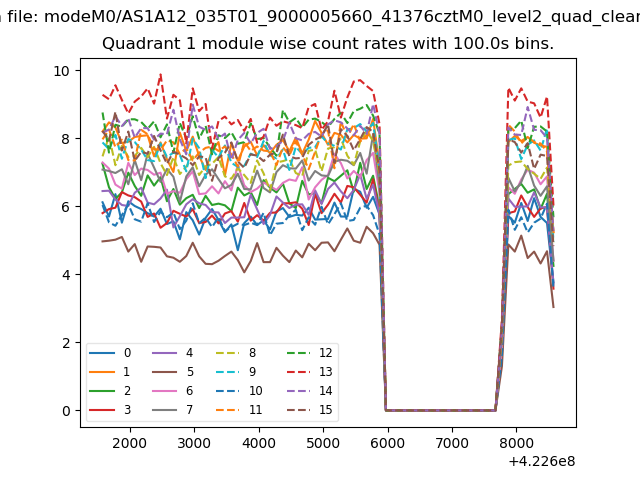
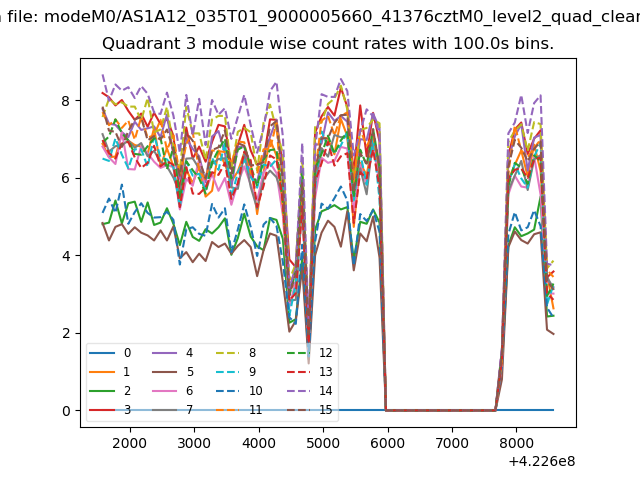
| Module-wise count rates for Quadrant A Data is divided into 100 sec bins |
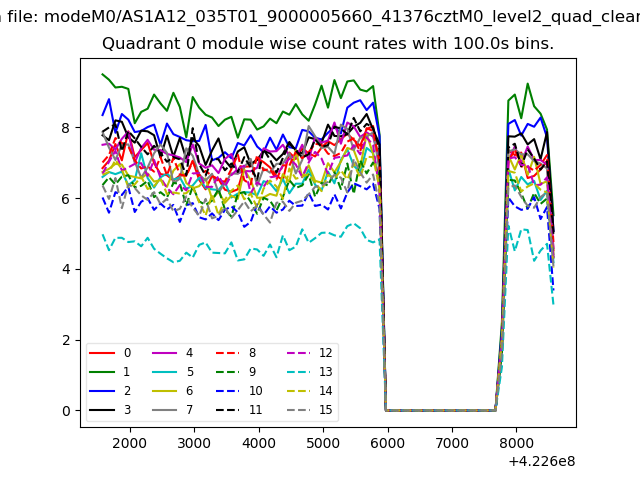 |
 |
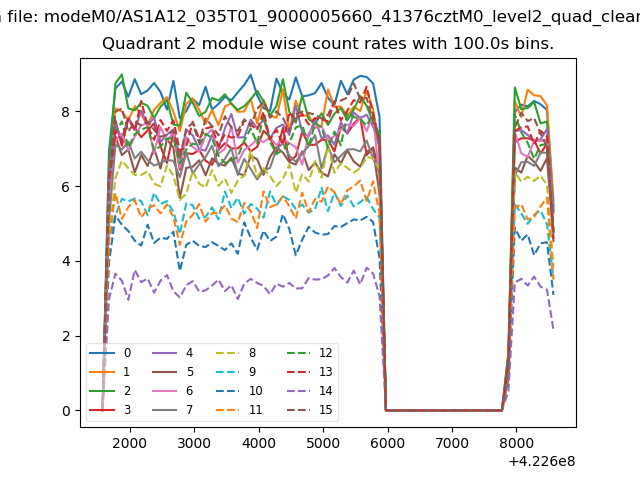
| Module-wise count rates for Quadrant B Data is divided into 100 sec bins |
 |
 |
| Module-wise count rates for Quadrant C Data is divided into 100 sec bins |
 |
 |
| Module-wise count rates for Quadrant D Data is divided into 100 sec bins |
 |
 |
| Parameter | Plot |
|---|---|
| CZT HV Monitor | 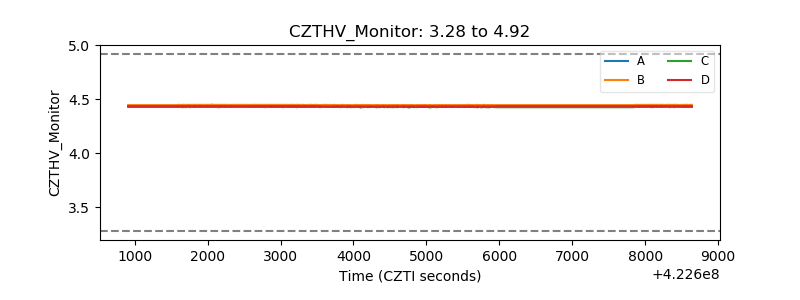 |
| D_VDD | 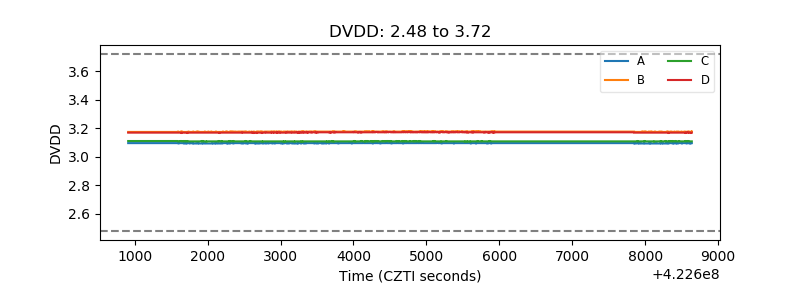 |
| Temperature 1 | 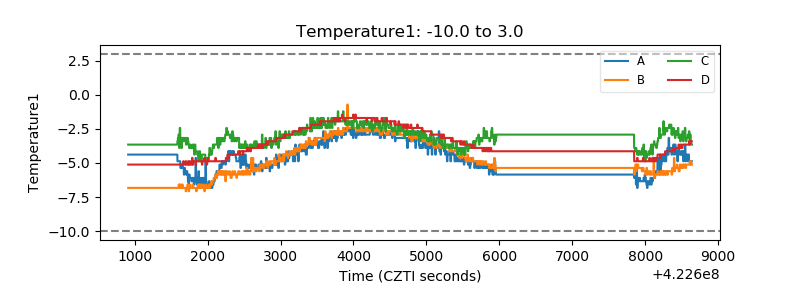 |
| Veto HV Monitor | 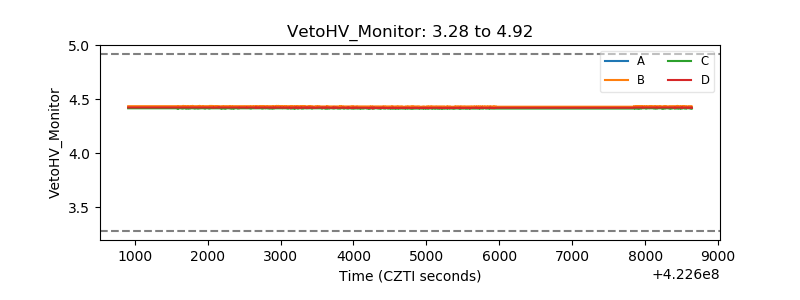 |
| Veto LLD | 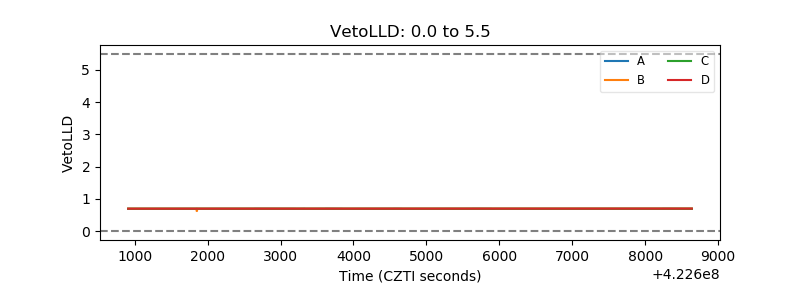 |
| Alpha Counter | 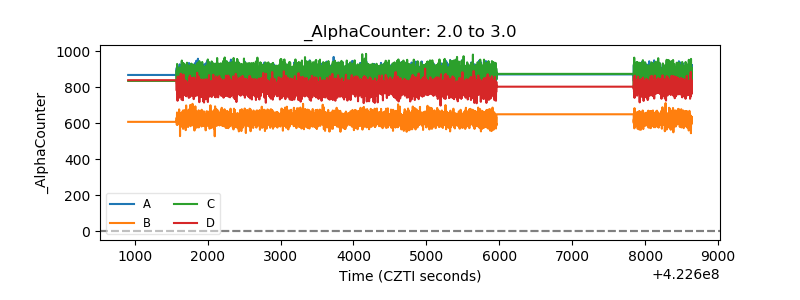 |
| _CPM_Rate | 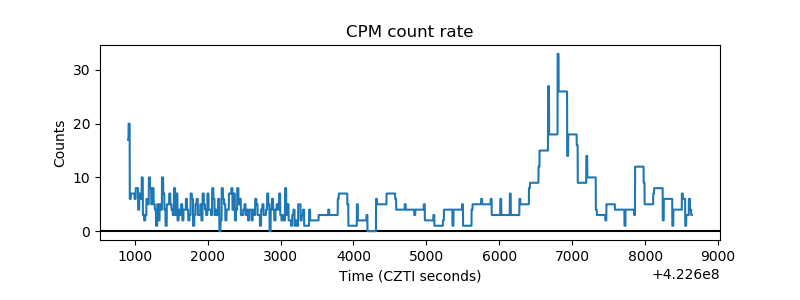 |
| CZT Counter | 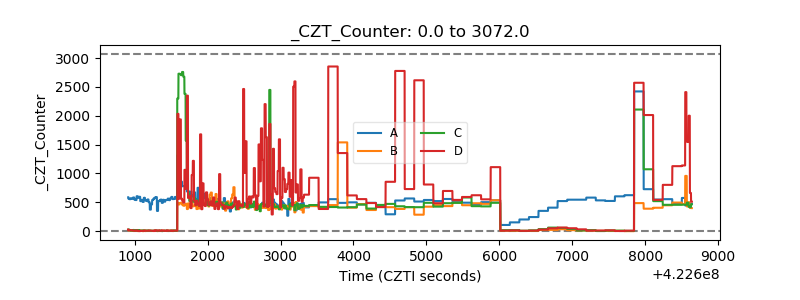 |
| +2.5 Volts monitor | 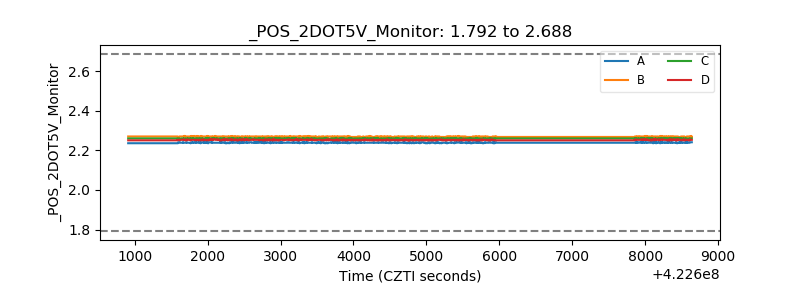 |
| +5 Volts monitor |  |
| _ROLL_ROT | 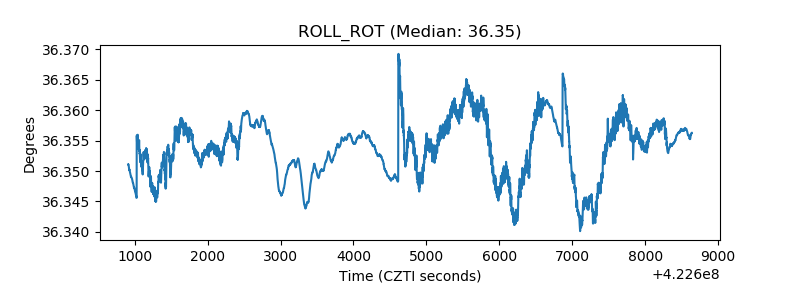 |
| _Roll_DEC | 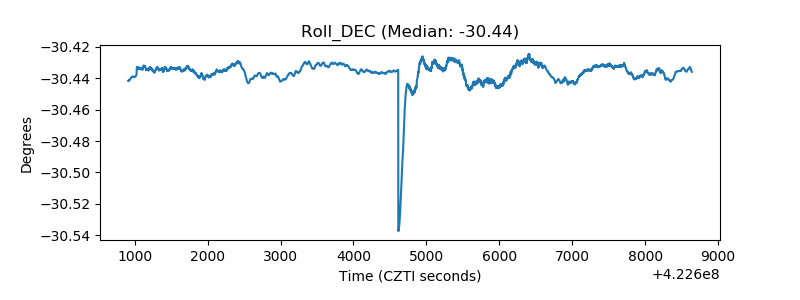 |
| _Roll_RA | 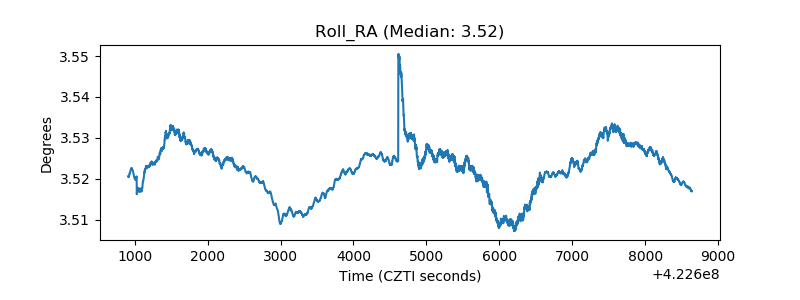 |
| Veto Counter | 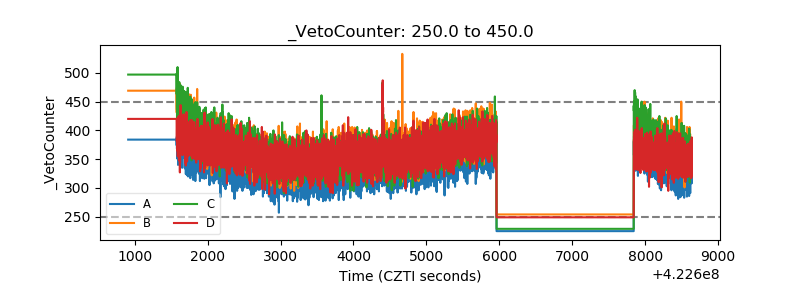 |