| Param | Original file | Final file |
|---|---|---|
| Filename | modeM0/AS1A12_035T01_9000005660_41377cztM0_level2.fits | modeM0/AS1A12_035T01_9000005660_41377cztM0_level2_quad_clean.evt |
| Size (bytes) | 401,630,400 | 91,033,920 |
| Size | 383.0 MB | 86.8 MB |
| Events in quadrant A | 3,032,890 | 618,724 |
| Events in quadrant B | 2,594,452 | 634,501 |
| Events in quadrant C | 3,160,046 | 588,992 |
| Events in quadrant D | 5,633,481 | 513,484 |
| Mode M0 | |||
|---|---|---|---|
| Quadrant | BADHDUFLAG | Total packets | Discarded packets |
| A | 0 | 12339 | 3 |
| B | 0 | 11764 | 2 |
| C | 0 | 13026 | 2 |
| D | 0 | 20629 | 2 |
| Mode SS | |||
|---|---|---|---|
| Quadrant | BADHDUFLAG | Total packets | Discarded packets |
| A | 0 | 116 | 0 |
| B | 0 | 116 | 0 |
| C | 0 | 116 | 0 |
| D | 0 | 116 | 0 |
| Mode M9 | |||
|---|---|---|---|
| Quadrant | BADHDUFLAG | Total packets | Discarded packets |
| A | 0 | 18 | 0 |
| B | 0 | 18 | 0 |
| C | 0 | 18 | 0 |
| D | 0 | 19 | 0 |
| Quadrant | Total seconds | Saturated seconds | Saturation percentage |
|---|---|---|---|
| A | 5734 | 9 | 0.156958% |
| B | 5734 | 23 | 0.401116% |
| C | 5734 | 216 | 3.767004% |
| D | 5734 | 701 | 12.225323% |
Noise dominated data is calculated using 1-second bins in cleaned event files. If a bin has >2000 counts, and if more than 50% of those come from <1% of pixels, then it is considered to be noise-dominated and hence unusable.
| Quadrant | # 1 sec bins | Bins with >0 counts | Bins with >2000 counts | High rate bins dominated by noise | Noise dominated (total time) | Noise dominated (detector-on time) | Marked lightcurve |
|---|---|---|---|---|---|---|---|
| A | 7287 | 5735 | 3 | 3 | 0.04% | 0.05% | 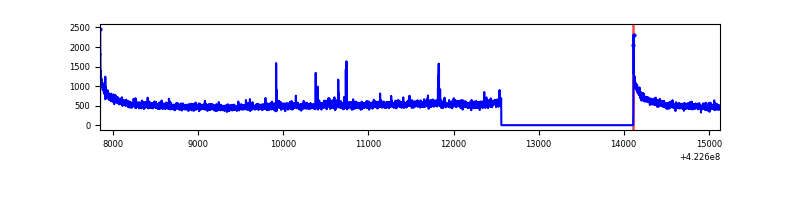 |
| B | 7287 | 5735 | 10 | 10 | 0.14% | 0.17% | 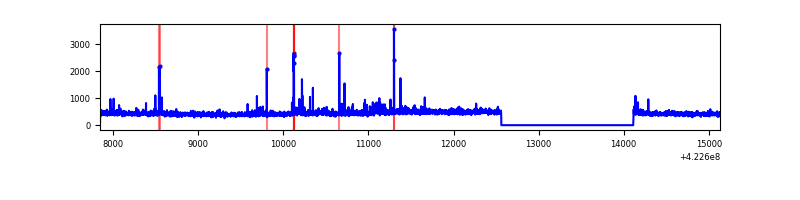 |
| C | 7287 | 5735 | 215 | 215 | 2.95% | 3.75% | 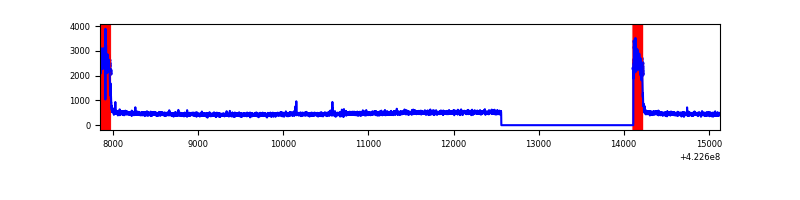 |
| D | 7287 | 5735 | 634 | 634 | 8.70% | 11.05% | 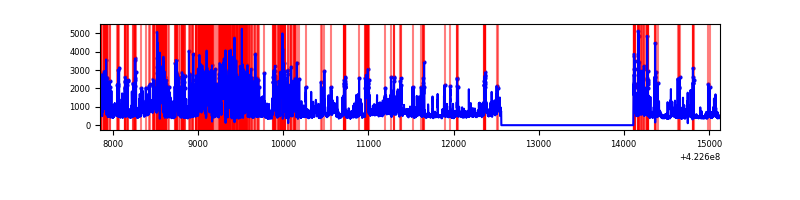 |
Top three noisy pixels from each quadrant. If the there are fewer than three noisy pixels in the level2.evt file, extra rows are filled as -1
| Pixel properties | Quadrant properties | ||||||
|---|---|---|---|---|---|---|---|
| Quadrant | DetID | PixID | Counts | Sigma | Mean | Median | Sigma |
| A | 10 | 83 | 558409 | 4293.44 | 626 | 613 | 129.9 |
| A | 12 | 189 | 24967 | 187.46 | 626 | 613 | 129.9 |
| A | 13 | 248 | 20526 | 153.27 | 626 | 613 | 129.9 |
| B | 0 | 190 | 83104 | 683.22 | 620 | 602 | 120.8 |
| B | 5 | 255 | 39571 | 322.71 | 620 | 602 | 120.8 |
| B | 0 | 155 | 15749 | 125.44 | 620 | 602 | 120.8 |
| C | 0 | 10 | 586049 | 4091.37 | 598 | 602 | 143.1 |
| C | 15 | 214 | 239934 | 1672.56 | 598 | 602 | 143.1 |
| C | 13 | 61 | 3985 | 23.64 | 598 | 602 | 143.1 |
| D | 1 | 47 | 2214411 | 15511.72 | 584 | 568 | 142.7 |
| D | 1 | 52 | 726596 | 5087.06 | 584 | 568 | 142.7 |
| D | 13 | 249 | 123780 | 863.31 | 584 | 568 | 142.7 |
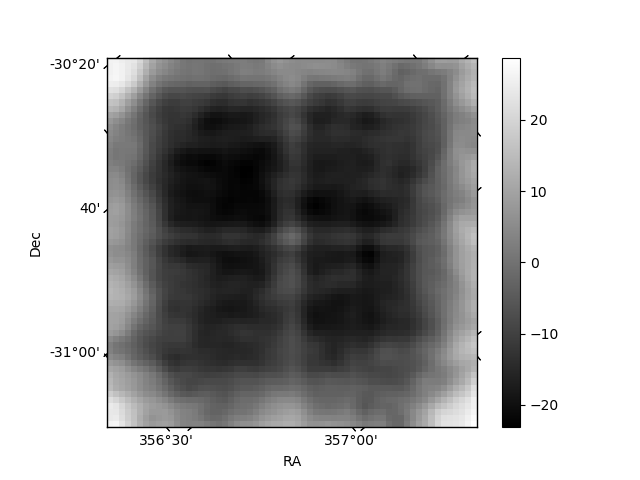
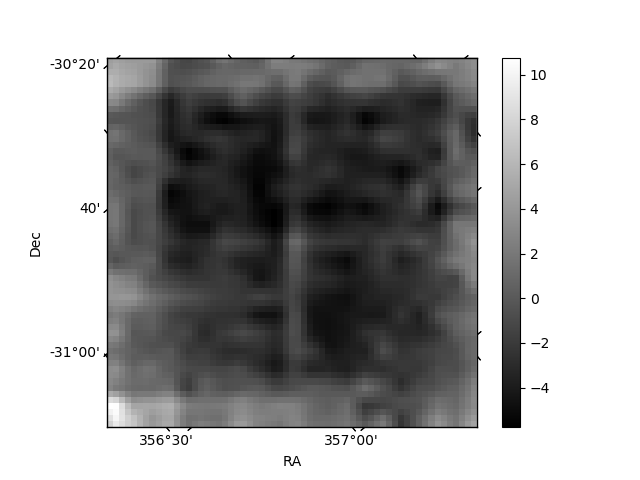
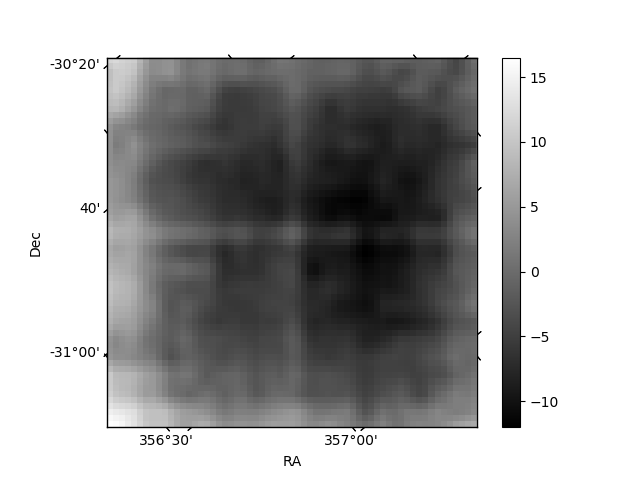
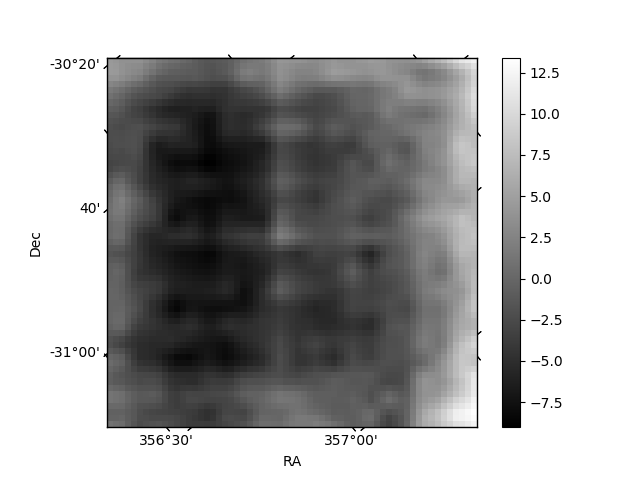
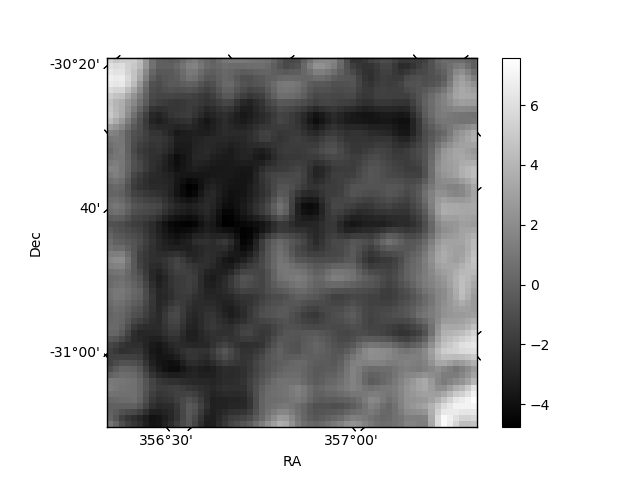
Histogram calculated using DETX and DETY for each event in the final _common_clean file
| Quadrant A | 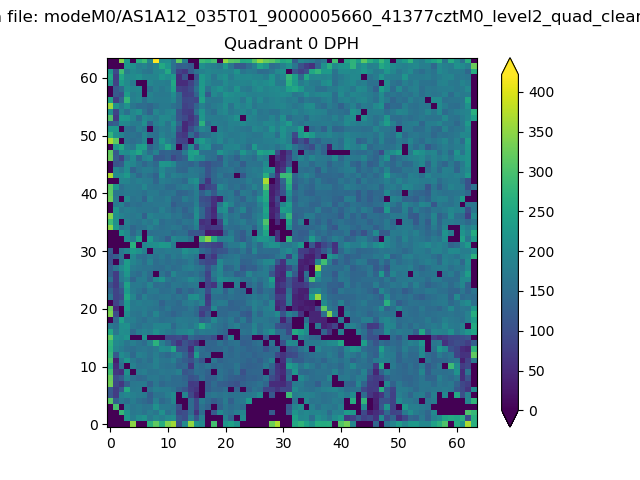 |
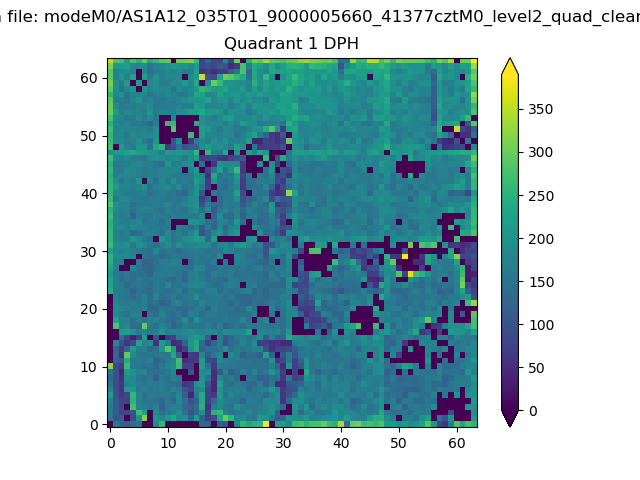 |
Quadrant B |
|---|---|---|---|
| Quadrant D | 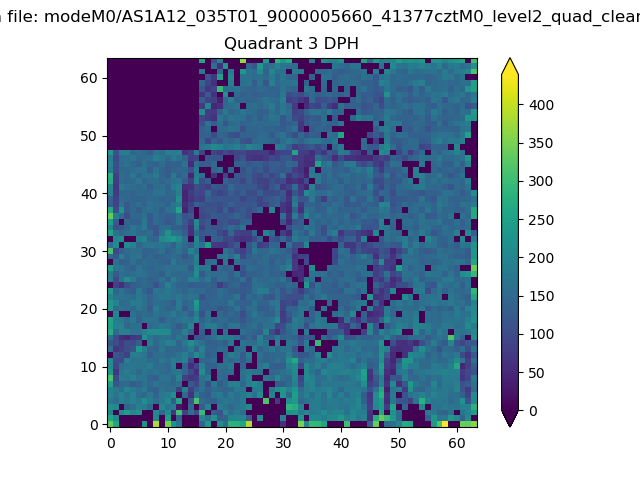 |
 |
Quadrant C |
| Plot type | Count rate plots | Images |
|---|---|---|
| Comparison with Poisson distribution Blue bars denote a histogram of data divided into 1 sec bins. Red curve is a Poisson curve with rate = median count rate of data. |
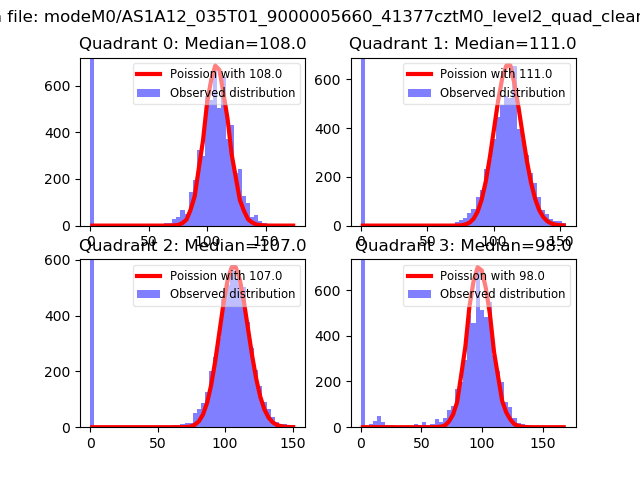 |
 |
| Quadrant-wise count rates Data is divided into 100 sec bins |
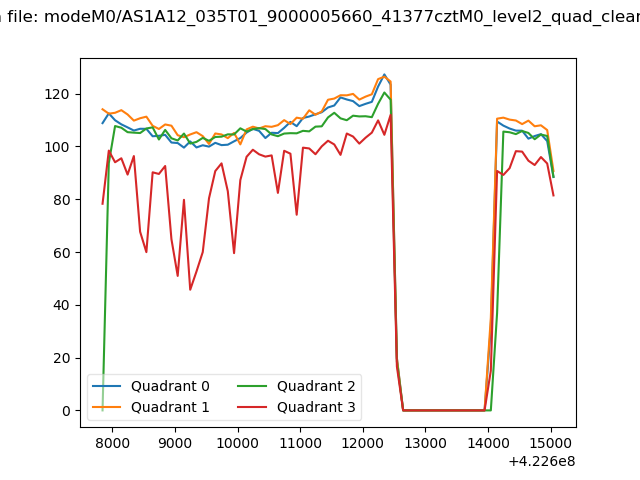 |
|
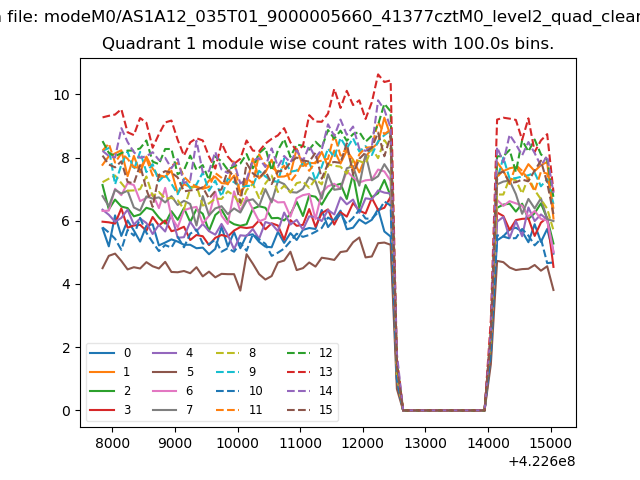
| Module-wise count rates for Quadrant A Data is divided into 100 sec bins |
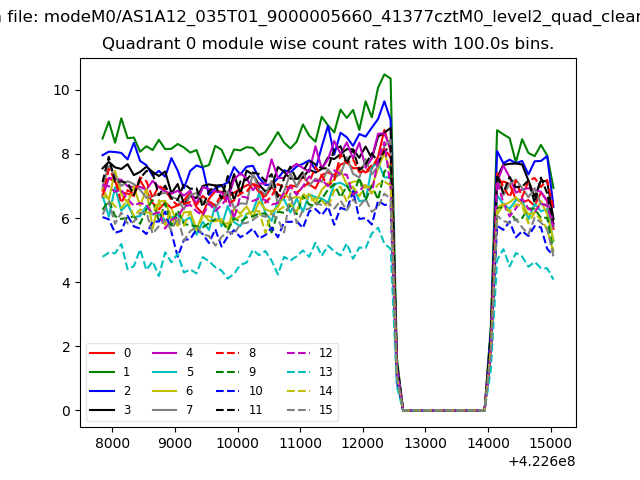 |
 |
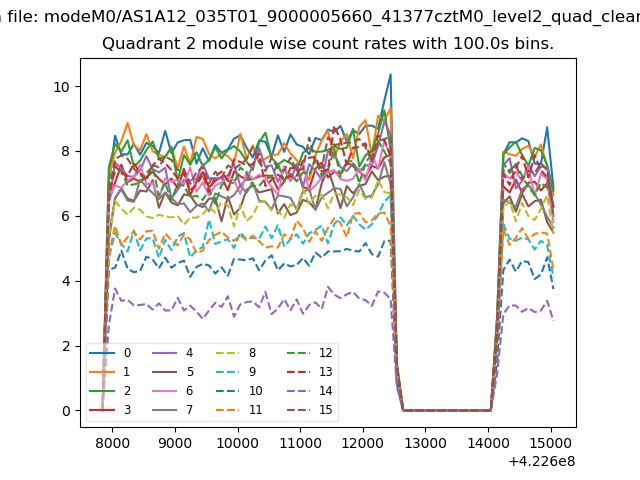
| Module-wise count rates for Quadrant B Data is divided into 100 sec bins |
 |
 |
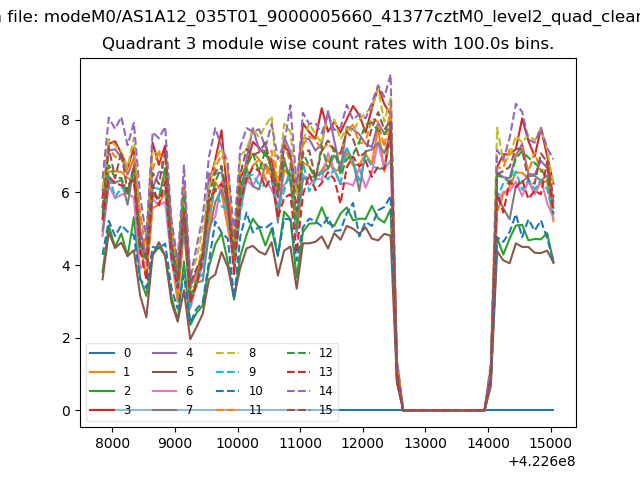
| Module-wise count rates for Quadrant C Data is divided into 100 sec bins |
 |
 |
| Module-wise count rates for Quadrant D Data is divided into 100 sec bins |
 |
 |
| Parameter | Plot |
|---|---|
| CZT HV Monitor | 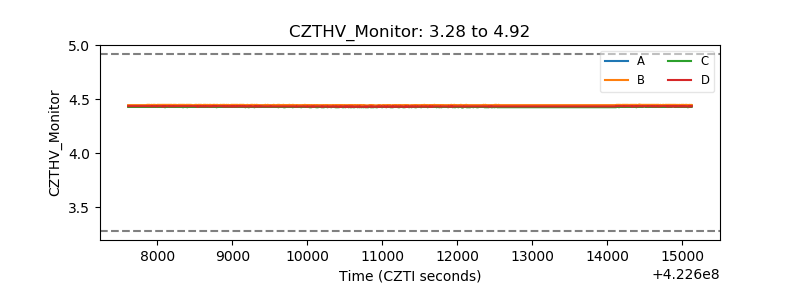 |
| D_VDD | 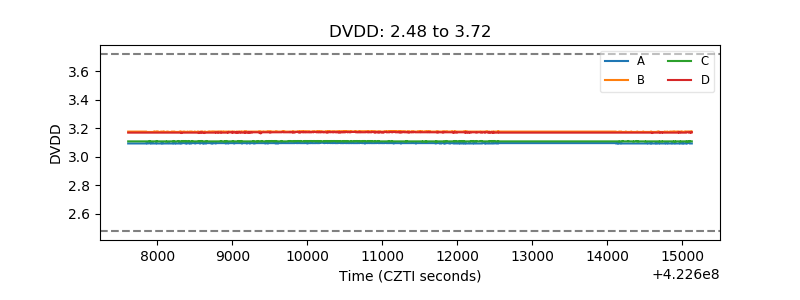 |
| Temperature 1 | 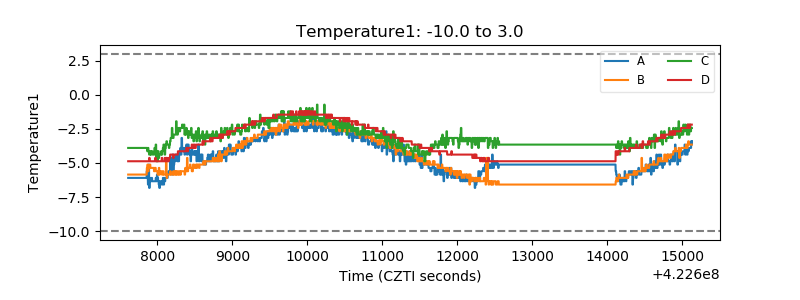 |
| Veto HV Monitor | 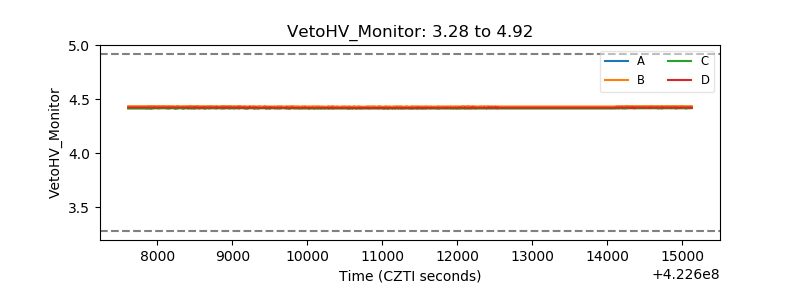 |
| Veto LLD | 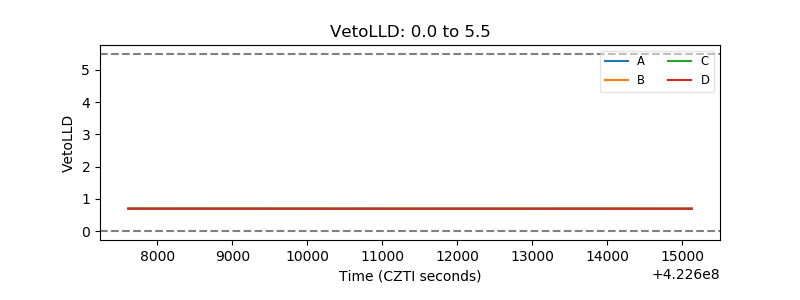 |
| Alpha Counter | 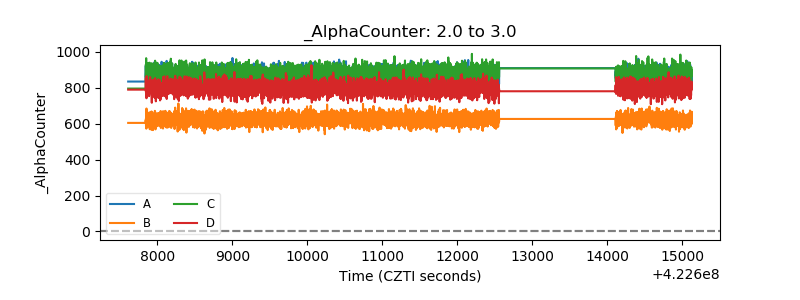 |
| _CPM_Rate |  |
| CZT Counter |  |
| +2.5 Volts monitor | 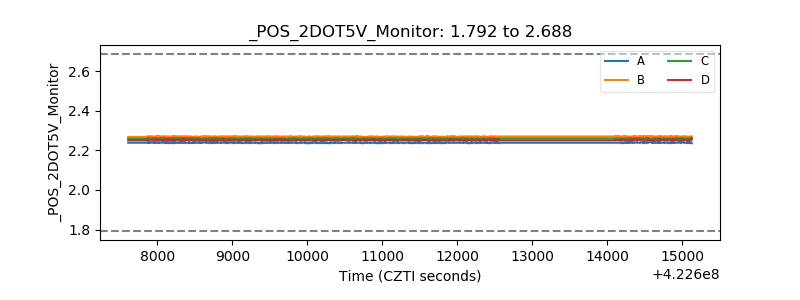 |
| +5 Volts monitor | 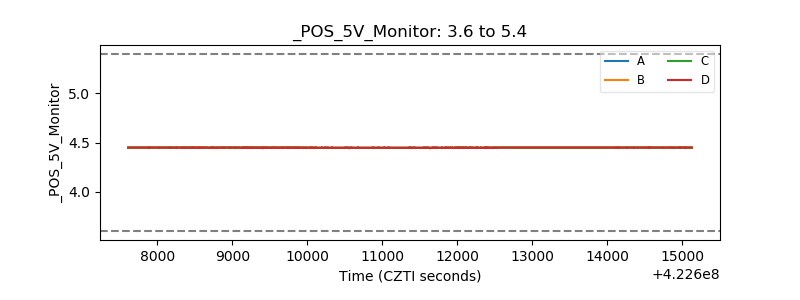 |
| _ROLL_ROT | 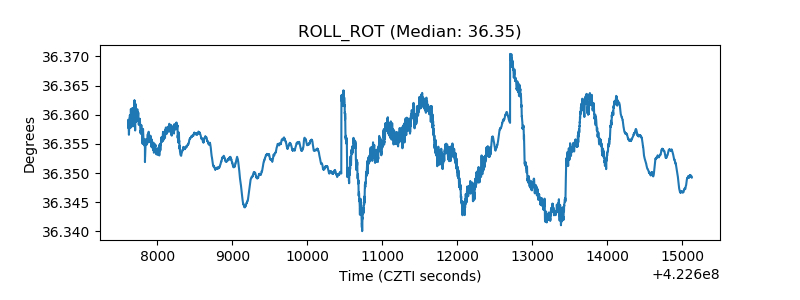 |
| _Roll_DEC | 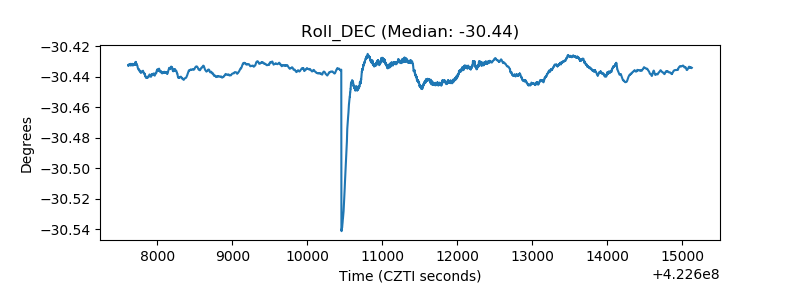 |
| _Roll_RA | 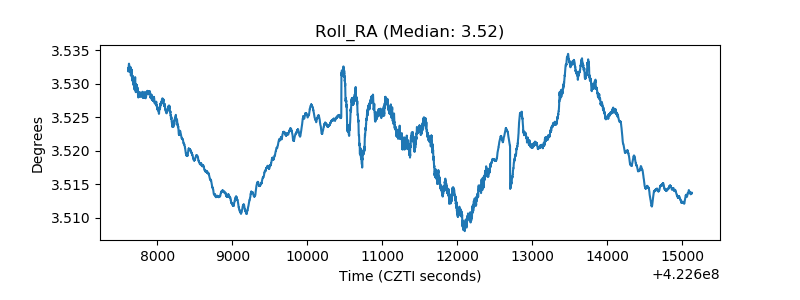 |
| Veto Counter | 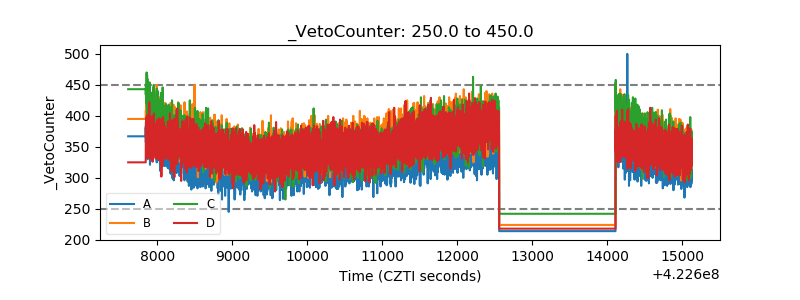 |