| Param | Original file | Final file |
|---|---|---|
| Filename | modeM0/AS1A12_035T01_9000005660_41378cztM0_level2.fits | modeM0/AS1A12_035T01_9000005660_41378cztM0_level2_quad_clean.evt |
| Size (bytes) | 363,009,600 | 93,594,240 |
| Size | 346.2 MB | 89.3 MB |
| Events in quadrant A | 3,064,377 | 626,278 |
| Events in quadrant B | 2,619,111 | 642,062 |
| Events in quadrant C | 3,202,467 | 598,235 |
| Events in quadrant D | 4,094,812 | 557,890 |
| Mode M0 | |||
|---|---|---|---|
| Quadrant | BADHDUFLAG | Total packets | Discarded packets |
| A | 0 | 12499 | 3 |
| B | 0 | 11862 | 2 |
| C | 0 | 13236 | 2 |
| D | 0 | 16051 | 2 |
| Mode SS | |||
|---|---|---|---|
| Quadrant | BADHDUFLAG | Total packets | Discarded packets |
| A | 0 | 118 | 0 |
| B | 0 | 118 | 0 |
| C | 0 | 118 | 0 |
| D | 0 | 118 | 0 |
| Mode M9 | |||
|---|---|---|---|
| Quadrant | BADHDUFLAG | Total packets | Discarded packets |
| A | 0 | 14 | 0 |
| B | 0 | 14 | 0 |
| C | 0 | 14 | 0 |
| D | 0 | 15 | 0 |
| Quadrant | Total seconds | Saturated seconds | Saturation percentage |
|---|---|---|---|
| A | 5864 | 14 | 0.238745% |
| B | 5864 | 5 | 0.085266% |
| C | 5864 | 205 | 3.495907% |
| D | 5864 | 243 | 4.143929% |
Noise dominated data is calculated using 1-second bins in cleaned event files. If a bin has >2000 counts, and if more than 50% of those come from <1% of pixels, then it is considered to be noise-dominated and hence unusable.
| Quadrant | # 1 sec bins | Bins with >0 counts | Bins with >2000 counts | High rate bins dominated by noise | Noise dominated (total time) | Noise dominated (detector-on time) | Marked lightcurve |
|---|---|---|---|---|---|---|---|
| A | 7178 | 5865 | 8 | 8 | 0.11% | 0.14% | 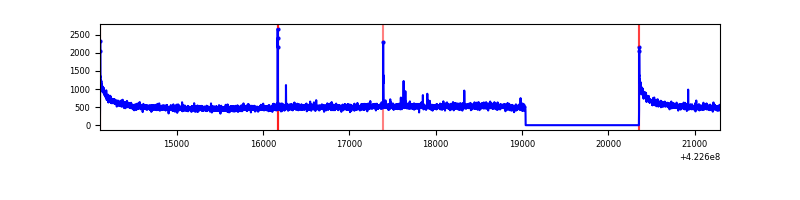 |
| B | 7178 | 5865 | 0 | 0 | 0.00% | 0.00% | 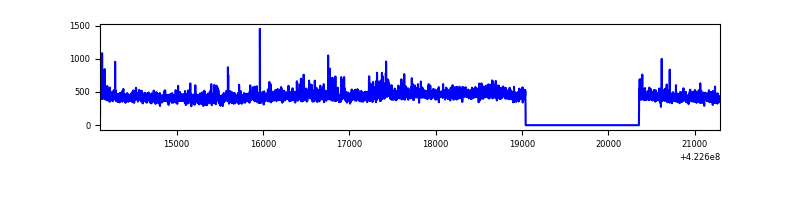 |
| C | 7178 | 5865 | 202 | 202 | 2.81% | 3.44% | 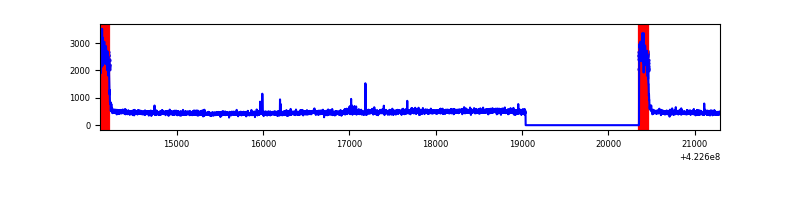 |
| D | 7178 | 5865 | 224 | 224 | 3.12% | 3.82% | 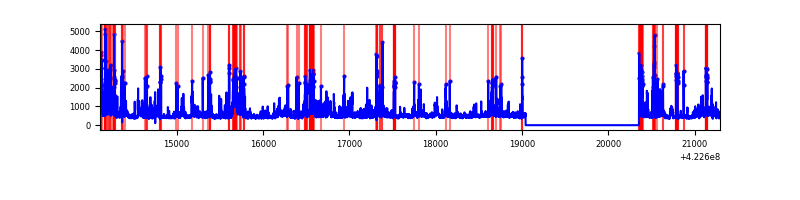 |
Top three noisy pixels from each quadrant. If the there are fewer than three noisy pixels in the level2.evt file, extra rows are filled as -1
| Pixel properties | Quadrant properties | ||||||
|---|---|---|---|---|---|---|---|
| Quadrant | DetID | PixID | Counts | Sigma | Mean | Median | Sigma |
| A | 10 | 83 | 546331 | 4097.07 | 640 | 625 | 133.2 |
| A | 12 | 189 | 18352 | 133.09 | 640 | 625 | 133.2 |
| A | 13 | 248 | 17368 | 125.7 | 640 | 625 | 133.2 |
| B | 0 | 190 | 61599 | 488.41 | 635 | 616 | 124.9 |
| B | 0 | 186 | 16695 | 128.77 | 635 | 616 | 124.9 |
| B | 12 | 111 | 16030 | 123.45 | 635 | 616 | 124.9 |
| C | 0 | 10 | 546634 | 3799.28 | 612 | 615 | 143.7 |
| C | 15 | 214 | 242787 | 1685.07 | 612 | 615 | 143.7 |
| C | 9 | 54 | 12776 | 84.62 | 612 | 615 | 143.7 |
| D | 1 | 52 | 684696 | 4469.33 | 619 | 599 | 153.1 |
| D | 1 | 47 | 497512 | 3246.42 | 619 | 599 | 153.1 |
| D | 5 | 222 | 151613 | 986.6 | 619 | 599 | 153.1 |
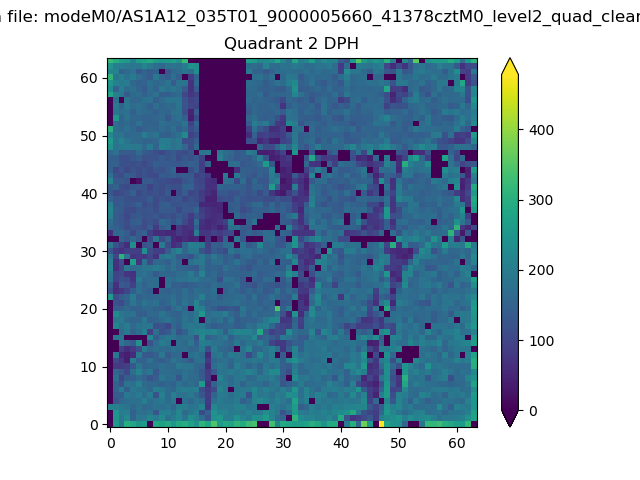
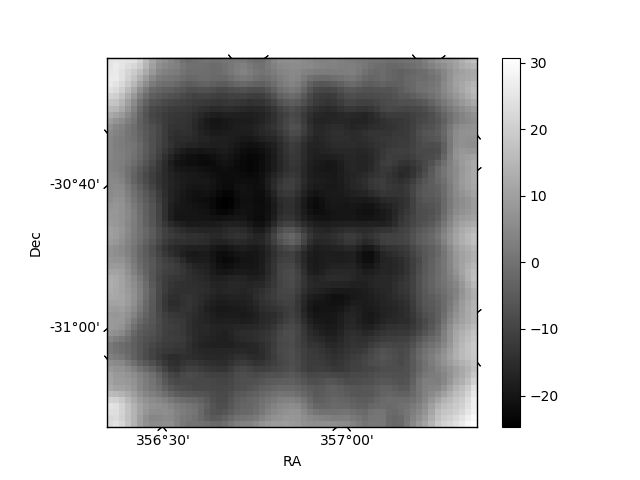
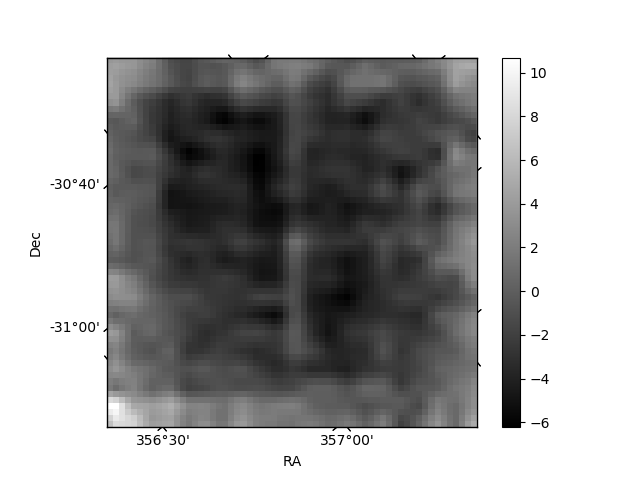
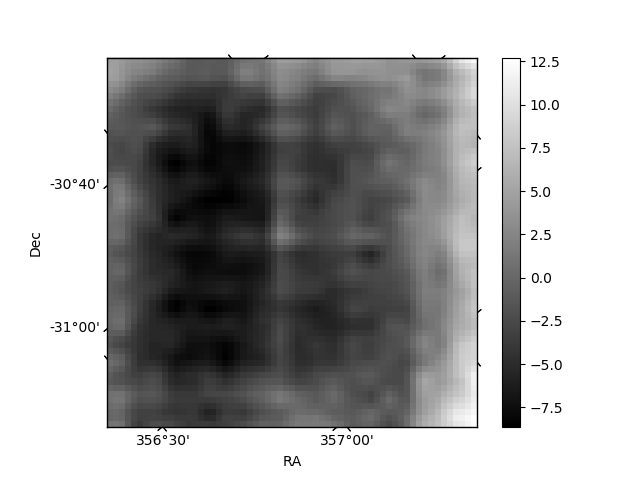
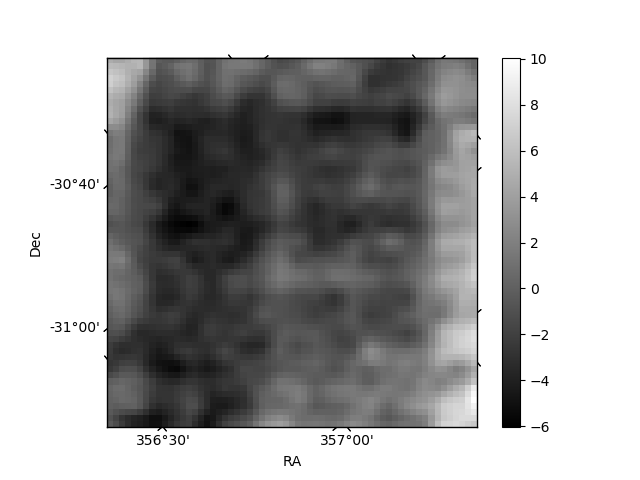
Histogram calculated using DETX and DETY for each event in the final _common_clean file
| Quadrant A | 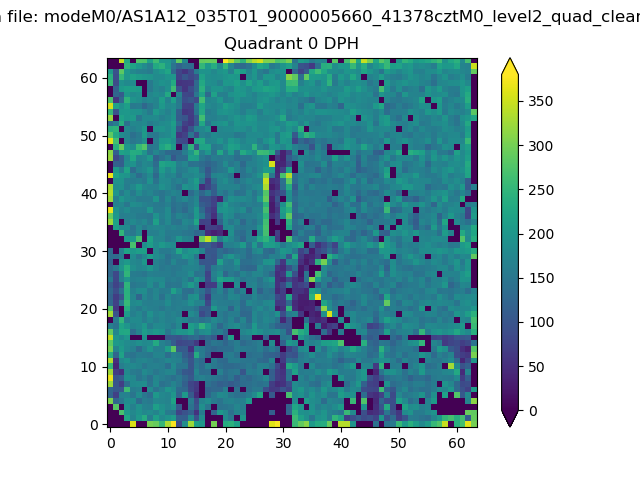 |
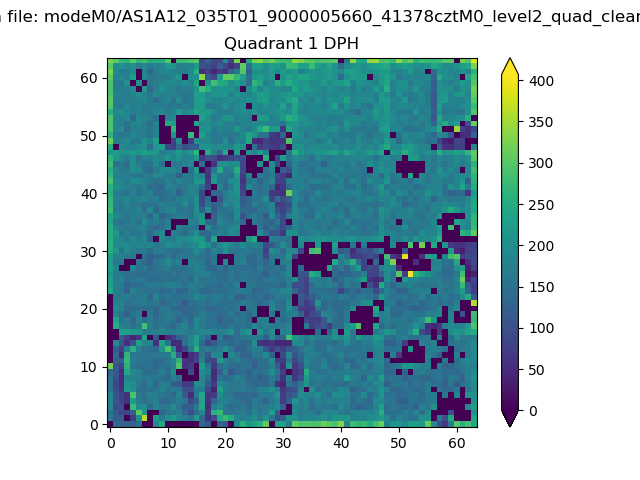 |
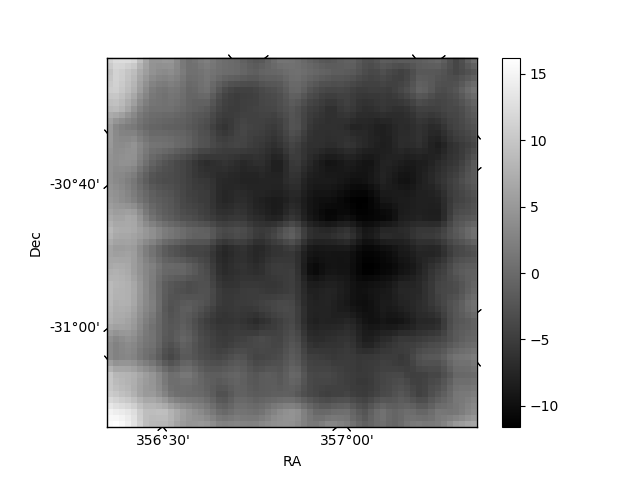
Quadrant B |
|---|---|---|---|
| Quadrant D | 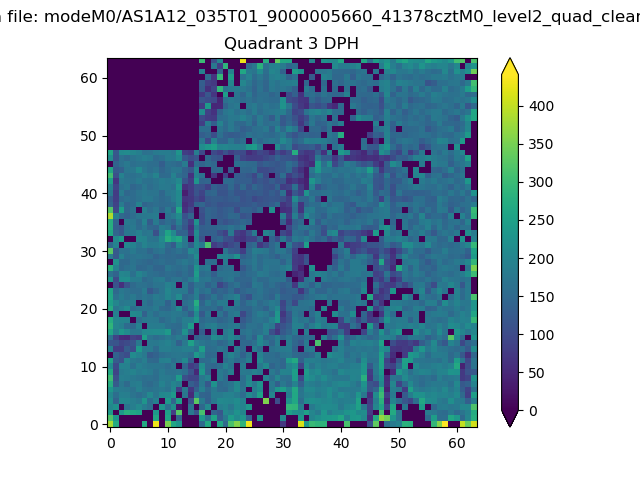 |
 |
Quadrant C |
| Plot type | Count rate plots | Images |
|---|---|---|
| Comparison with Poisson distribution Blue bars denote a histogram of data divided into 1 sec bins. Red curve is a Poisson curve with rate = median count rate of data. |
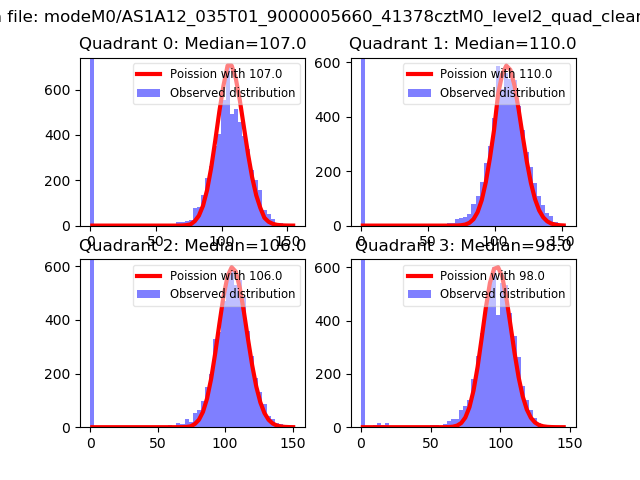 |
 |
| Quadrant-wise count rates Data is divided into 100 sec bins |
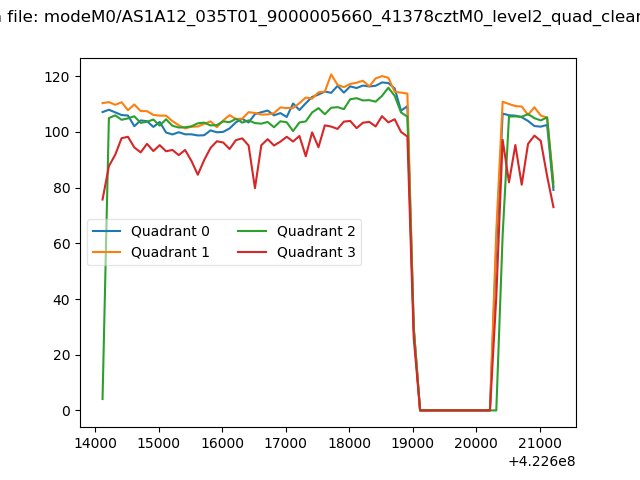 |
|
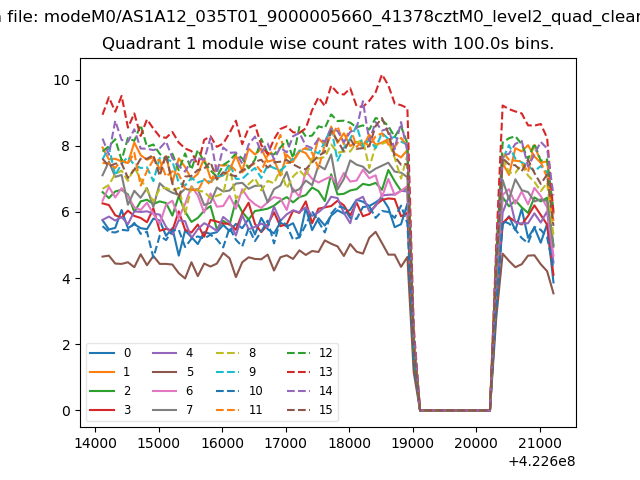
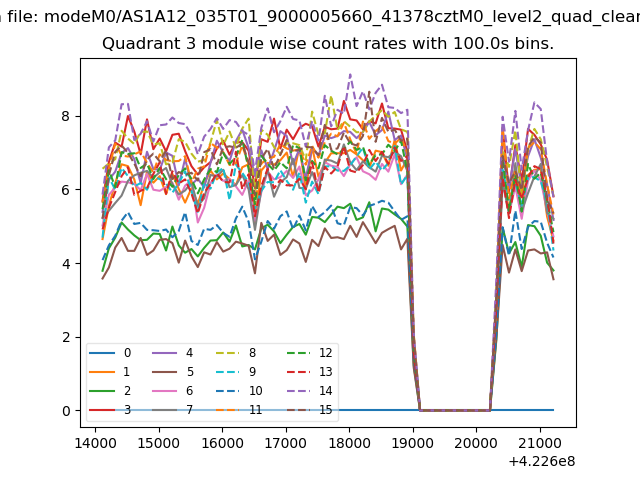
| Module-wise count rates for Quadrant A Data is divided into 100 sec bins |
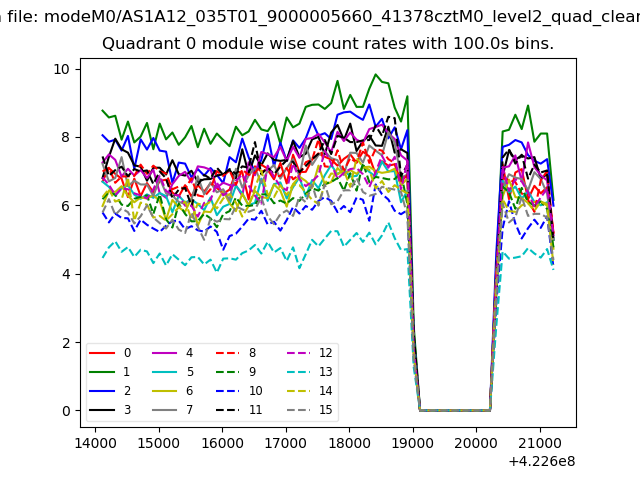 |
 |
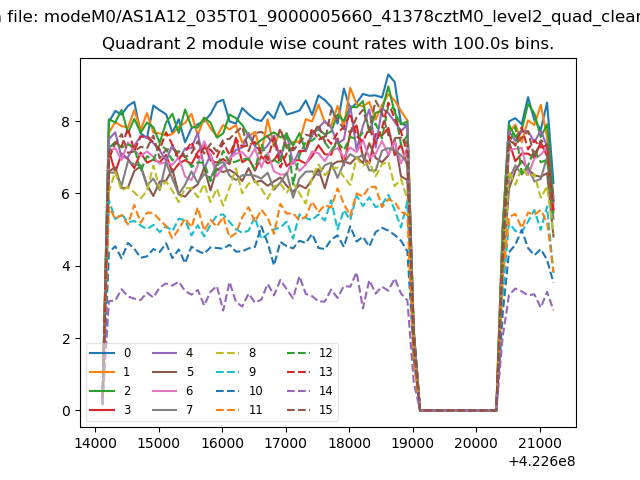
| Module-wise count rates for Quadrant B Data is divided into 100 sec bins |
 |
 |
| Module-wise count rates for Quadrant C Data is divided into 100 sec bins |
 |
 |
| Module-wise count rates for Quadrant D Data is divided into 100 sec bins |
 |
 |
| Parameter | Plot |
|---|---|
| CZT HV Monitor | 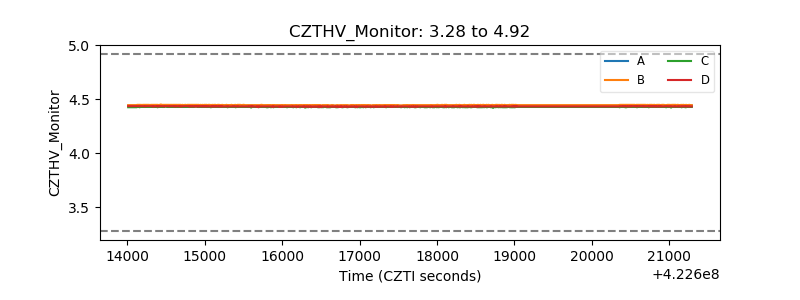 |
| D_VDD | 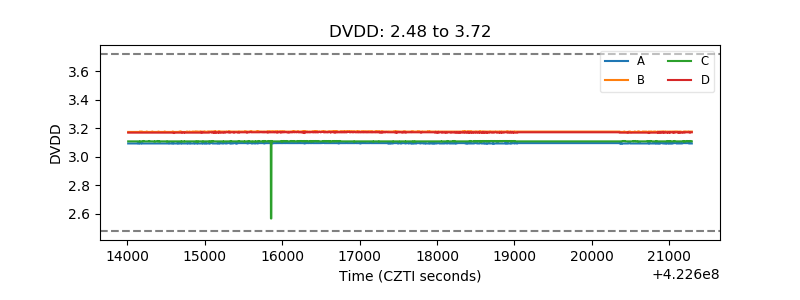 |
| Temperature 1 | 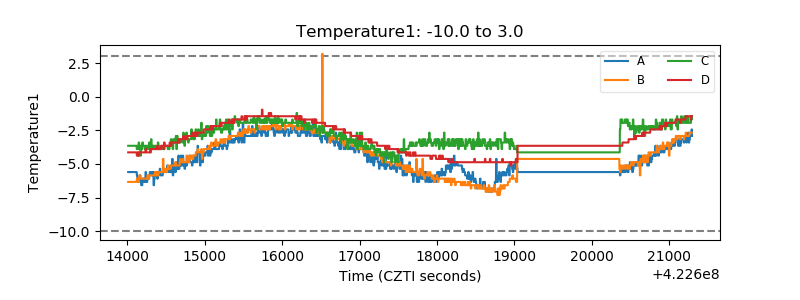 |
| Veto HV Monitor |  |
| Veto LLD | 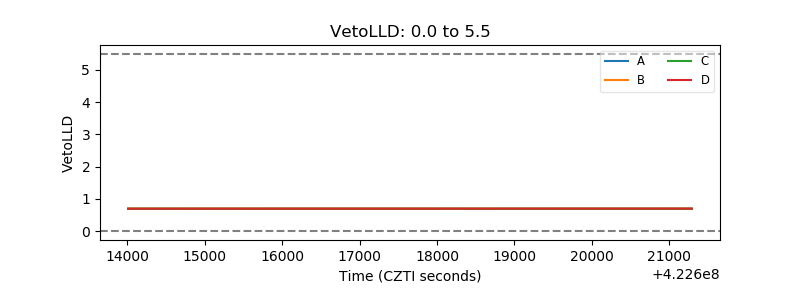 |
| Alpha Counter | 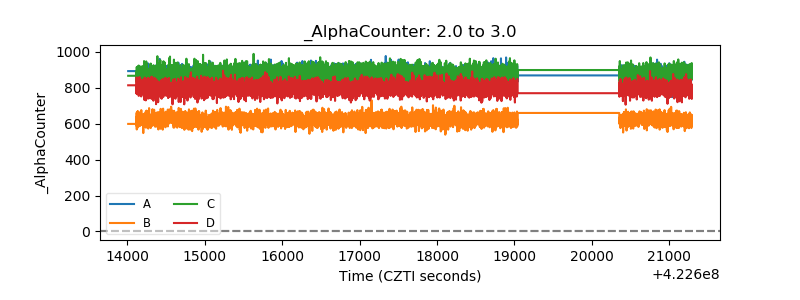 |
| _CPM_Rate | 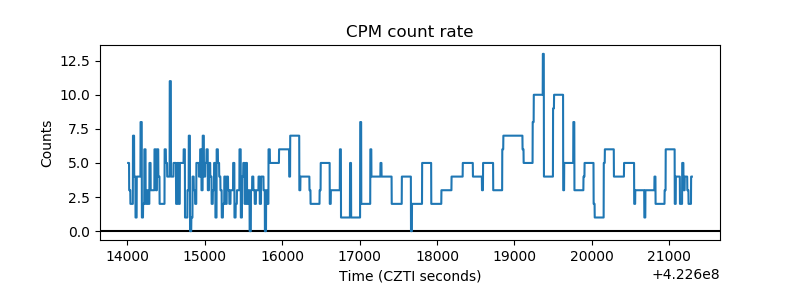 |
| CZT Counter | 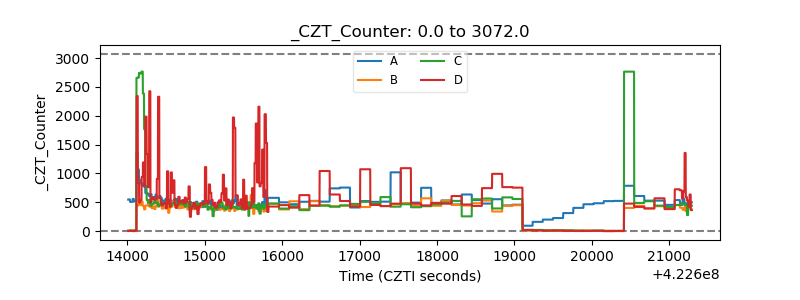 |
| +2.5 Volts monitor | 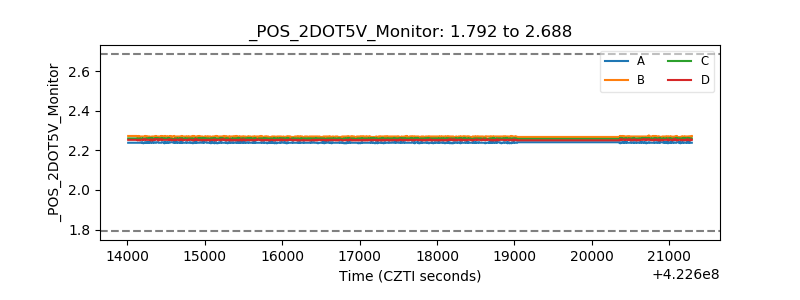 |
| +5 Volts monitor | 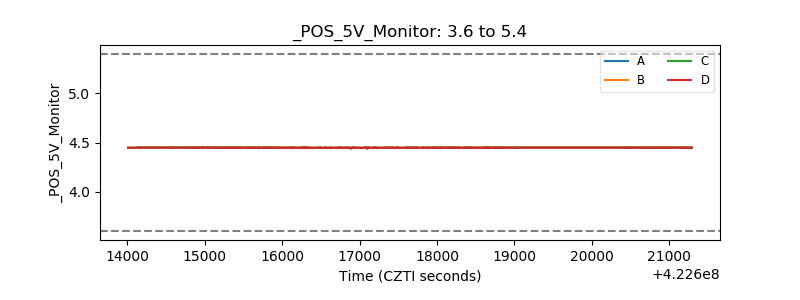 |
| _ROLL_ROT | 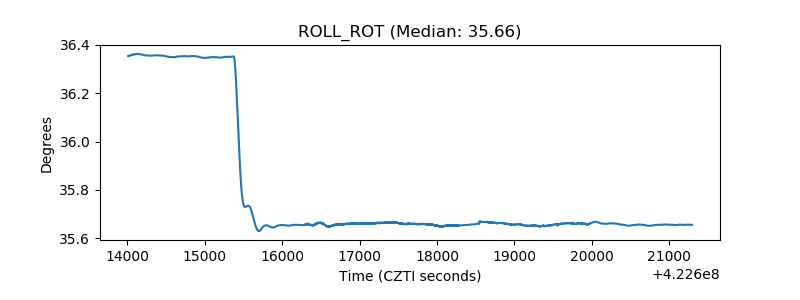 |
| _Roll_DEC | 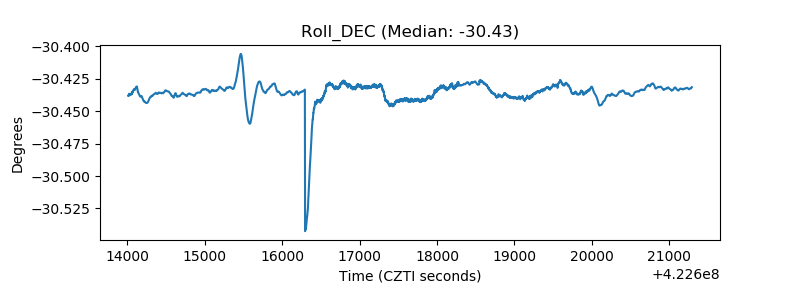 |
| _Roll_RA | 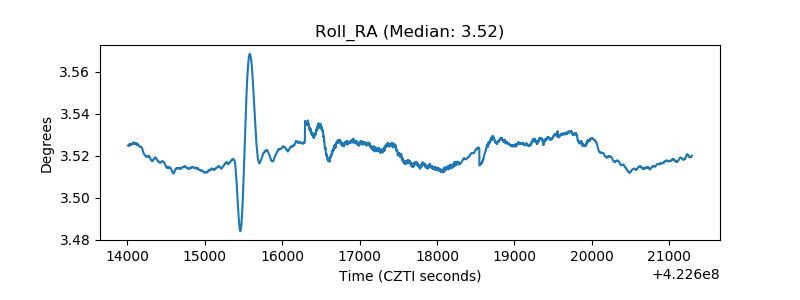 |
| Veto Counter | 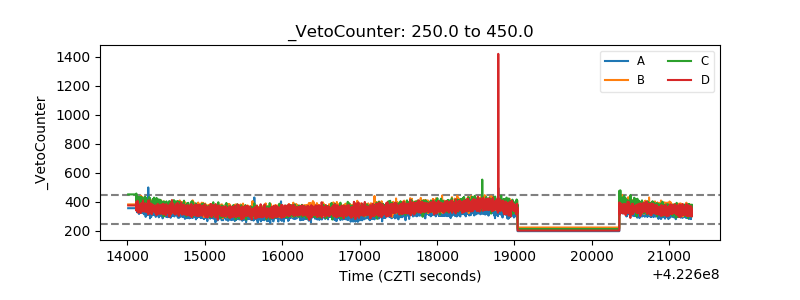 |