| Param | Original file | Final file |
|---|---|---|
| Filename | modeM0/AS1A12_035T01_9000005660_41379cztM0_level2.fits | modeM0/AS1A12_035T01_9000005660_41379cztM0_level2_quad_clean.evt |
| Size (bytes) | 383,431,680 | 97,683,840 |
| Size | 365.7 MB | 93.2 MB |
| Events in quadrant A | 3,204,462 | 654,306 |
| Events in quadrant B | 2,951,329 | 668,108 |
| Events in quadrant C | 3,456,019 | 621,414 |
| Events in quadrant D | 4,107,607 | 588,532 |
| Mode M0 | |||
|---|---|---|---|
| Quadrant | BADHDUFLAG | Total packets | Discarded packets |
| A | 0 | 13018 | 3 |
| B | 0 | 13035 | 2 |
| C | 0 | 14129 | 2 |
| D | 0 | 16223 | 2 |
| Mode SS | |||
|---|---|---|---|
| Quadrant | BADHDUFLAG | Total packets | Discarded packets |
| A | 0 | 126 | 0 |
| B | 0 | 126 | 0 |
| C | 0 | 126 | 0 |
| D | 0 | 126 | 0 |
| Mode M9 | |||
|---|---|---|---|
| Quadrant | BADHDUFLAG | Total packets | Discarded packets |
| A | 0 | 26 | 0 |
| B | 0 | 26 | 0 |
| C | 0 | 26 | 0 |
| D | 0 | 26 | 0 |
| Quadrant | Total seconds | Saturated seconds | Saturation percentage |
|---|---|---|---|
| A | 6092 | 13 | 0.213395% |
| B | 6092 | 25 | 0.410374% |
| C | 6092 | 253 | 4.152988% |
| D | 6092 | 168 | 2.757715% |
Noise dominated data is calculated using 1-second bins in cleaned event files. If a bin has >2000 counts, and if more than 50% of those come from <1% of pixels, then it is considered to be noise-dominated and hence unusable.
| Quadrant | # 1 sec bins | Bins with >0 counts | Bins with >2000 counts | High rate bins dominated by noise | Noise dominated (total time) | Noise dominated (detector-on time) | Marked lightcurve |
|---|---|---|---|---|---|---|---|
| A | 8689 | 6094 | 4 | 4 | 0.05% | 0.07% | 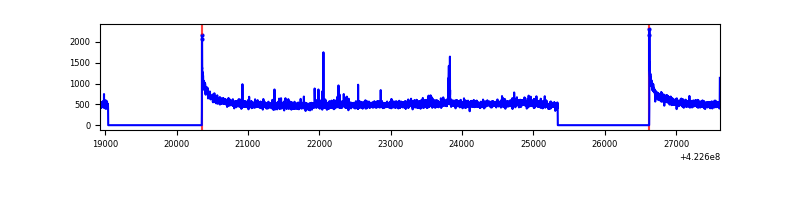 |
| B | 8689 | 6094 | 5 | 5 | 0.06% | 0.08% | 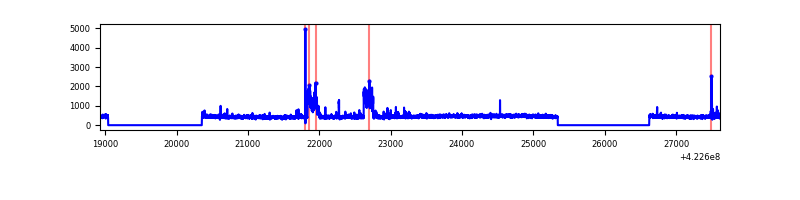 |
| C | 8689 | 6094 | 251 | 251 | 2.89% | 4.12% | 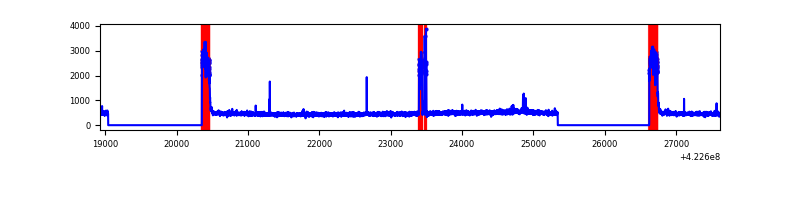 |
| D | 8689 | 6094 | 153 | 153 | 1.76% | 2.51% | 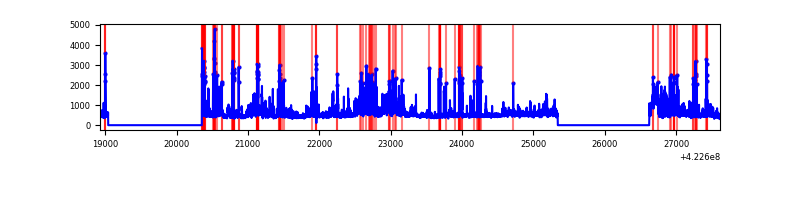 |
Top three noisy pixels from each quadrant. If the there are fewer than three noisy pixels in the level2.evt file, extra rows are filled as -1
| Pixel properties | Quadrant properties | ||||||
|---|---|---|---|---|---|---|---|
| Quadrant | DetID | PixID | Counts | Sigma | Mean | Median | Sigma |
| A | 10 | 83 | 575733 | 4169.38 | 667 | 653 | 137.9 |
| A | 12 | 189 | 15014 | 104.12 | 667 | 653 | 137.9 |
| A | 7 | 3 | 14172 | 98.01 | 667 | 653 | 137.9 |
| B | 0 | 186 | 252153 | 1934.8 | 660 | 641 | 130.0 |
| B | 0 | 190 | 36572 | 276.41 | 660 | 641 | 130.0 |
| B | 5 | 255 | 27492 | 206.56 | 660 | 641 | 130.0 |
| C | 0 | 10 | 587890 | 3880.43 | 637 | 641 | 151.3 |
| C | 15 | 214 | 252862 | 1666.63 | 637 | 641 | 151.3 |
| C | 2 | 16 | 117245 | 770.5 | 637 | 641 | 151.3 |
| D | 1 | 52 | 450207 | 2807.47 | 649 | 629 | 160.1 |
| D | 12 | 79 | 334042 | 2082.05 | 649 | 629 | 160.1 |
| D | 5 | 222 | 242015 | 1507.38 | 649 | 629 | 160.1 |
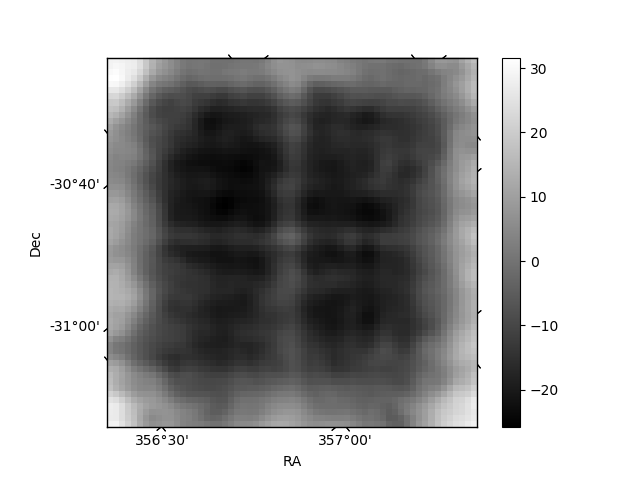
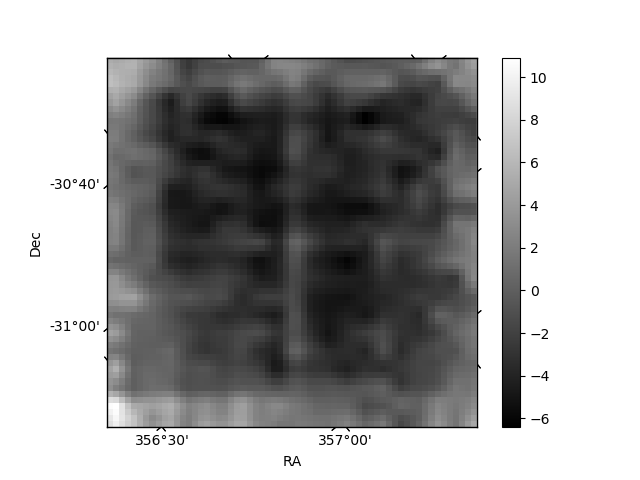
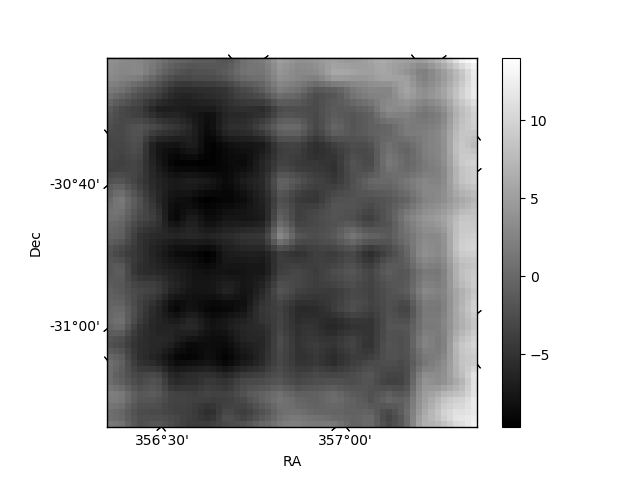
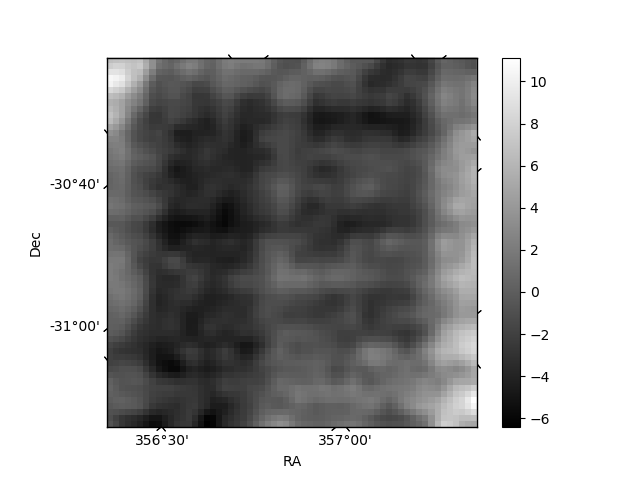
Histogram calculated using DETX and DETY for each event in the final _common_clean file
| Quadrant A | 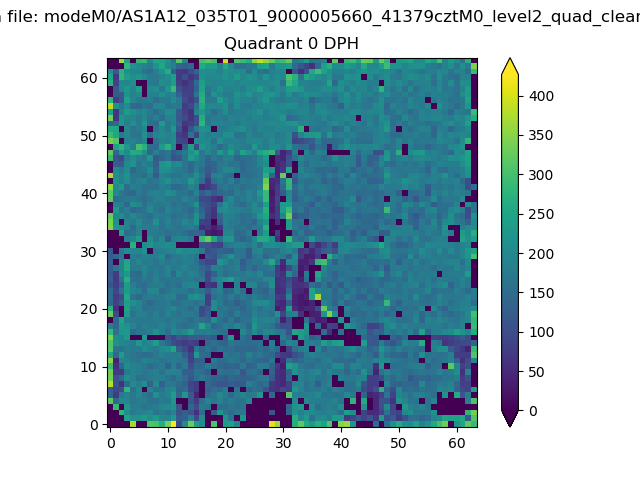 |
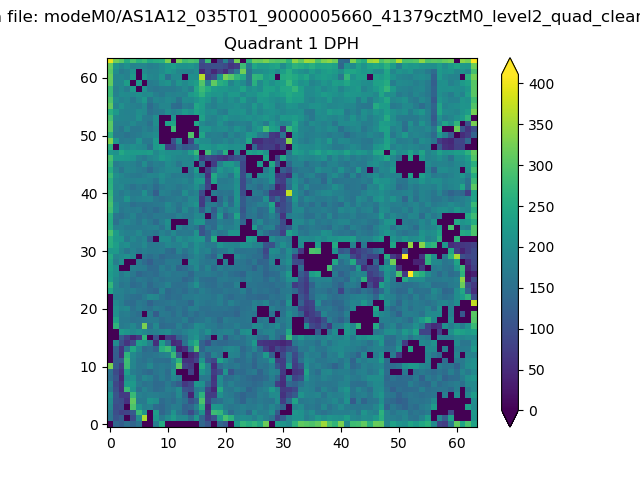 |
Quadrant B |
|---|---|---|---|
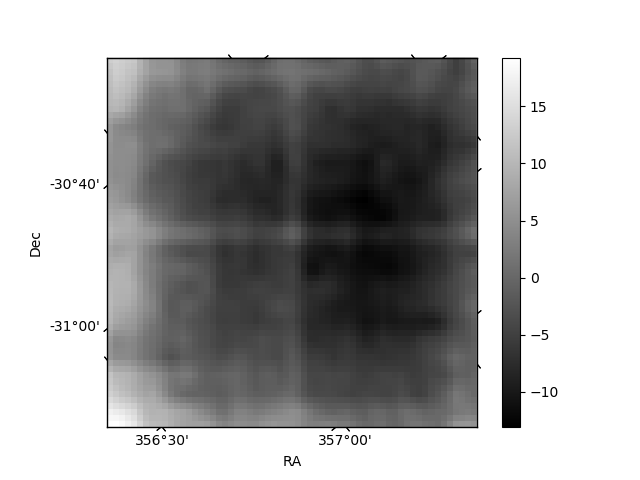
| Quadrant D | 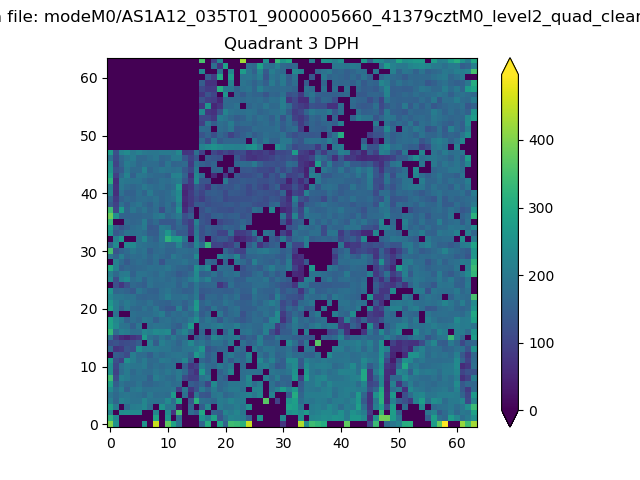 |
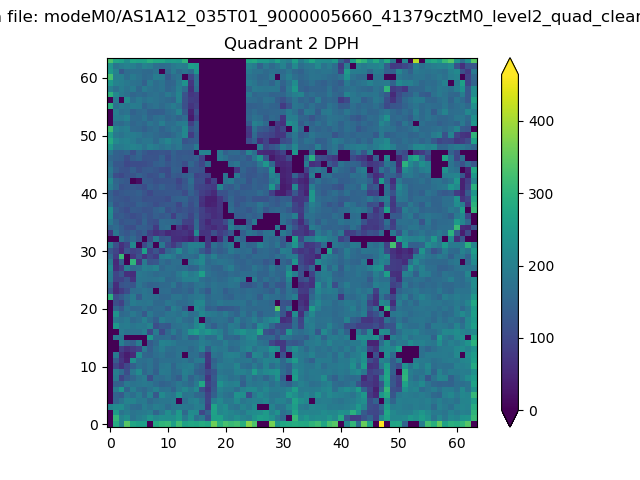 |
Quadrant C |
| Plot type | Count rate plots | Images |
|---|---|---|
| Comparison with Poisson distribution Blue bars denote a histogram of data divided into 1 sec bins. Red curve is a Poisson curve with rate = median count rate of data. |
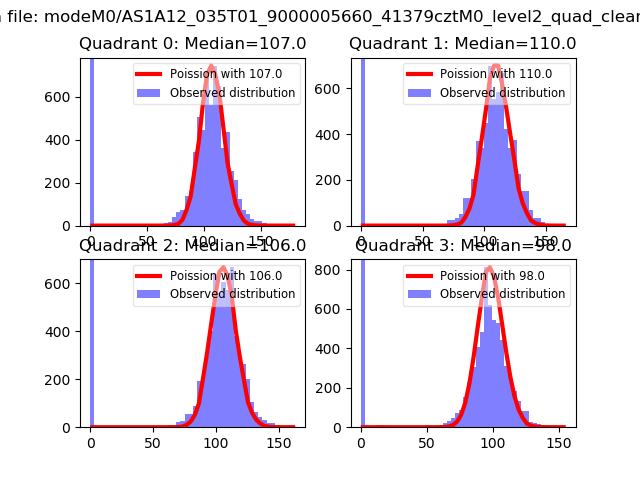 |
 |
| Quadrant-wise count rates Data is divided into 100 sec bins |
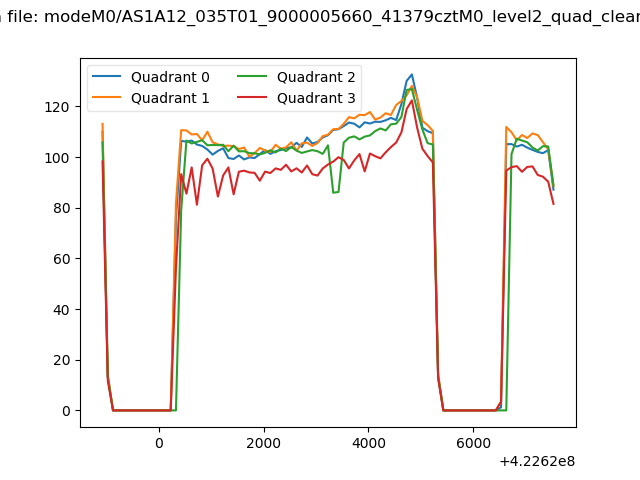 |
|
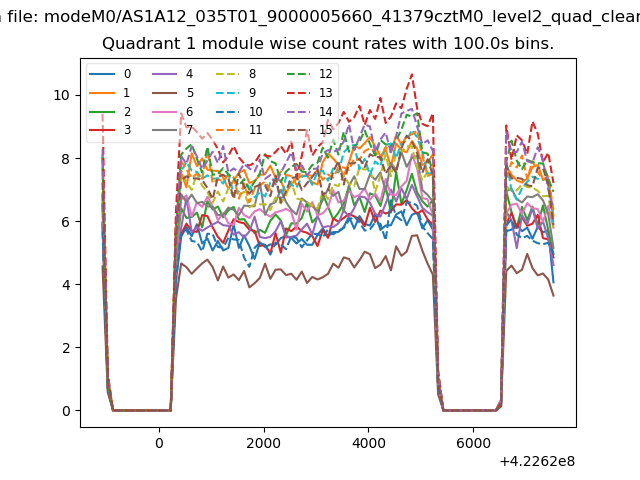
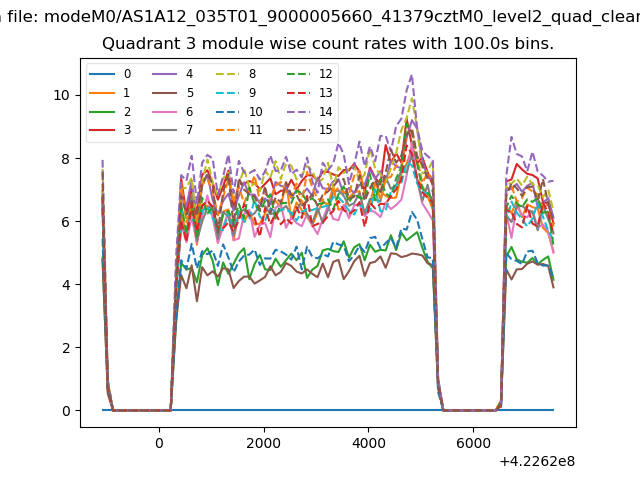
| Module-wise count rates for Quadrant A Data is divided into 100 sec bins |
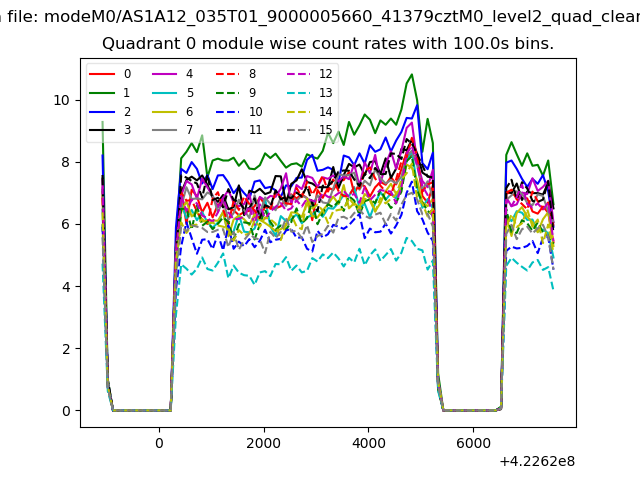 |
 |
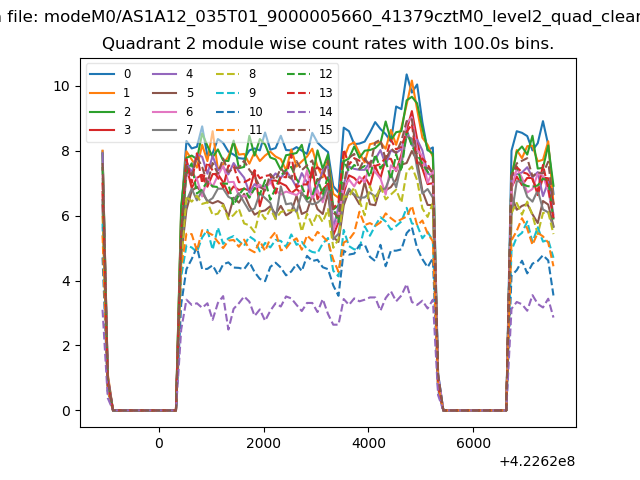
| Module-wise count rates for Quadrant B Data is divided into 100 sec bins |
 |
 |
| Module-wise count rates for Quadrant C Data is divided into 100 sec bins |
 |
 |
| Module-wise count rates for Quadrant D Data is divided into 100 sec bins |
 |
 |
| Parameter | Plot |
|---|---|
| CZT HV Monitor | 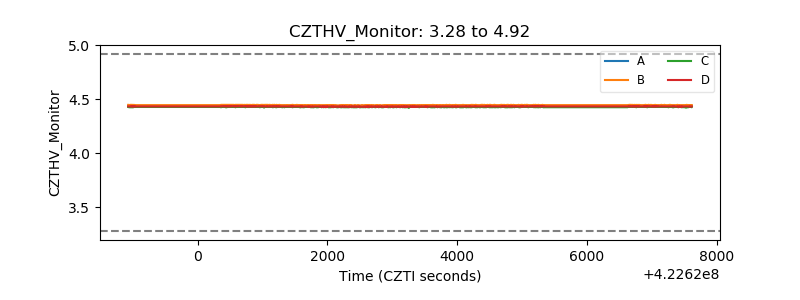 |
| D_VDD | 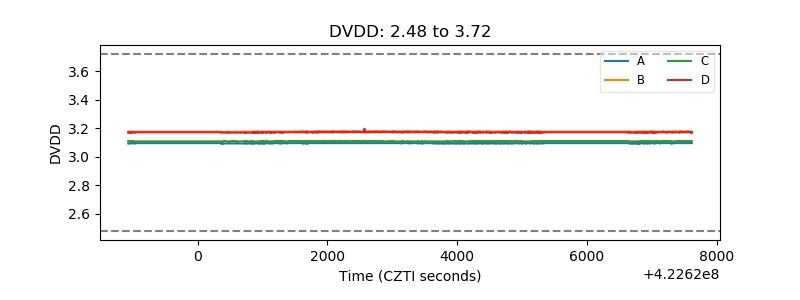 |
| Temperature 1 | 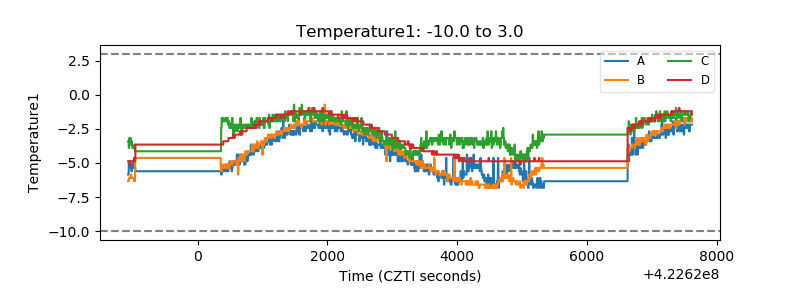 |
| Veto HV Monitor | 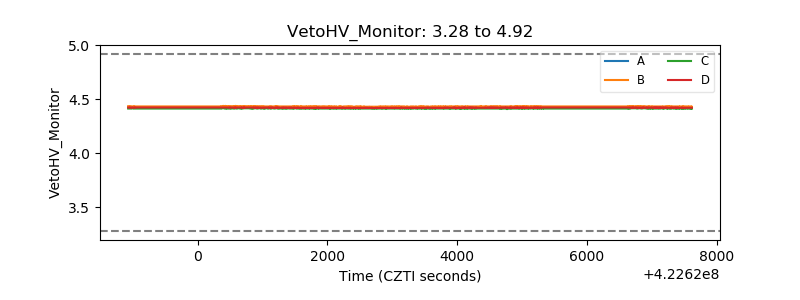 |
| Veto LLD | 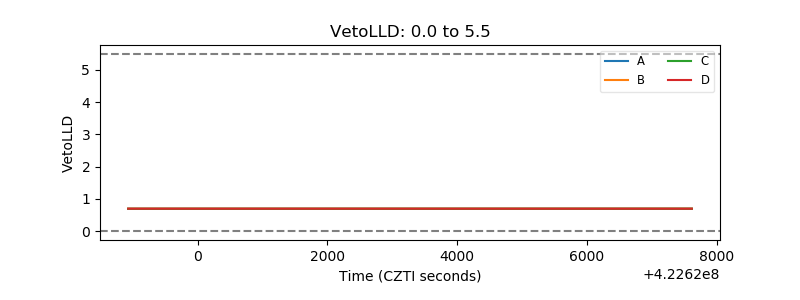 |
| Alpha Counter | 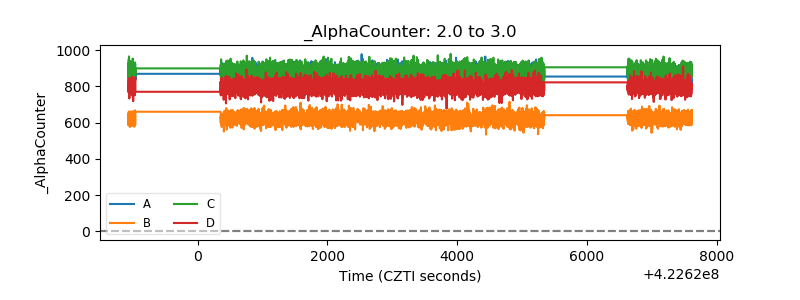 |
| _CPM_Rate | 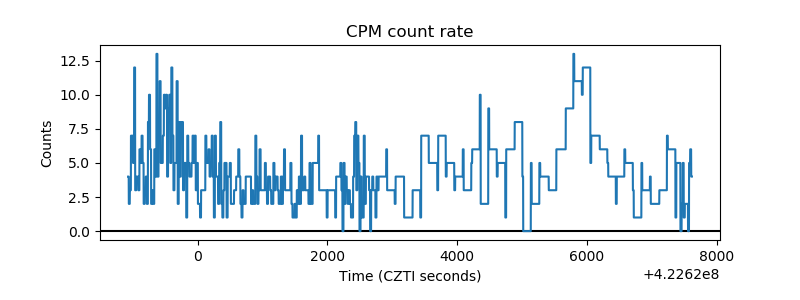 |
| CZT Counter | 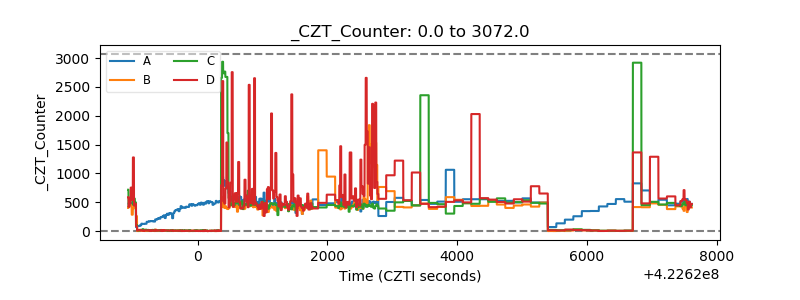 |
| +2.5 Volts monitor | 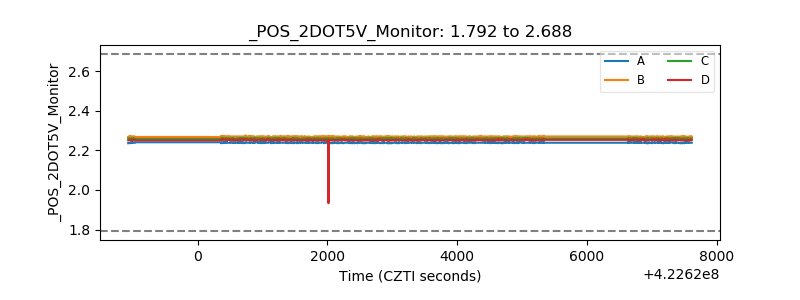 |
| +5 Volts monitor | 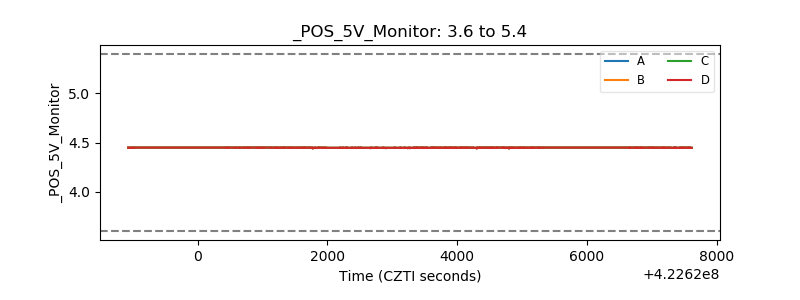 |
| _ROLL_ROT | 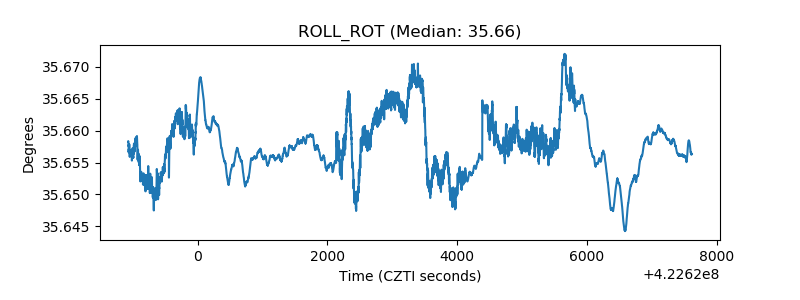 |
| _Roll_DEC | 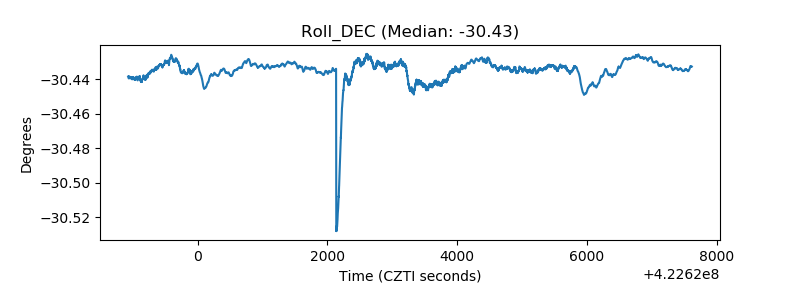 |
| _Roll_RA | 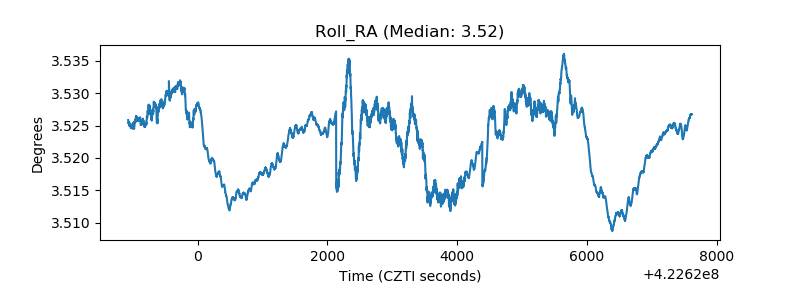 |
| Veto Counter | 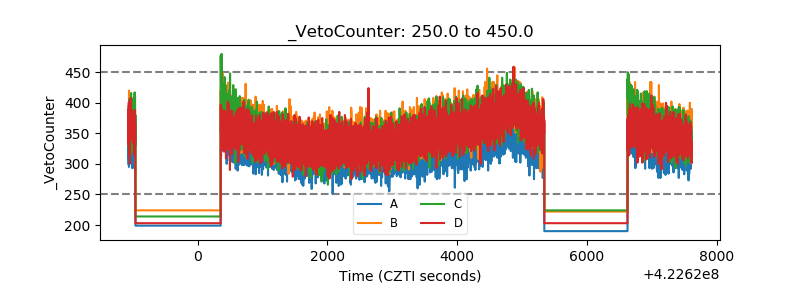 |