| Param | Original file | Final file |
|---|---|---|
| Filename | modeM0/AS1A12_035T01_9000005660_41381cztM0_level2.fits | modeM0/AS1A12_035T01_9000005660_41381cztM0_level2_quad_clean.evt |
| Size (bytes) | 666,336,960 | 173,266,560 |
| Size | 635.5 MB | 165.2 MB |
| Events in quadrant A | 5,738,300 | 1,164,641 |
| Events in quadrant B | 5,395,084 | 1,166,681 |
| Events in quadrant C | 5,822,373 | 1,105,996 |
| Events in quadrant D | 6,864,928 | 1,053,999 |
| Mode M0 | |||
|---|---|---|---|
| Quadrant | BADHDUFLAG | Total packets | Discarded packets |
| A | 0 | 23345 | 4 |
| B | 0 | 23624 | 3 |
| C | 0 | 24172 | 3 |
| D | 0 | 27687 | 3 |
| Mode SS | |||
|---|---|---|---|
| Quadrant | BADHDUFLAG | Total packets | Discarded packets |
| A | 0 | 226 | 0 |
| B | 0 | 226 | 0 |
| C | 0 | 226 | 0 |
| D | 0 | 226 | 0 |
| Mode M9 | |||
|---|---|---|---|
| Quadrant | BADHDUFLAG | Total packets | Discarded packets |
| A | 0 | 40 | 0 |
| B | 0 | 40 | 0 |
| C | 0 | 40 | 0 |
| D | 0 | 40 | 0 |
| Quadrant | Total seconds | Saturated seconds | Saturation percentage |
|---|---|---|---|
| A | 10893 | 34 | 0.312127% |
| B | 10893 | 99 | 0.908841% |
| C | 10893 | 323 | 2.965207% |
| D | 10893 | 211 | 1.937024% |
Noise dominated data is calculated using 1-second bins in cleaned event files. If a bin has >2000 counts, and if more than 50% of those come from <1% of pixels, then it is considered to be noise-dominated and hence unusable.
| Quadrant | # 1 sec bins | Bins with >0 counts | Bins with >2000 counts | High rate bins dominated by noise | Noise dominated (total time) | Noise dominated (detector-on time) | Marked lightcurve |
|---|---|---|---|---|---|---|---|
| A | 14953 | 10896 | 13 | 13 | 0.09% | 0.12% | 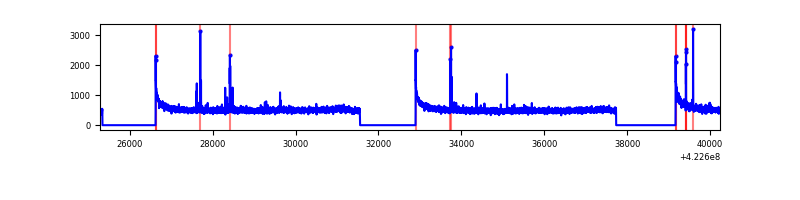 |
| B | 14953 | 10896 | 56 | 56 | 0.37% | 0.51% | 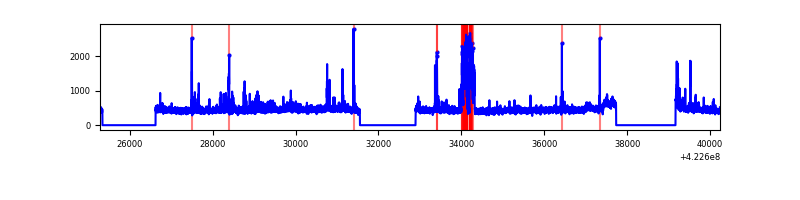 |
| C | 14953 | 10896 | 320 | 320 | 2.14% | 2.94% | 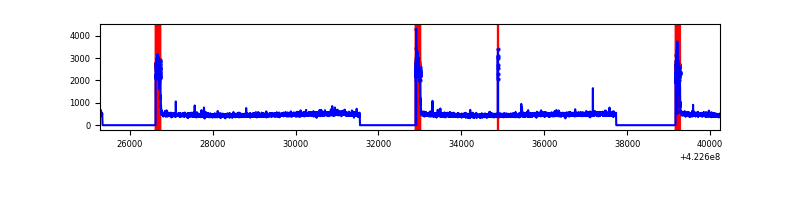 |
| D | 14953 | 10896 | 179 | 179 | 1.20% | 1.64% | 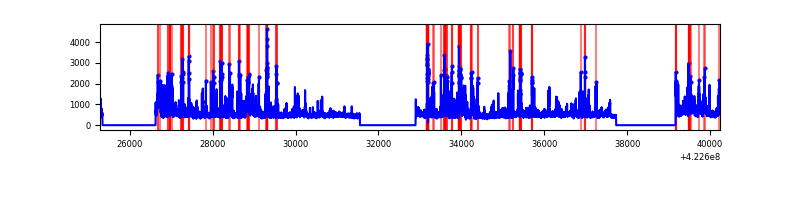 |
Top three noisy pixels from each quadrant. If the there are fewer than three noisy pixels in the level2.evt file, extra rows are filled as -1
| Pixel properties | Quadrant properties | ||||||
|---|---|---|---|---|---|---|---|
| Quadrant | DetID | PixID | Counts | Sigma | Mean | Median | Sigma |
| A | 10 | 83 | 995335 | 4048.2 | 1195 | 1167 | 245.6 |
| A | 13 | 248 | 78211 | 313.72 | 1195 | 1167 | 245.6 |
| A | 12 | 189 | 30868 | 120.94 | 1195 | 1167 | 245.6 |
| B | 0 | 186 | 390086 | 1707.51 | 1181 | 1145 | 227.8 |
| B | 0 | 229 | 160455 | 699.39 | 1181 | 1145 | 227.8 |
| B | 5 | 255 | 75794 | 327.72 | 1181 | 1145 | 227.8 |
| C | 0 | 10 | 855776 | 3192.83 | 1148 | 1153 | 267.7 |
| C | 15 | 214 | 454147 | 1692.37 | 1148 | 1153 | 267.7 |
| C | 2 | 16 | 20941 | 73.93 | 1148 | 1153 | 267.7 |
| D | 5 | 222 | 684798 | 2402.77 | 1163 | 1130 | 284.5 |
| D | 13 | 249 | 482651 | 1692.32 | 1163 | 1130 | 284.5 |
| D | 1 | 52 | 397510 | 1393.09 | 1163 | 1130 | 284.5 |
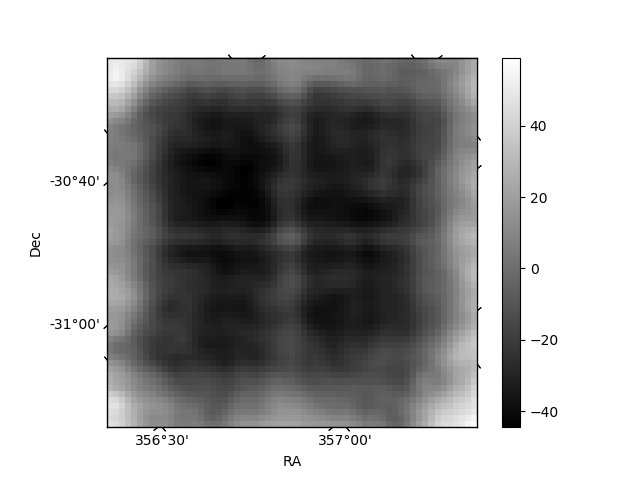
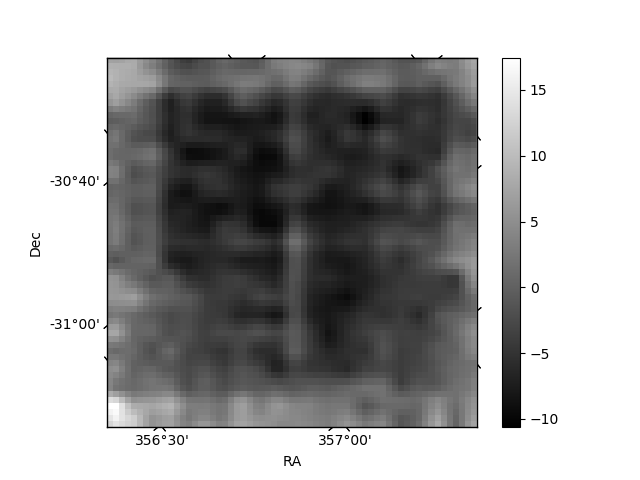
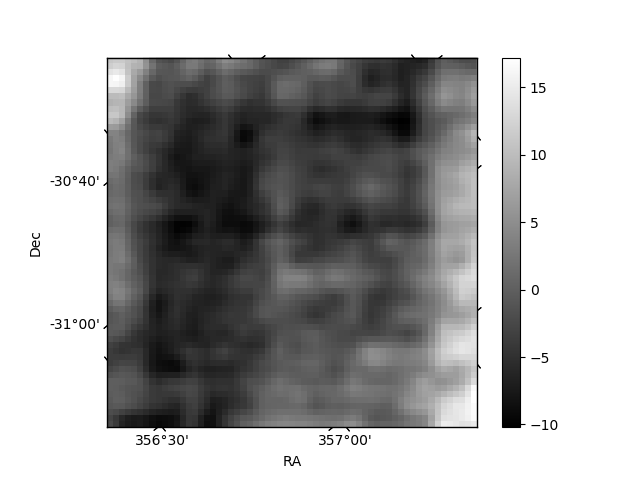
Histogram calculated using DETX and DETY for each event in the final _common_clean file
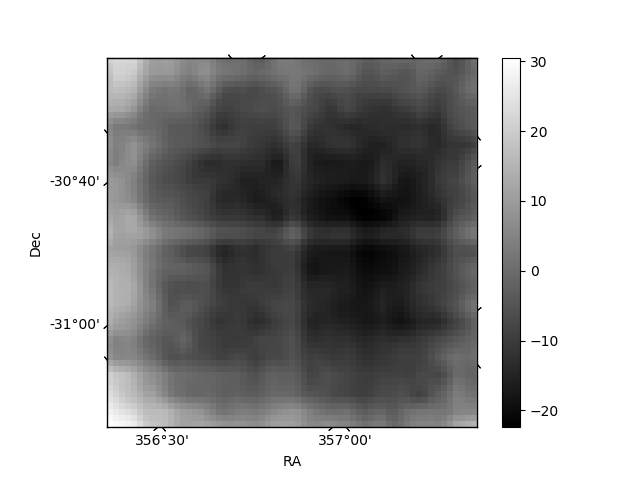
| Quadrant A | 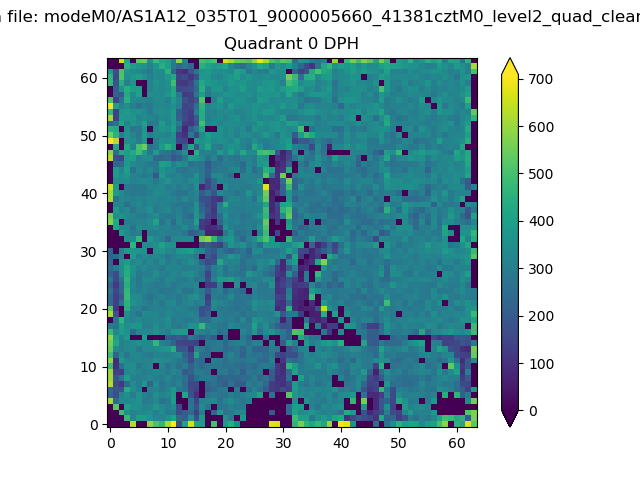 |
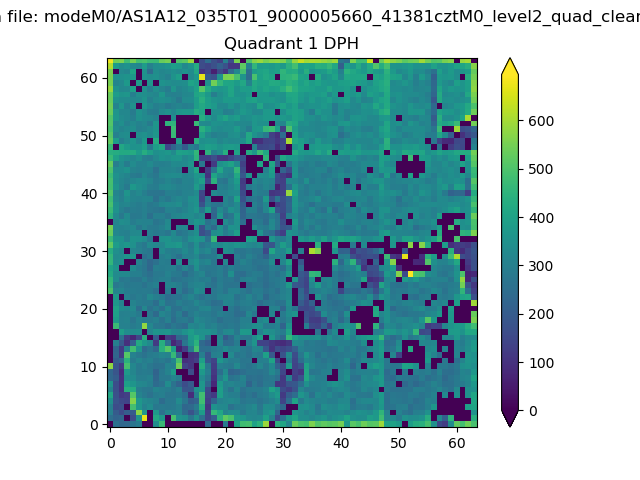 |
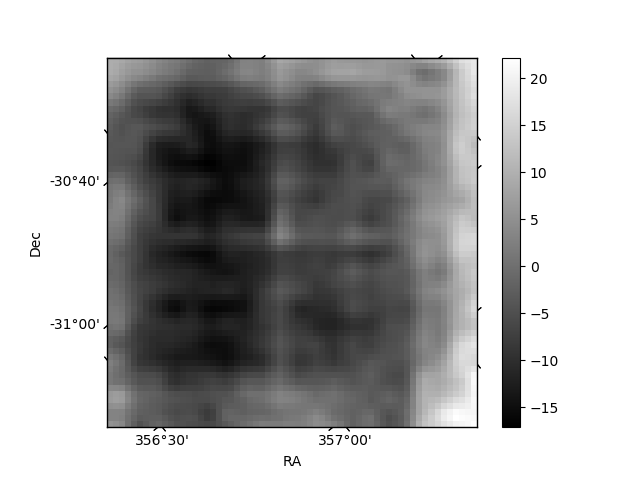
Quadrant B |
|---|---|---|---|
| Quadrant D | 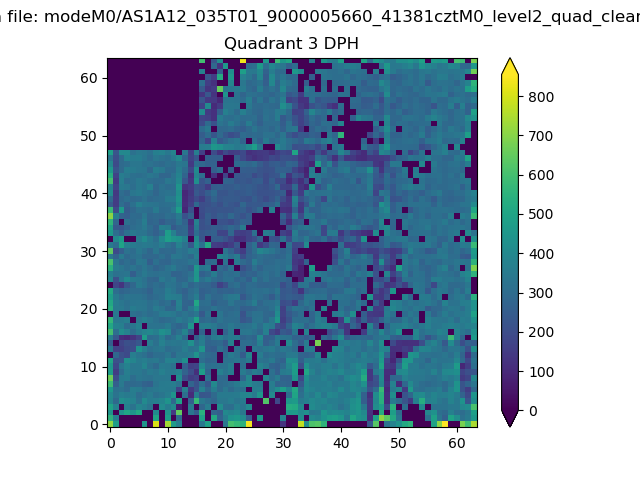 |
 |
Quadrant C |
| Plot type | Count rate plots | Images |
|---|---|---|
| Comparison with Poisson distribution Blue bars denote a histogram of data divided into 1 sec bins. Red curve is a Poisson curve with rate = median count rate of data. |
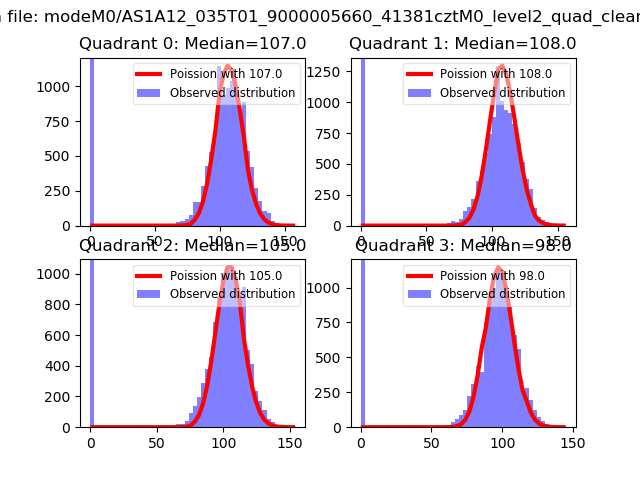 |
 |
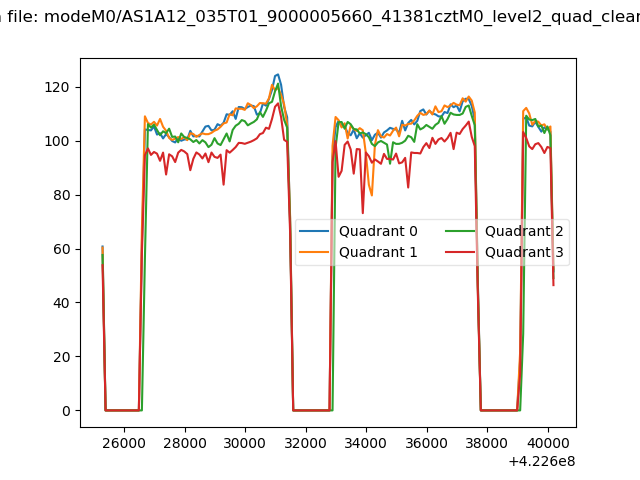
| Quadrant-wise count rates Data is divided into 100 sec bins |
 |
|
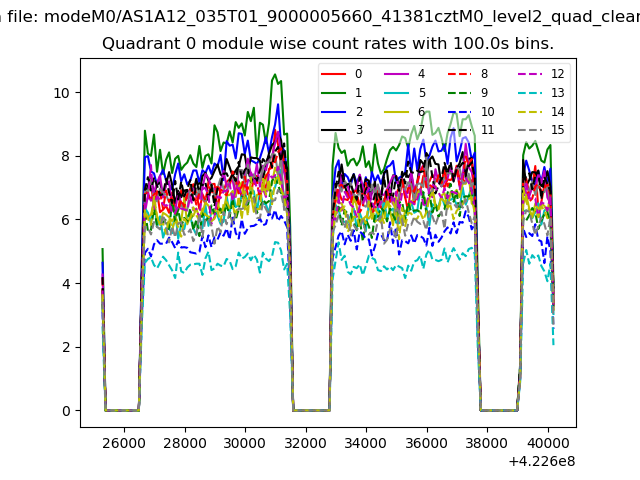
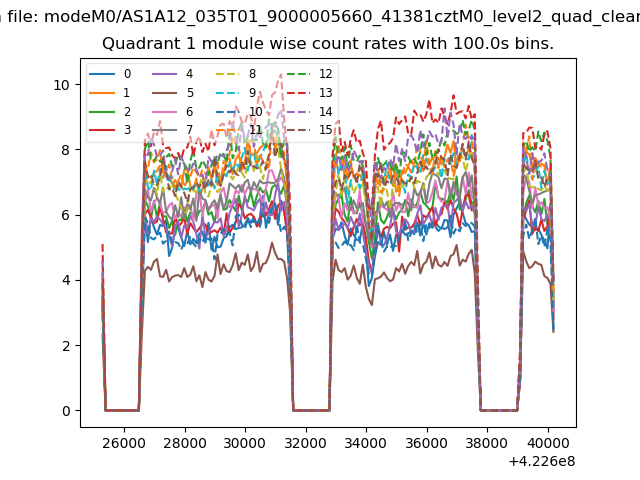
| Module-wise count rates for Quadrant A Data is divided into 100 sec bins |
 |
 |
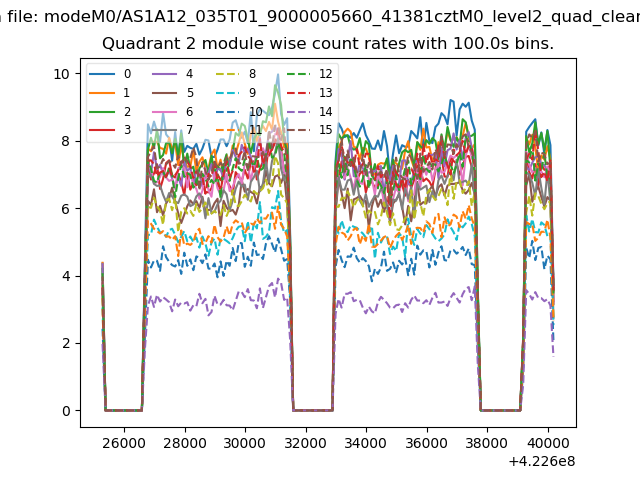
| Module-wise count rates for Quadrant B Data is divided into 100 sec bins |
 |
 |
| Module-wise count rates for Quadrant C Data is divided into 100 sec bins |
 |
 |
| Module-wise count rates for Quadrant D Data is divided into 100 sec bins |
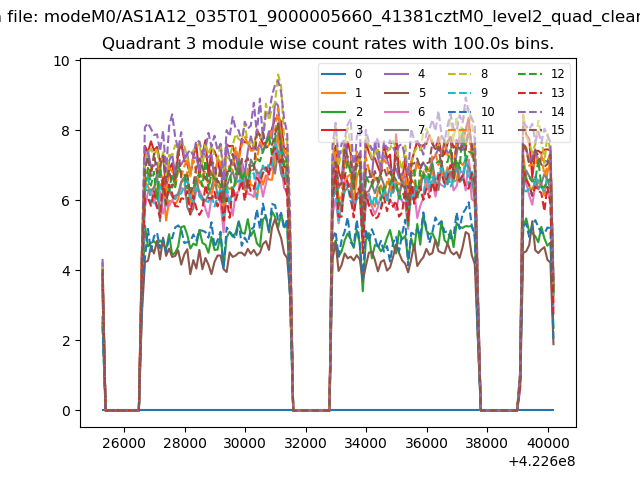 |
 |
| Parameter | Plot |
|---|---|
| CZT HV Monitor | 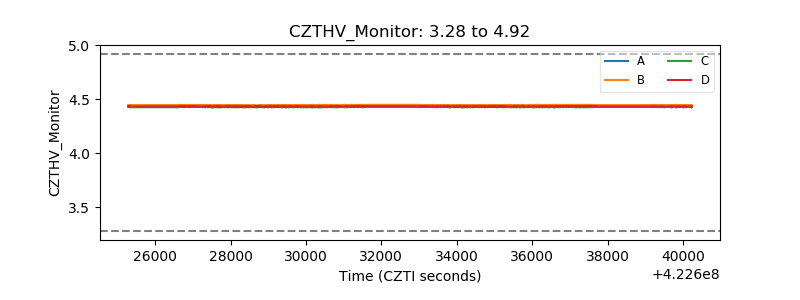 |
| D_VDD | 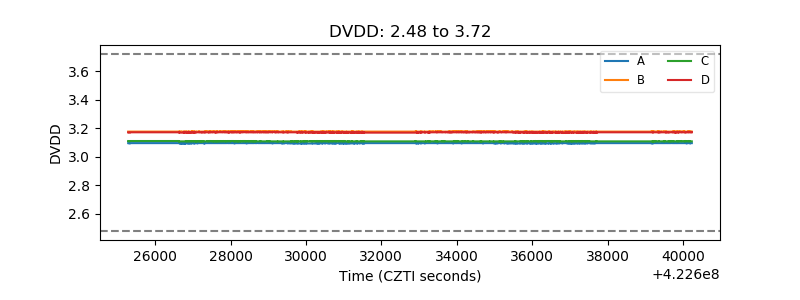 |
| Temperature 1 | 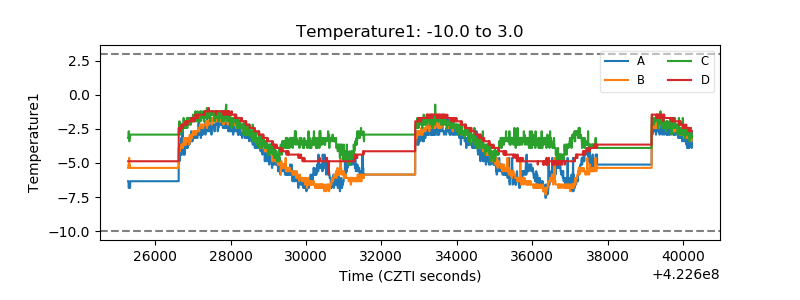 |
| Veto HV Monitor | 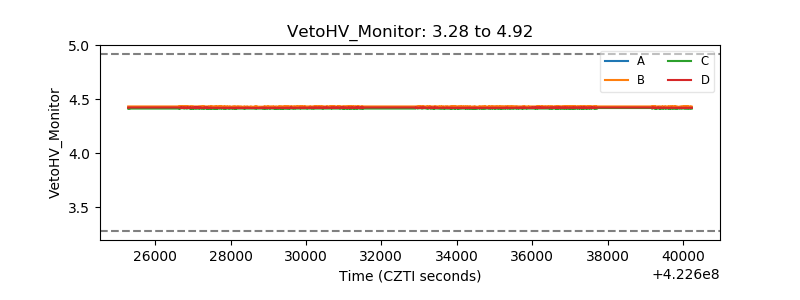 |
| Veto LLD | 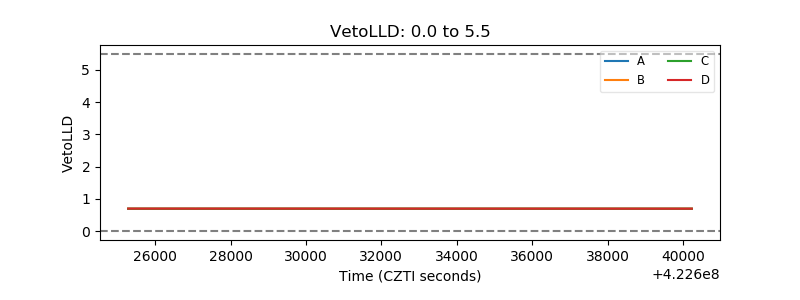 |
| Alpha Counter | 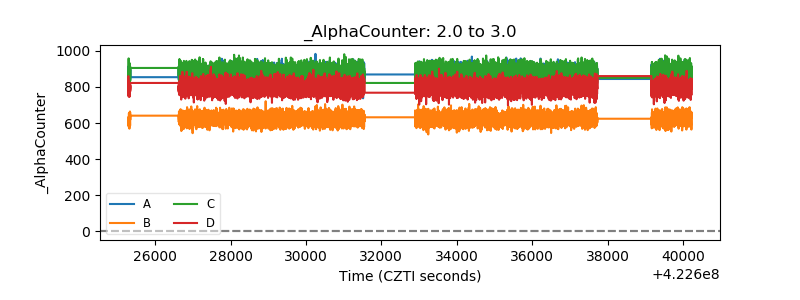 |
| _CPM_Rate |  |
| CZT Counter |  |
| +2.5 Volts monitor |  |
| +5 Volts monitor | 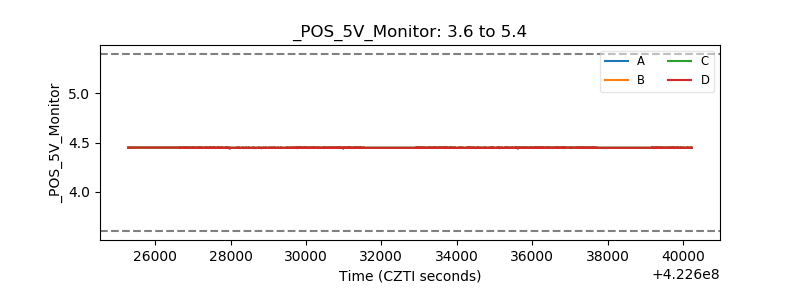 |
| _ROLL_ROT | 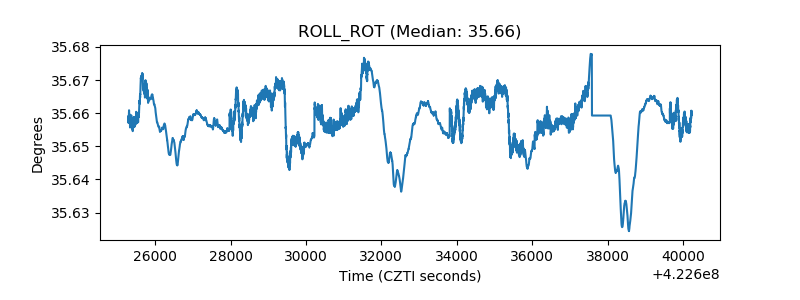 |
| _Roll_DEC | 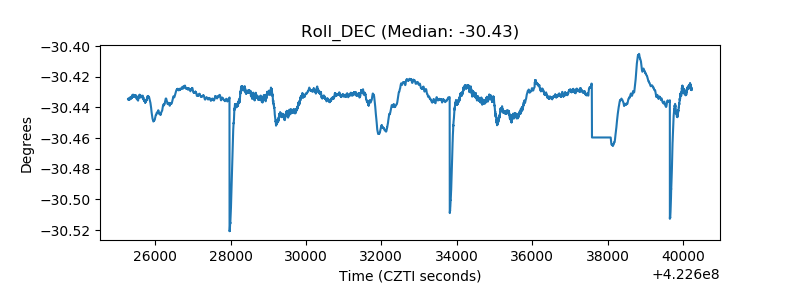 |
| _Roll_RA | 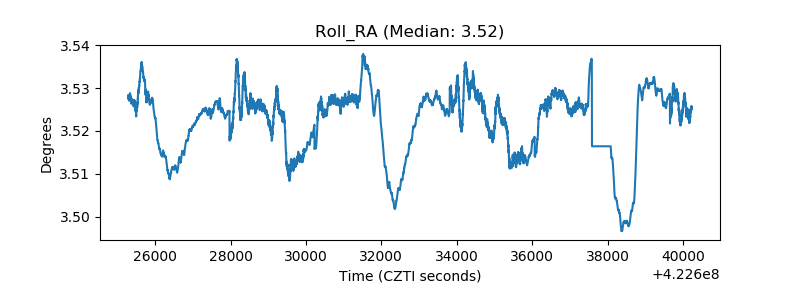 |
| Veto Counter | 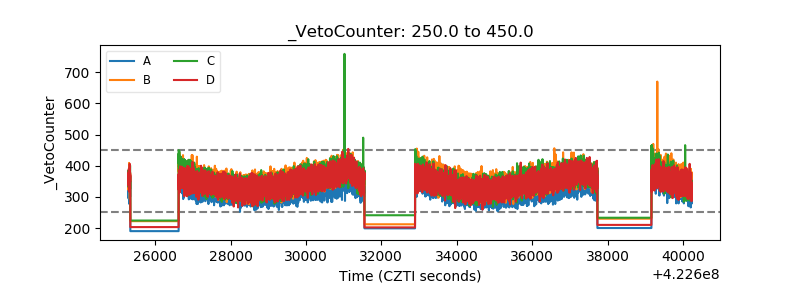 |