| Param | Original file | Final file |
|---|---|---|
| Filename | modeM0/AS1A12_035T01_9000005660_41382cztM0_level2.fits | modeM0/AS1A12_035T01_9000005660_41382cztM0_level2_quad_clean.evt |
| Size (bytes) | 336,228,480 | 90,552,960 |
| Size | 320.7 MB | 86.4 MB |
| Events in quadrant A | 3,014,611 | 608,188 |
| Events in quadrant B | 2,588,738 | 620,607 |
| Events in quadrant C | 3,070,479 | 571,105 |
| Events in quadrant D | 3,335,499 | 549,760 |
| Mode M0 | |||
|---|---|---|---|
| Quadrant | BADHDUFLAG | Total packets | Discarded packets |
| A | 0 | 12372 | 3 |
| B | 0 | 11618 | 2 |
| C | 0 | 12684 | 2 |
| D | 0 | 13733 | 2 |
| Mode SS | |||
|---|---|---|---|
| Quadrant | BADHDUFLAG | Total packets | Discarded packets |
| A | 0 | 114 | 0 |
| B | 0 | 114 | 0 |
| C | 0 | 114 | 0 |
| D | 0 | 114 | 0 |
| Mode M9 | |||
|---|---|---|---|
| Quadrant | BADHDUFLAG | Total packets | Discarded packets |
| A | 0 | 24 | 0 |
| B | 0 | 24 | 0 |
| C | 0 | 24 | 0 |
| D | 0 | 25 | 0 |
| Quadrant | Total seconds | Saturated seconds | Saturation percentage |
|---|---|---|---|
| A | 5607 | 28 | 0.499376% |
| B | 5607 | 10 | 0.178348% |
| C | 5607 | 208 | 3.709649% |
| D | 5607 | 66 | 1.177100% |
Noise dominated data is calculated using 1-second bins in cleaned event files. If a bin has >2000 counts, and if more than 50% of those come from <1% of pixels, then it is considered to be noise-dominated and hence unusable.
| Quadrant | # 1 sec bins | Bins with >0 counts | Bins with >2000 counts | High rate bins dominated by noise | Noise dominated (total time) | Noise dominated (detector-on time) | Marked lightcurve |
|---|---|---|---|---|---|---|---|
| A | 7160 | 5608 | 9 | 9 | 0.13% | 0.16% | 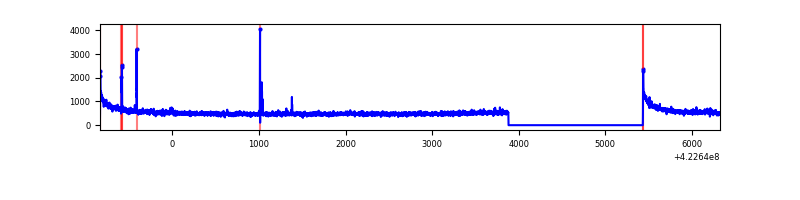 |
| B | 7160 | 5608 | 1 | 1 | 0.01% | 0.02% | 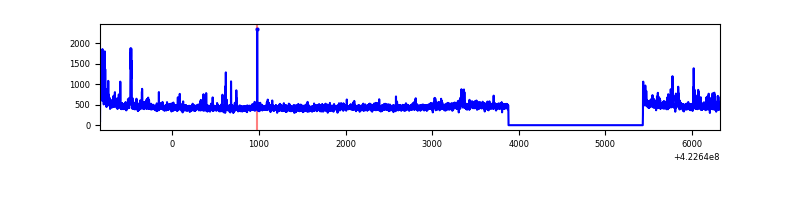 |
| C | 7160 | 5608 | 198 | 198 | 2.77% | 3.53% | 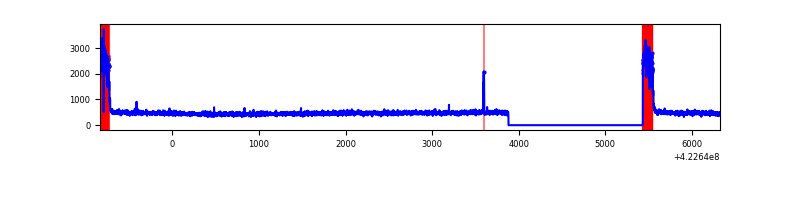 |
| D | 7160 | 5608 | 43 | 43 | 0.60% | 0.77% | 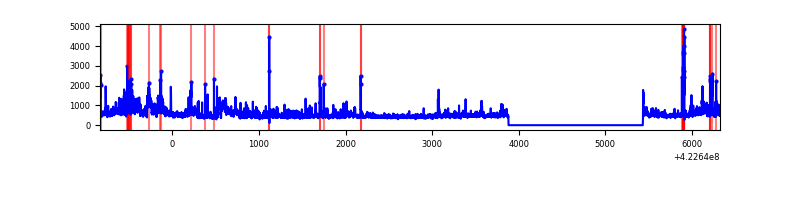 |
Top three noisy pixels from each quadrant. If the there are fewer than three noisy pixels in the level2.evt file, extra rows are filled as -1
| Pixel properties | Quadrant properties | ||||||
|---|---|---|---|---|---|---|---|
| Quadrant | DetID | PixID | Counts | Sigma | Mean | Median | Sigma |
| A | 10 | 83 | 559556 | 4429.27 | 616 | 603 | 126.2 |
| A | 13 | 248 | 37247 | 290.38 | 616 | 603 | 126.2 |
| A | 12 | 189 | 19860 | 152.6 | 616 | 603 | 126.2 |
| B | 0 | 190 | 60603 | 501.73 | 612 | 593 | 119.6 |
| B | 0 | 229 | 41660 | 343.35 | 612 | 593 | 119.6 |
| B | 5 | 255 | 29321 | 240.19 | 612 | 593 | 119.6 |
| C | 0 | 10 | 541513 | 3939.89 | 585 | 587 | 137.3 |
| C | 15 | 214 | 232334 | 1687.95 | 585 | 587 | 137.3 |
| C | 2 | 16 | 12379 | 85.89 | 585 | 587 | 137.3 |
| D | 1 | 52 | 285599 | 1941.33 | 599 | 581 | 146.8 |
| D | 12 | 79 | 214549 | 1457.39 | 599 | 581 | 146.8 |
| D | 1 | 47 | 155837 | 1057.49 | 599 | 581 | 146.8 |
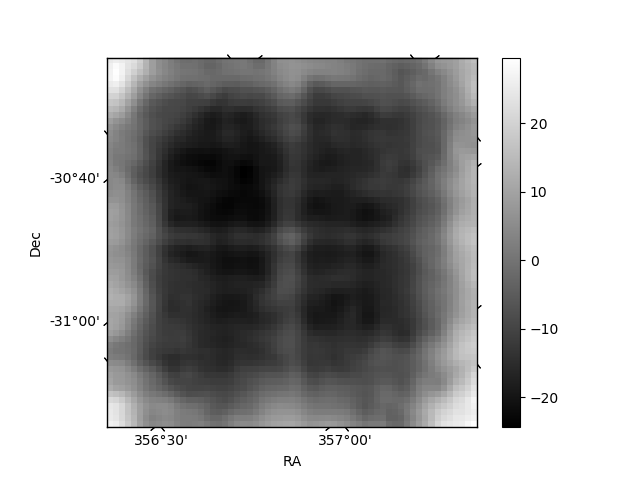
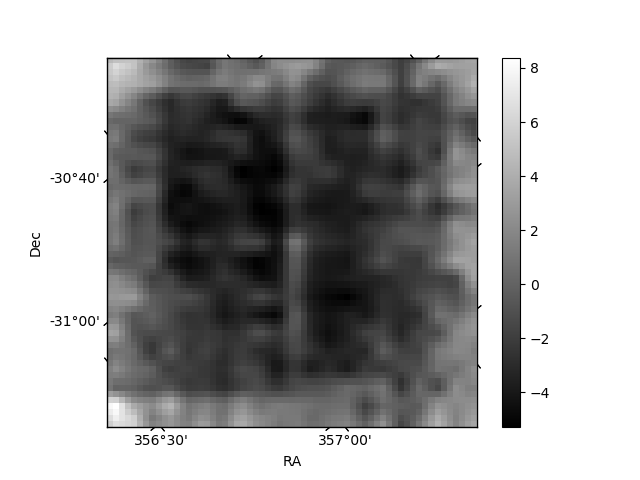
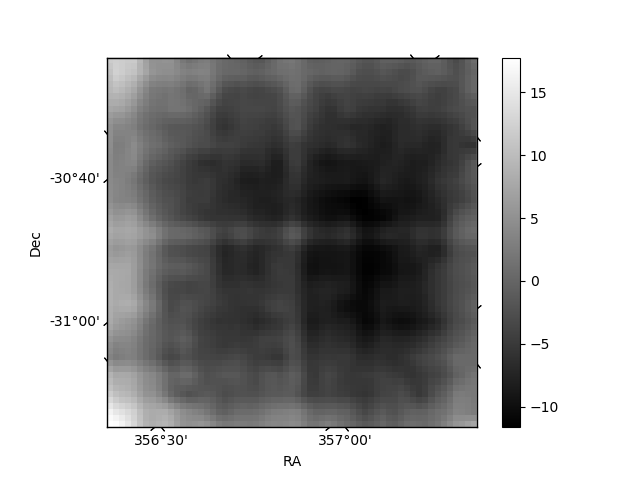
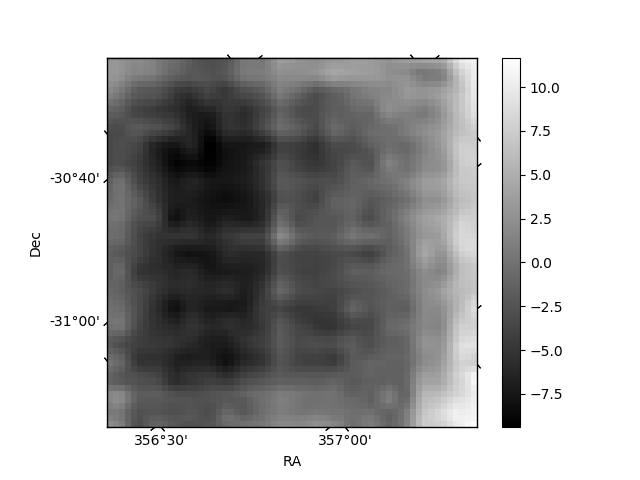
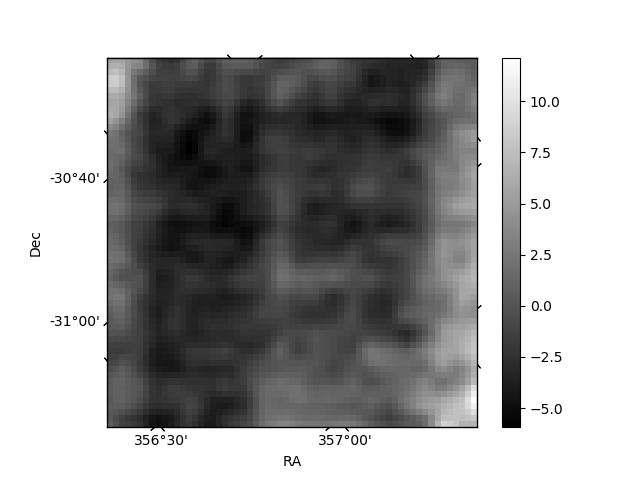
Histogram calculated using DETX and DETY for each event in the final _common_clean file
| Quadrant A | 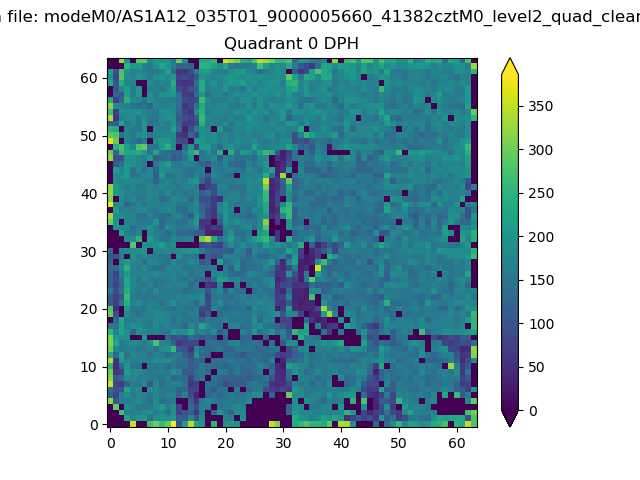 |
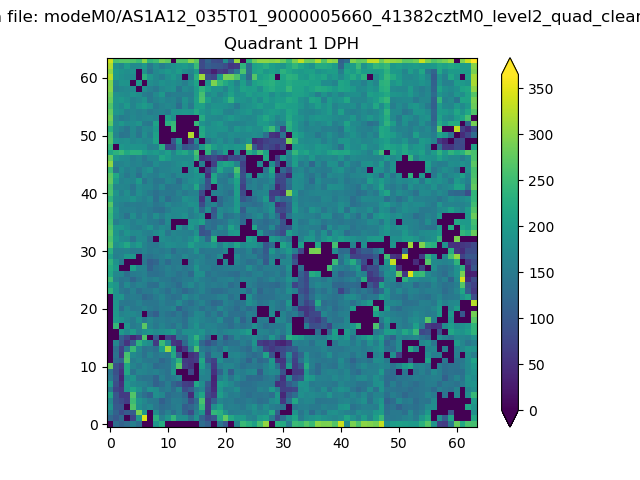 |
Quadrant B |
|---|---|---|---|
| Quadrant D | 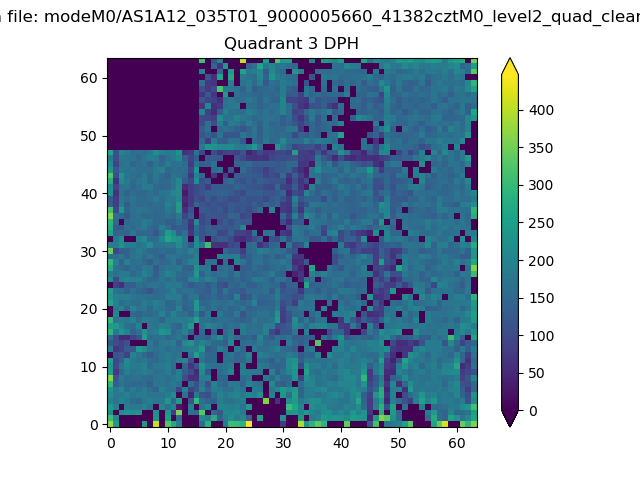 |
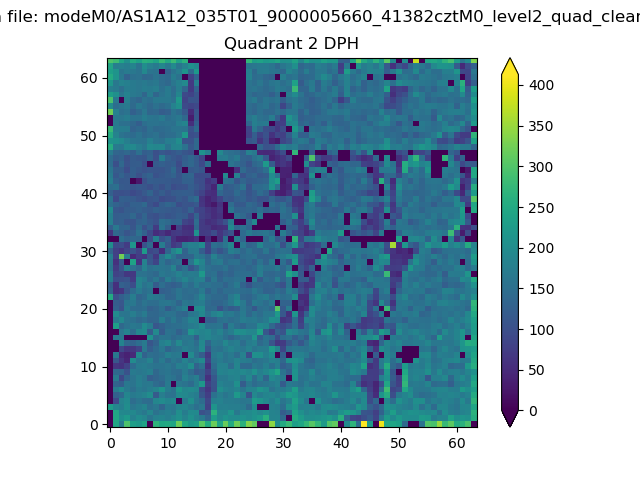 |
Quadrant C |
| Plot type | Count rate plots | Images |
|---|---|---|
| Comparison with Poisson distribution Blue bars denote a histogram of data divided into 1 sec bins. Red curve is a Poisson curve with rate = median count rate of data. |
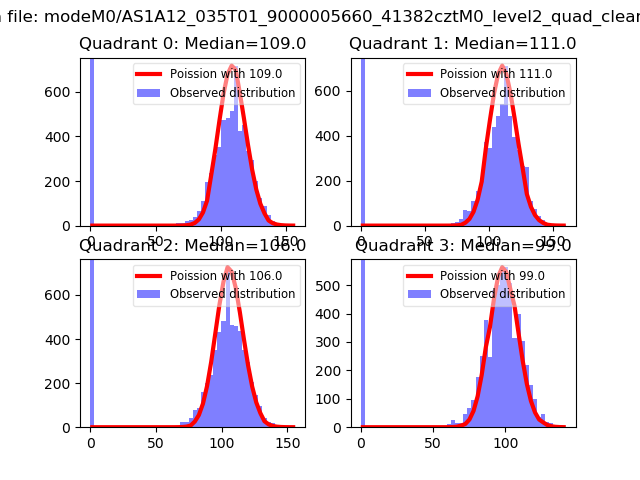 |
 |
| Quadrant-wise count rates Data is divided into 100 sec bins |
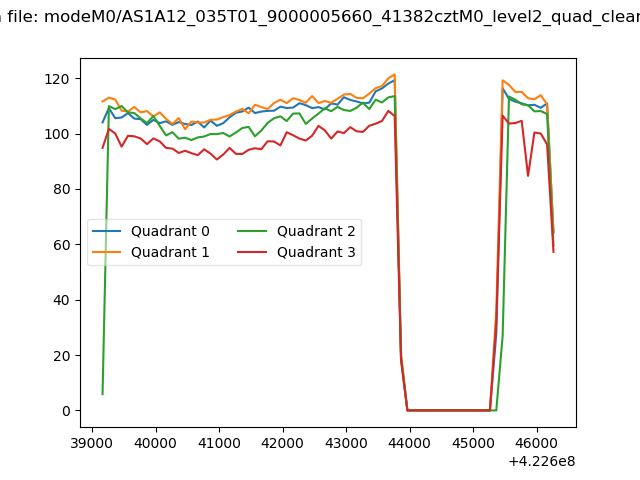 |
|
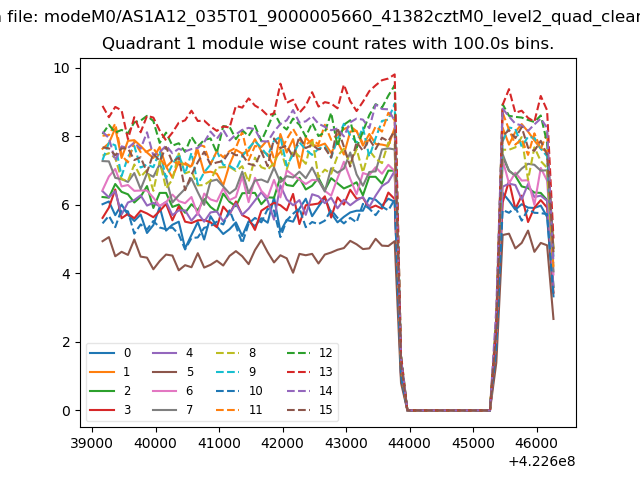
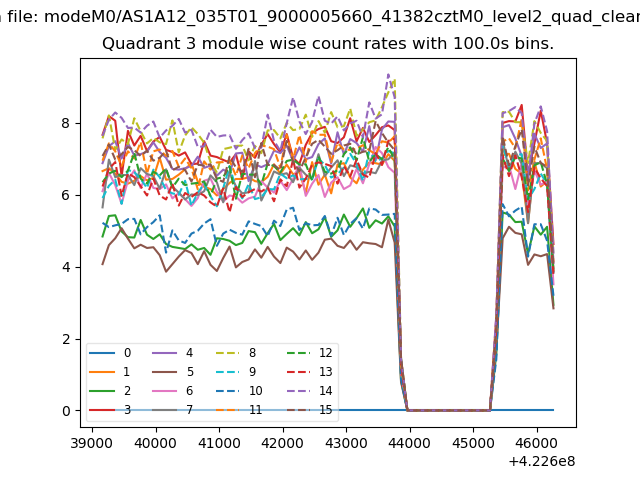
| Module-wise count rates for Quadrant A Data is divided into 100 sec bins |
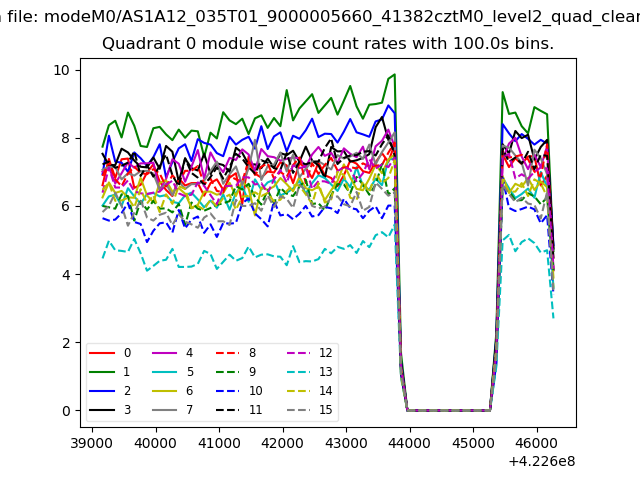 |
 |
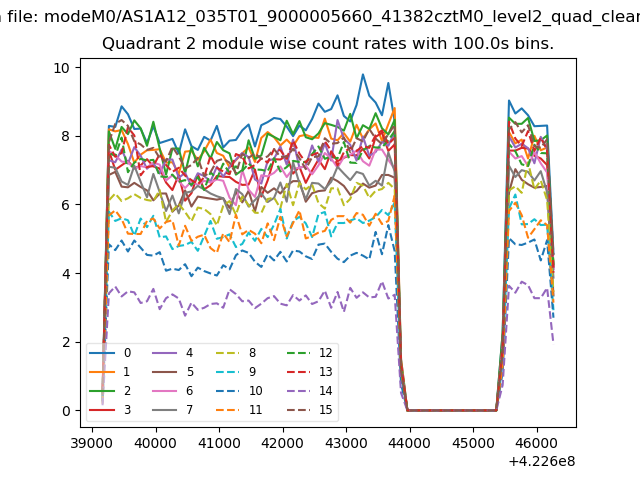
| Module-wise count rates for Quadrant B Data is divided into 100 sec bins |
 |
 |
| Module-wise count rates for Quadrant C Data is divided into 100 sec bins |
 |
 |
| Module-wise count rates for Quadrant D Data is divided into 100 sec bins |
 |
 |
| Parameter | Plot |
|---|---|
| CZT HV Monitor | 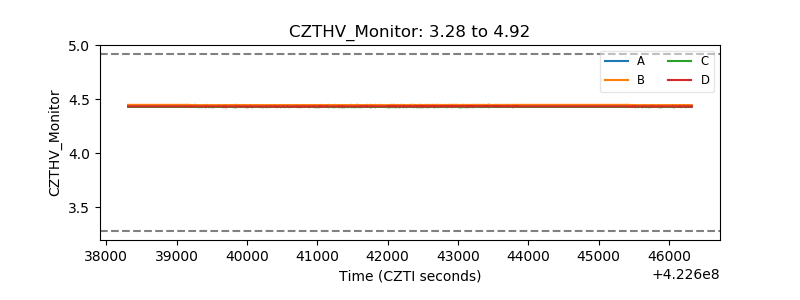 |
| D_VDD | 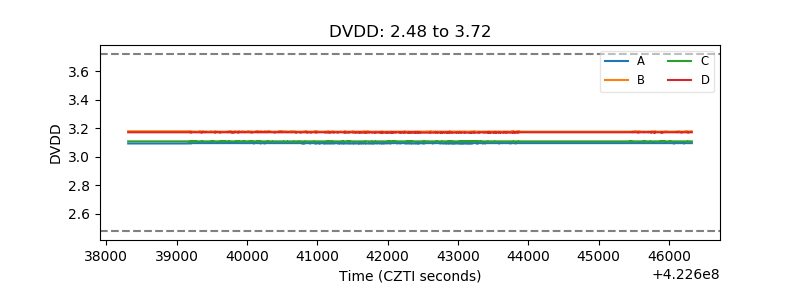 |
| Temperature 1 | 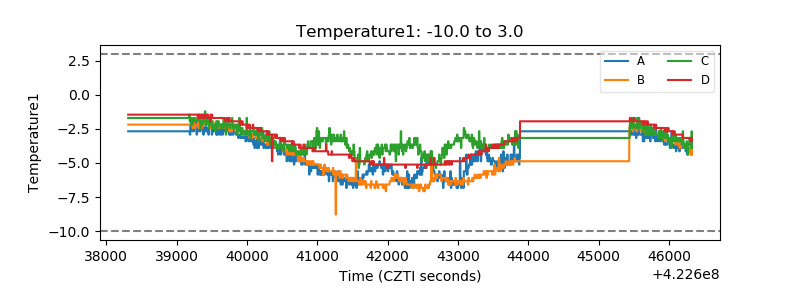 |
| Veto HV Monitor | 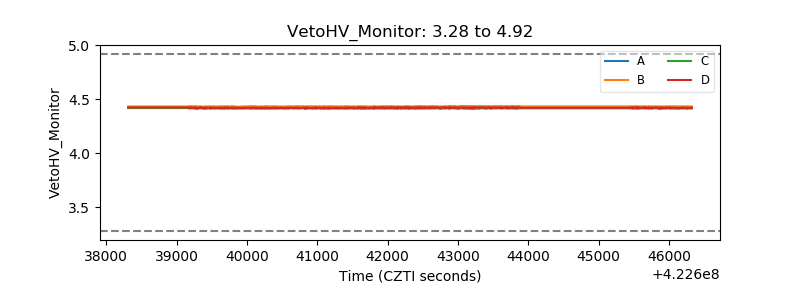 |
| Veto LLD | 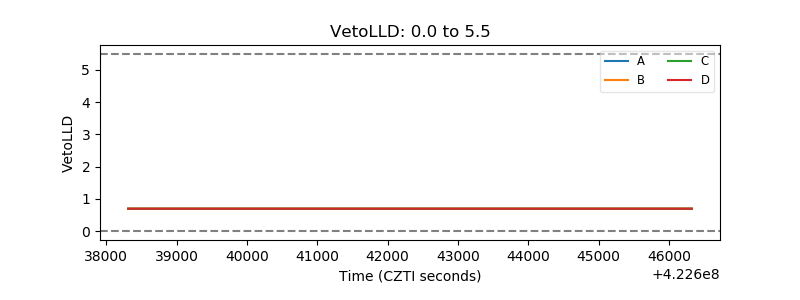 |
| Alpha Counter |  |
| _CPM_Rate | 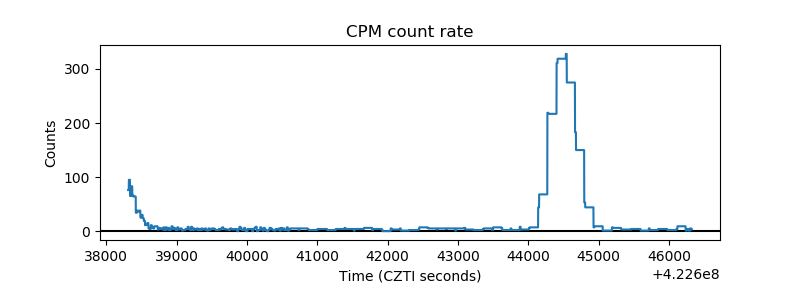 |
| CZT Counter | 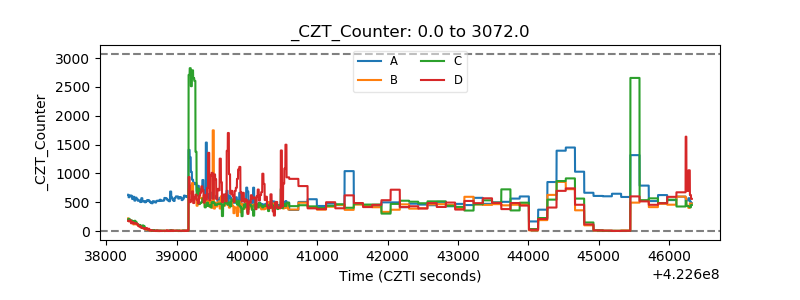 |
| +2.5 Volts monitor | 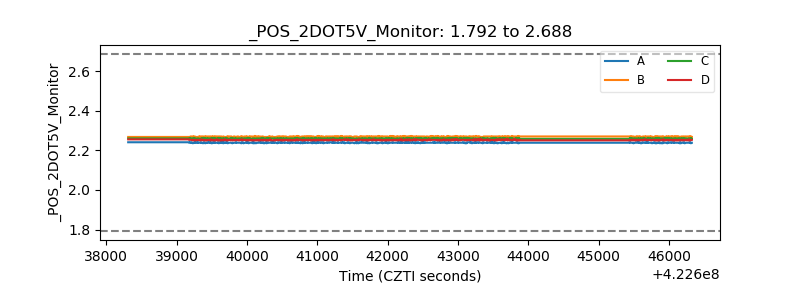 |
| +5 Volts monitor | 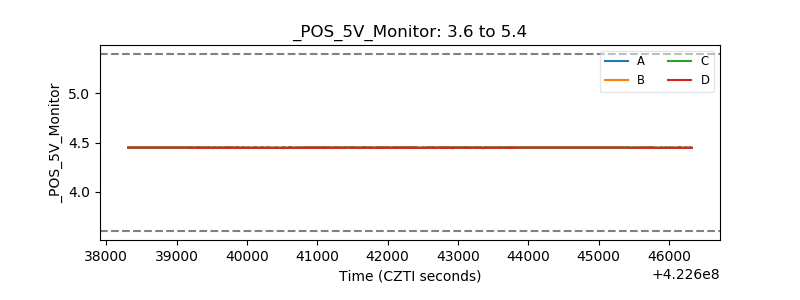 |
| _ROLL_ROT | 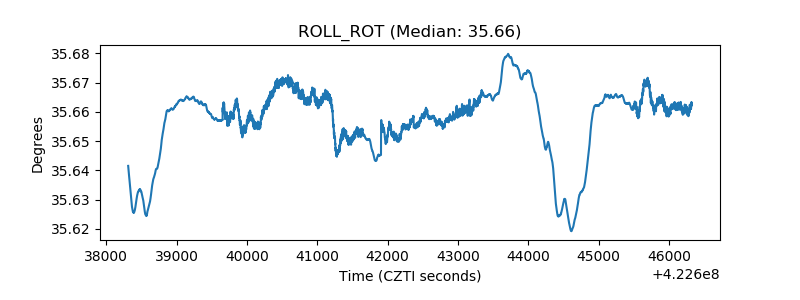 |
| _Roll_DEC | 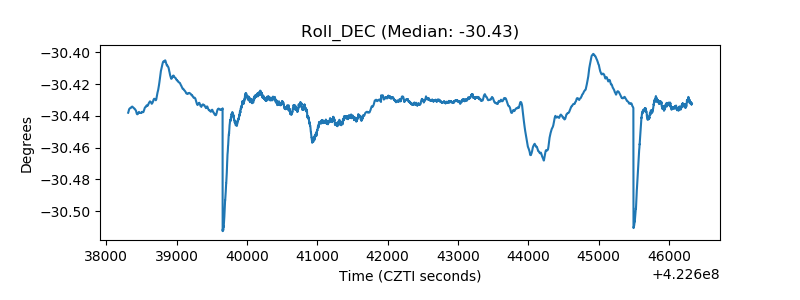 |
| _Roll_RA | 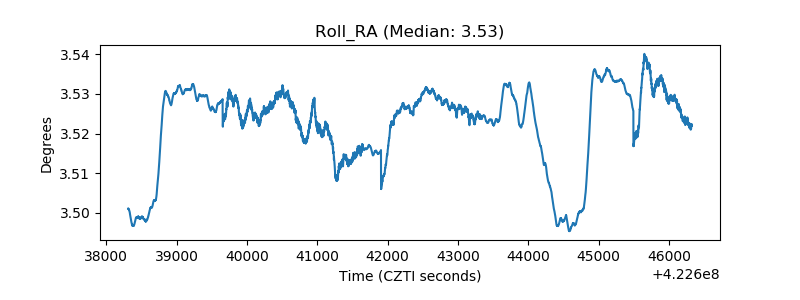 |
| Veto Counter | 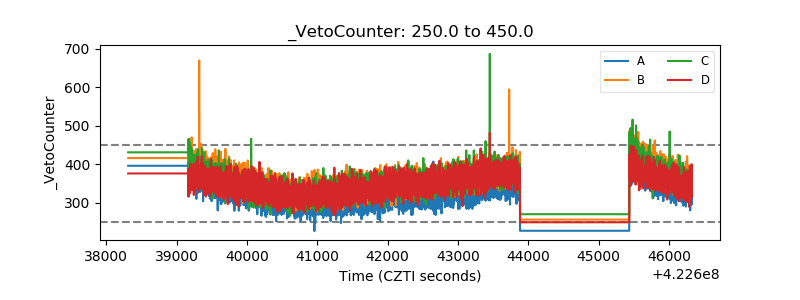 |