| Param | Original file | Final file |
|---|---|---|
| Filename | modeM0/AS1A12_035T01_9000005660_41383cztM0_level2.fits | modeM0/AS1A12_035T01_9000005660_41383cztM0_level2_quad_clean.evt |
| Size (bytes) | 292,320,000 | 80,340,480 |
| Size | 278.8 MB | 76.6 MB |
| Events in quadrant A | 2,545,622 | 544,203 |
| Events in quadrant B | 2,202,988 | 551,161 |
| Events in quadrant C | 2,533,082 | 511,242 |
| Events in quadrant D | 3,154,895 | 481,302 |
| Mode M0 | |||
|---|---|---|---|
| Quadrant | BADHDUFLAG | Total packets | Discarded packets |
| A | 0 | 10480 | 1 |
| B | 0 | 10040 | 1 |
| C | 0 | 10649 | 1 |
| D | 0 | 12708 | 1 |
| Mode SS | |||
|---|---|---|---|
| Quadrant | BADHDUFLAG | Total packets | Discarded packets |
| A | 0 | 100 | 0 |
| B | 0 | 100 | 0 |
| C | 0 | 100 | 0 |
| D | 0 | 100 | 0 |
| Mode M9 | |||
|---|---|---|---|
| Quadrant | BADHDUFLAG | Total packets | Discarded packets |
| A | 0 | 21 | 0 |
| B | 0 | 21 | 0 |
| C | 0 | 21 | 0 |
| D | 0 | 21 | 0 |
| Quadrant | Total seconds | Saturated seconds | Saturation percentage |
|---|---|---|---|
| A | 4924 | 9 | 0.182778% |
| B | 4924 | 5 | 0.101543% |
| C | 4924 | 112 | 2.274574% |
| D | 4924 | 129 | 2.619821% |
Noise dominated data is calculated using 1-second bins in cleaned event files. If a bin has >2000 counts, and if more than 50% of those come from <1% of pixels, then it is considered to be noise-dominated and hence unusable.
| Quadrant | # 1 sec bins | Bins with >0 counts | Bins with >2000 counts | High rate bins dominated by noise | Noise dominated (total time) | Noise dominated (detector-on time) | Marked lightcurve |
|---|---|---|---|---|---|---|---|
| A | 6477 | 4925 | 2 | 2 | 0.03% | 0.04% | 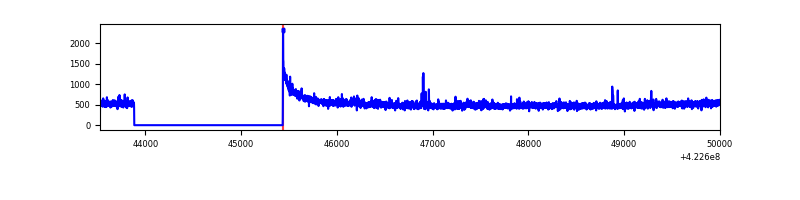 |
| B | 6477 | 4925 | 0 | 0 | 0.00% | 0.00% | 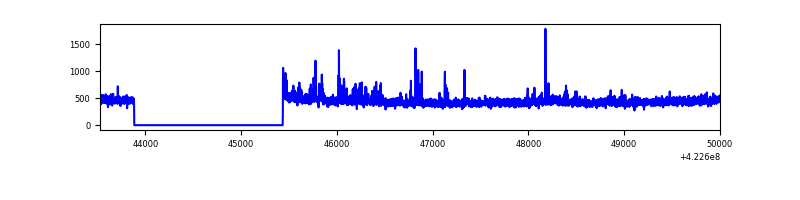 |
| C | 6477 | 4925 | 105 | 105 | 1.62% | 2.13% | 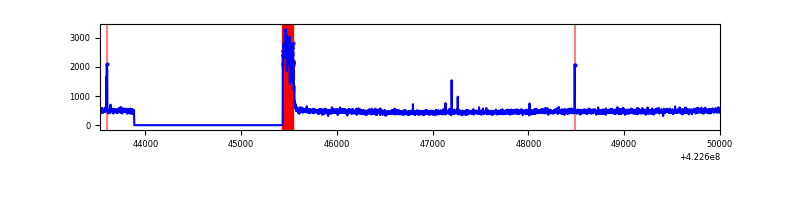 |
| D | 6477 | 4925 | 133 | 133 | 2.05% | 2.70% | 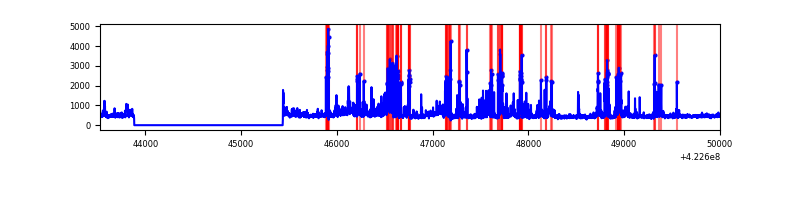 |
Top three noisy pixels from each quadrant. If the there are fewer than three noisy pixels in the level2.evt file, extra rows are filled as -1
| Pixel properties | Quadrant properties | ||||||
|---|---|---|---|---|---|---|---|
| Quadrant | DetID | PixID | Counts | Sigma | Mean | Median | Sigma |
| A | 10 | 83 | 404377 | 3619.8 | 539 | 527 | 111.6 |
| A | 12 | 189 | 42278 | 374.22 | 539 | 527 | 111.6 |
| A | 13 | 6 | 7806 | 65.24 | 539 | 527 | 111.6 |
| B | 0 | 190 | 64015 | 603.81 | 534 | 518 | 105.2 |
| B | 5 | 255 | 18126 | 167.44 | 534 | 518 | 105.2 |
| B | 12 | 111 | 13233 | 120.91 | 534 | 518 | 105.2 |
| C | 0 | 10 | 280648 | 2276.12 | 521 | 523 | 123.1 |
| C | 15 | 214 | 201766 | 1635.17 | 521 | 523 | 123.1 |
| C | 2 | 16 | 15014 | 117.74 | 521 | 523 | 123.1 |
| D | 1 | 47 | 595116 | 4610.8 | 523 | 507 | 129.0 |
| D | 1 | 52 | 224794 | 1739.2 | 523 | 507 | 129.0 |
| D | 13 | 249 | 125458 | 968.91 | 523 | 507 | 129.0 |
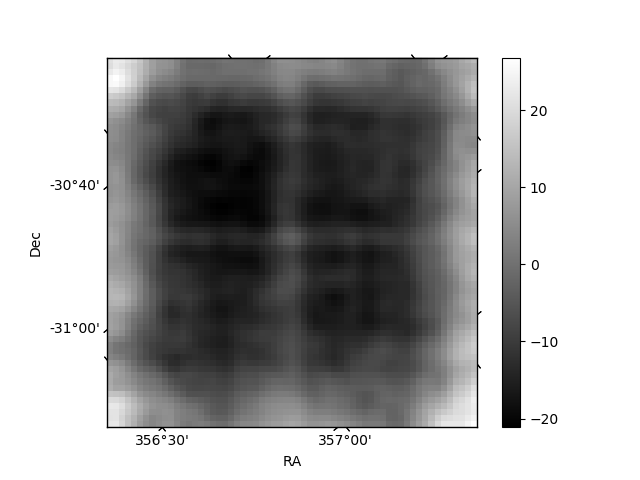
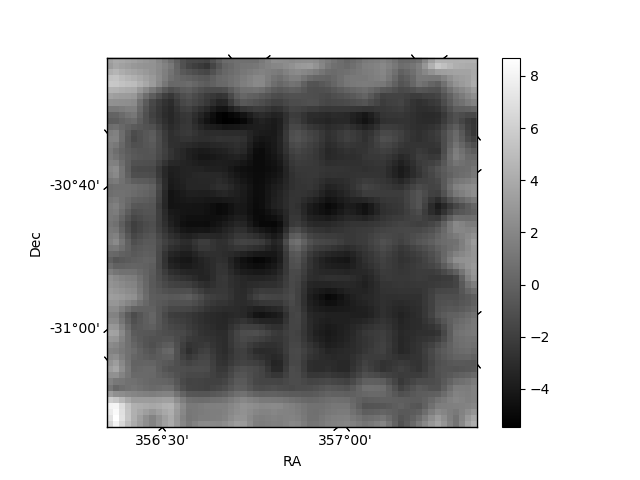
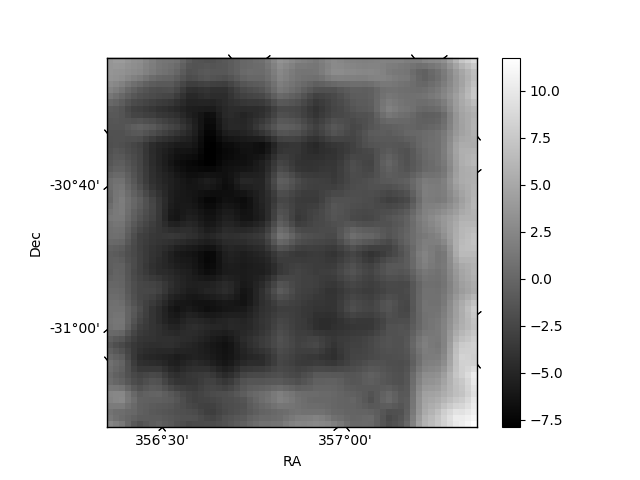
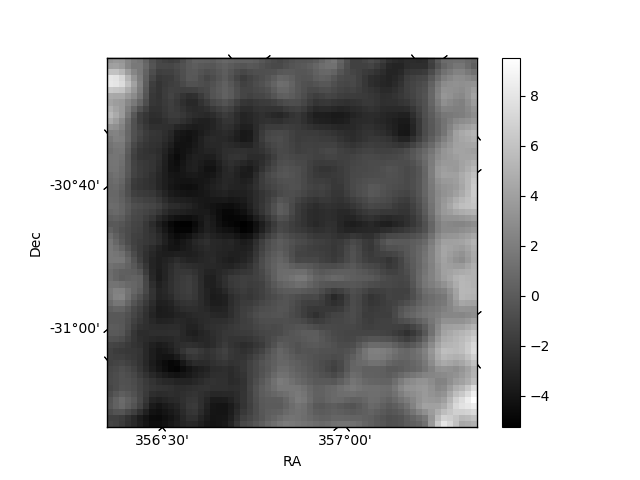
Histogram calculated using DETX and DETY for each event in the final _common_clean file
| Quadrant A | 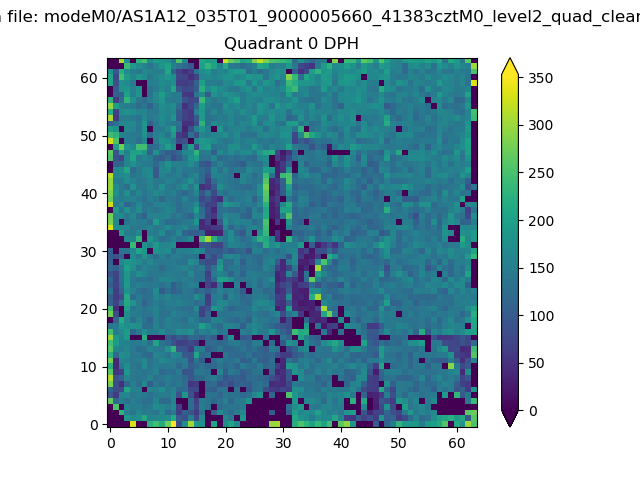 |
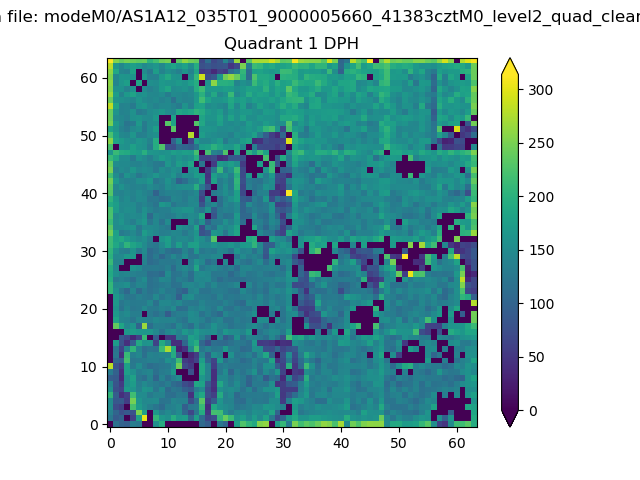 |
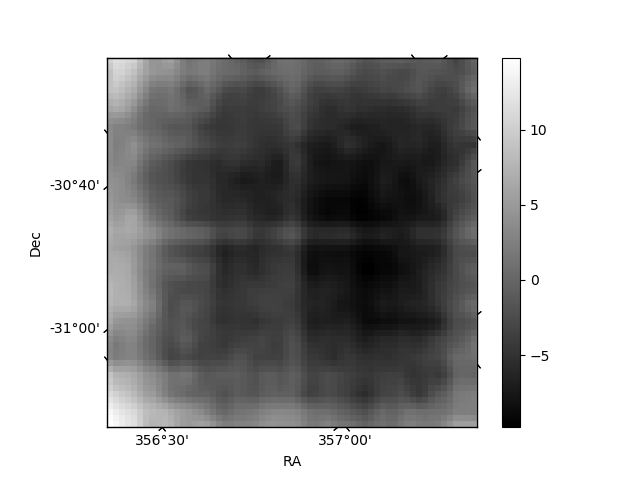
Quadrant B |
|---|---|---|---|
| Quadrant D | 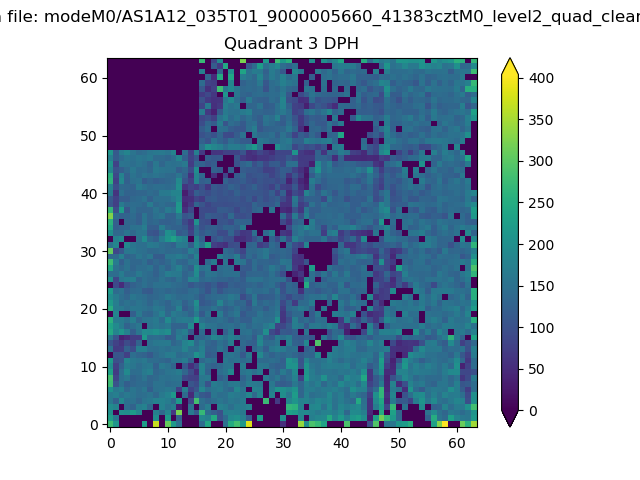 |
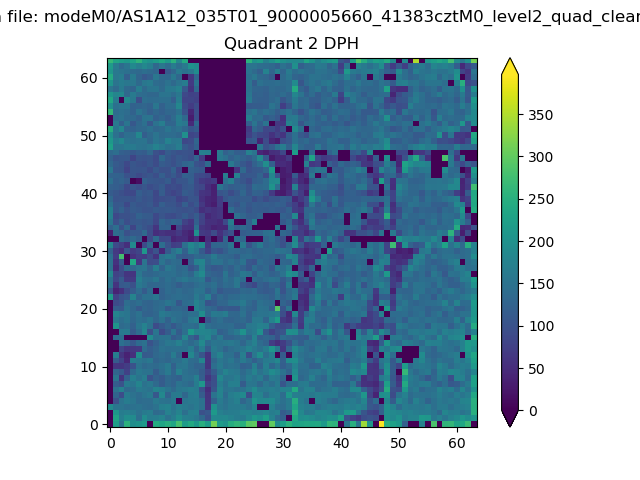 |
Quadrant C |
| Plot type | Count rate plots | Images |
|---|---|---|
| Comparison with Poisson distribution Blue bars denote a histogram of data divided into 1 sec bins. Red curve is a Poisson curve with rate = median count rate of data. |
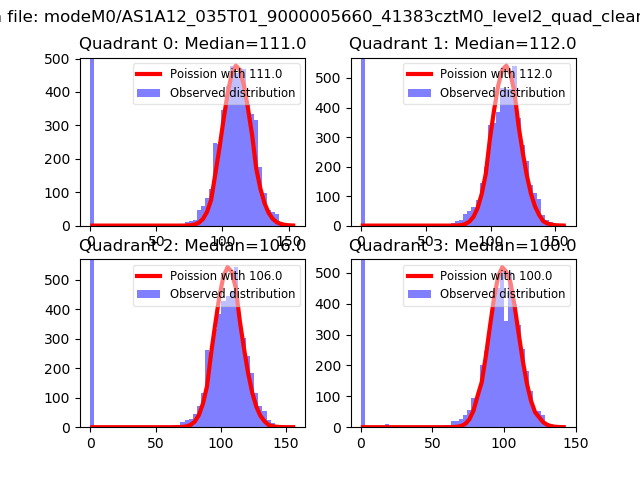 |
 |
| Quadrant-wise count rates Data is divided into 100 sec bins |
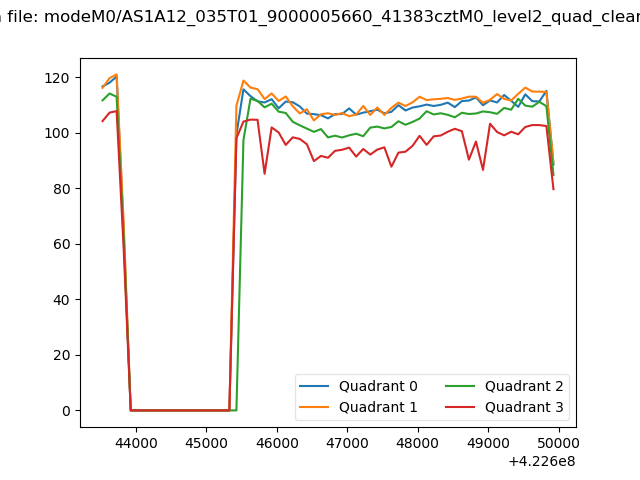 |
|
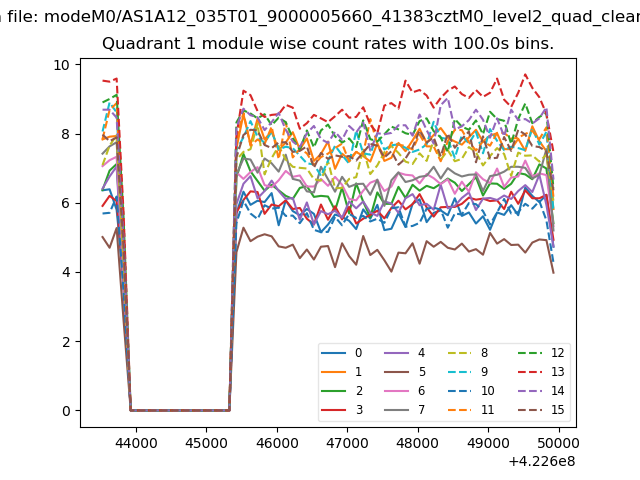
| Module-wise count rates for Quadrant A Data is divided into 100 sec bins |
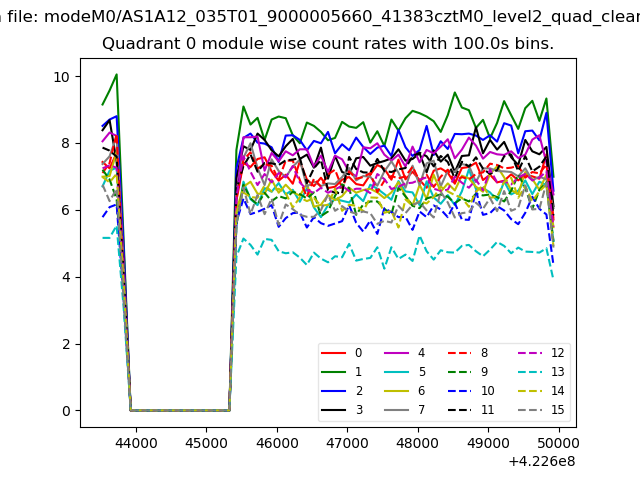 |
 |
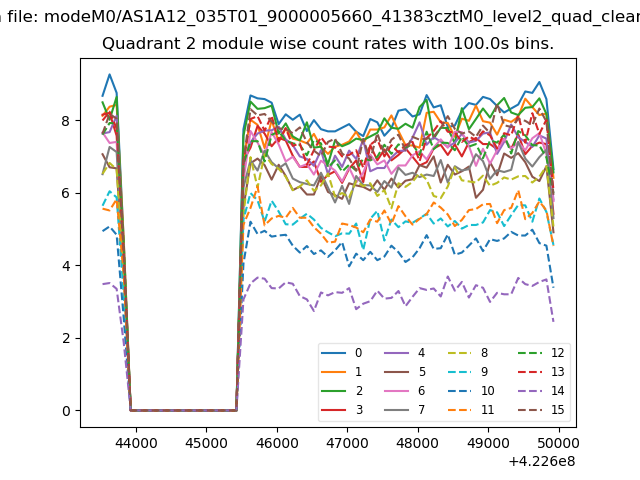
| Module-wise count rates for Quadrant B Data is divided into 100 sec bins |
 |
 |
| Module-wise count rates for Quadrant C Data is divided into 100 sec bins |
 |
 |
| Module-wise count rates for Quadrant D Data is divided into 100 sec bins |
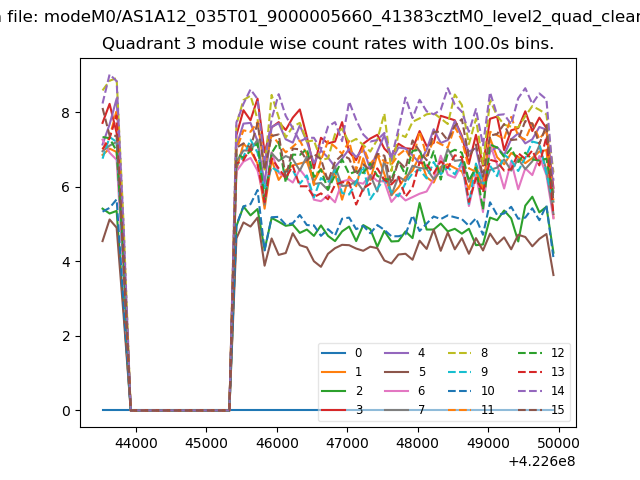 |
 |
| Parameter | Plot |
|---|---|
| CZT HV Monitor | 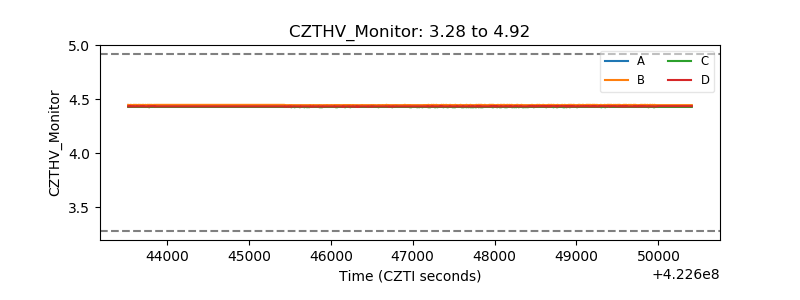 |
| D_VDD | 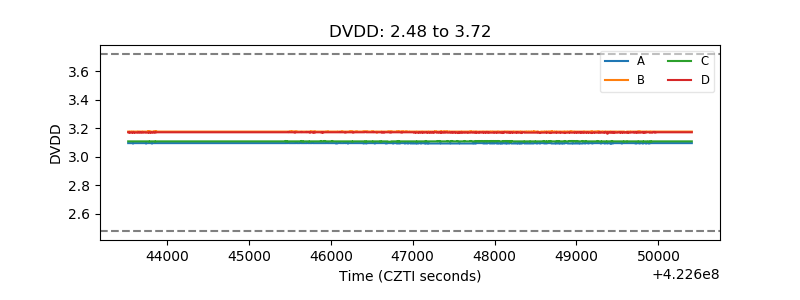 |
| Temperature 1 | 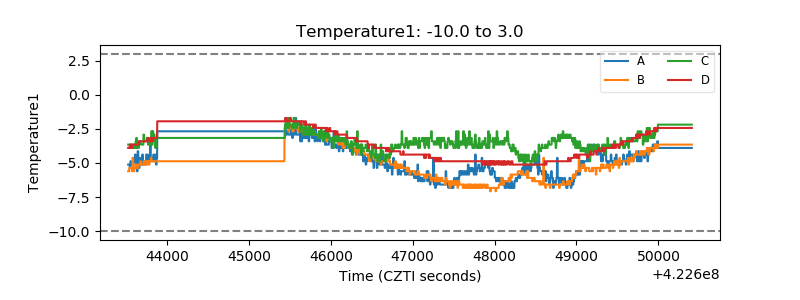 |
| Veto HV Monitor |  |
| Veto LLD | 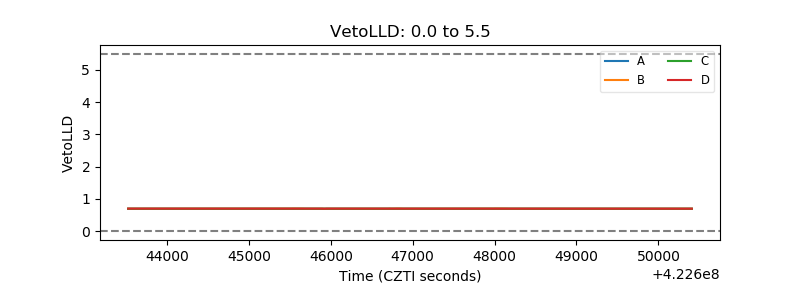 |
| Alpha Counter | 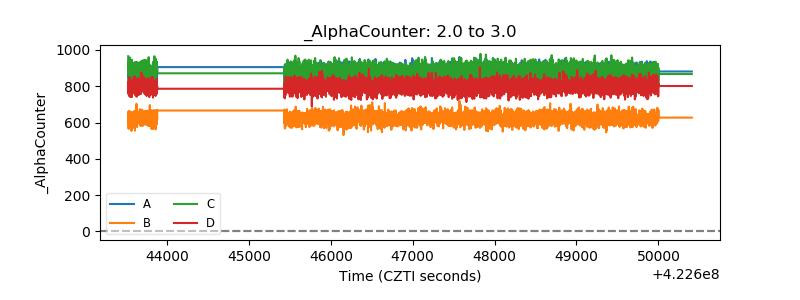 |
| _CPM_Rate | 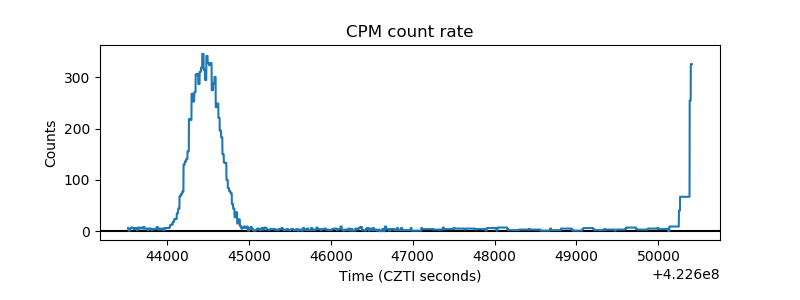 |
| CZT Counter | 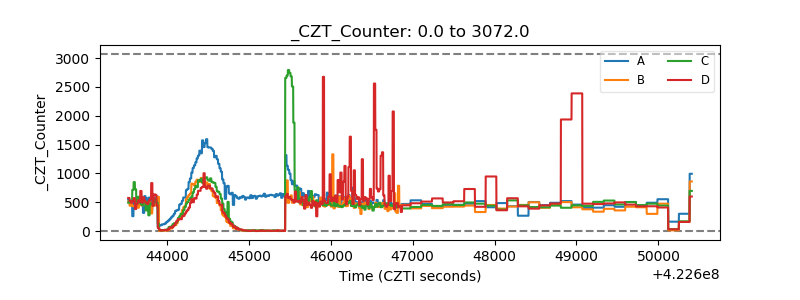 |
| +2.5 Volts monitor | 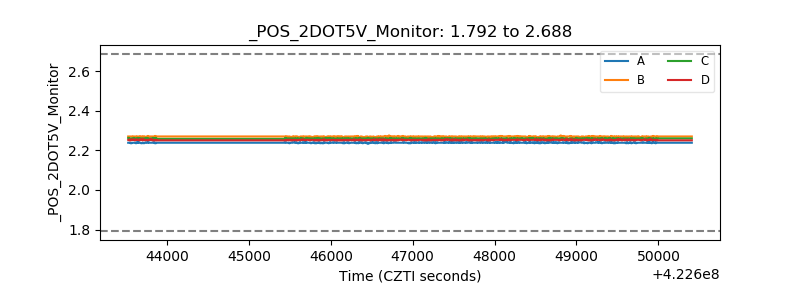 |
| +5 Volts monitor | 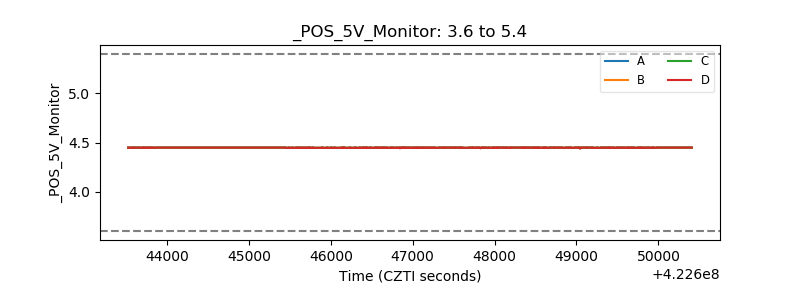 |
| _ROLL_ROT | 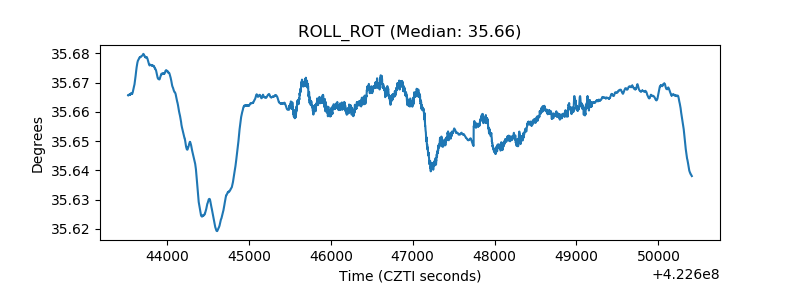 |
| _Roll_DEC | 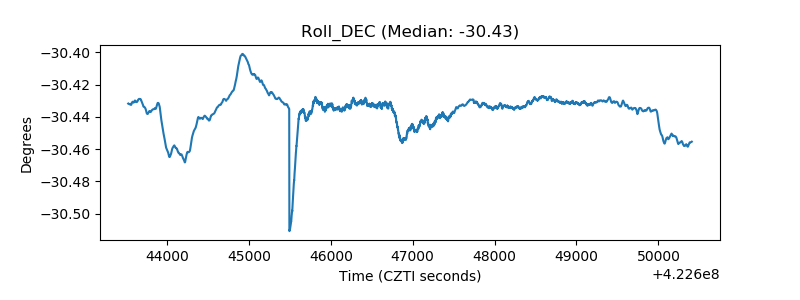 |
| _Roll_RA | 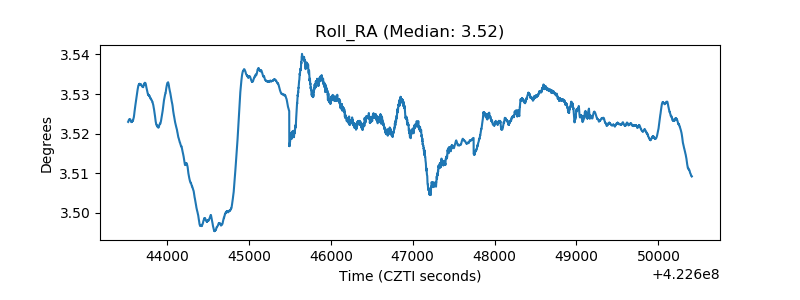 |
| Veto Counter | 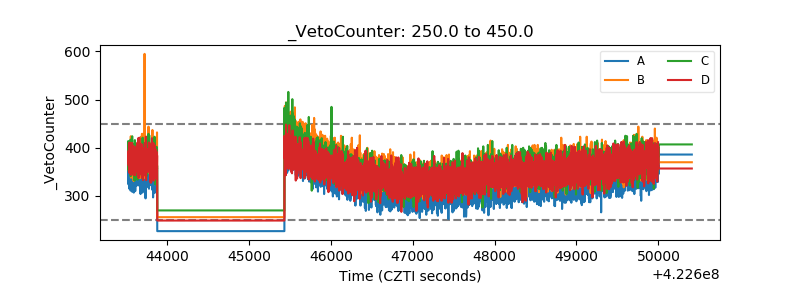 |