| Param | Original file | Final file |
|---|---|---|
| Filename | modeM0/AS1T05_105T01_9000005662_41383cztM0_level2.fits | modeM0/AS1T05_105T01_9000005662_41383cztM0_level2_quad_clean.evt |
| Size (bytes) | 79,810,560 | 14,428,800 |
| Size | 76.1 MB | 13.8 MB |
| Events in quadrant A | 564,093 | 105,481 |
| Events in quadrant B | 467,291 | 107,626 |
| Events in quadrant C | 704,407 | 86,329 |
| Events in quadrant D | 1,150,950 | 72,131 |
| Mode M9 | |||
|---|---|---|---|
| Quadrant | BADHDUFLAG | Total packets | Discarded packets |
| A | 0 | 2 | 0 |
| B | 0 | 2 | 0 |
| C | 0 | 2 | 0 |
| D | 0 | 2 | 0 |
| Mode SS | |||
|---|---|---|---|
| Quadrant | BADHDUFLAG | Total packets | Discarded packets |
| A | 0 | 18 | 0 |
| B | 0 | 18 | 0 |
| C | 0 | 18 | 0 |
| D | 0 | 18 | 0 |
| Mode M0 | |||
|---|---|---|---|
| Quadrant | BADHDUFLAG | Total packets | Discarded packets |
| A | 0 | 2231 | 2 |
| B | 0 | 1894 | 1 |
| C | 0 | 2558 | 1 |
| D | 0 | 3986 | 1 |
| Quadrant | Total seconds | Saturated seconds | Saturation percentage |
|---|---|---|---|
| A | 829 | 10 | 1.206273% |
| B | 829 | 7 | 0.844391% |
| C | 829 | 125 | 15.078408% |
| D | 829 | 196 | 23.642943% |
Noise dominated data is calculated using 1-second bins in cleaned event files. If a bin has >2000 counts, and if more than 50% of those come from <1% of pixels, then it is considered to be noise-dominated and hence unusable.
| Quadrant | # 1 sec bins | Bins with >0 counts | Bins with >2000 counts | High rate bins dominated by noise | Noise dominated (total time) | Noise dominated (detector-on time) | Marked lightcurve |
|---|---|---|---|---|---|---|---|
| A | 829 | 829 | 3 | 3 | 0.36% | 0.36% | 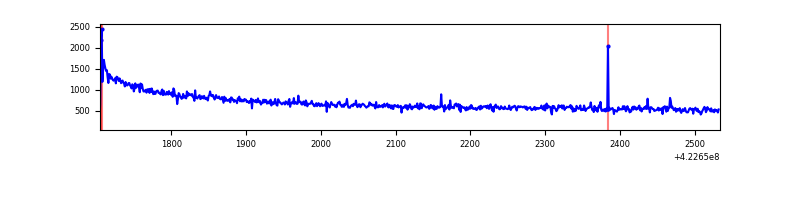 |
| B | 829 | 829 | 3 | 3 | 0.36% | 0.36% | 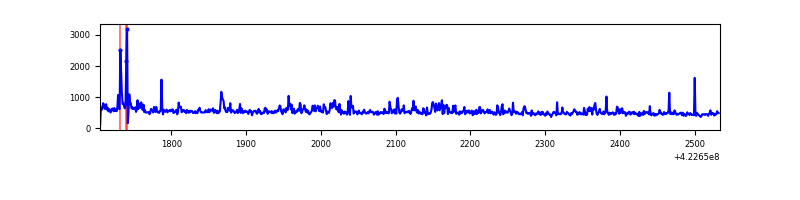 |
| C | 829 | 829 | 115 | 115 | 13.87% | 13.87% | 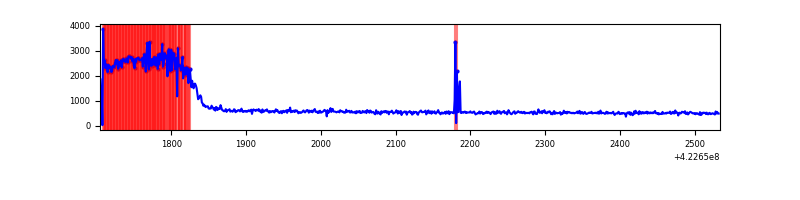 |
| D | 829 | 829 | 169 | 169 | 20.39% | 20.39% | 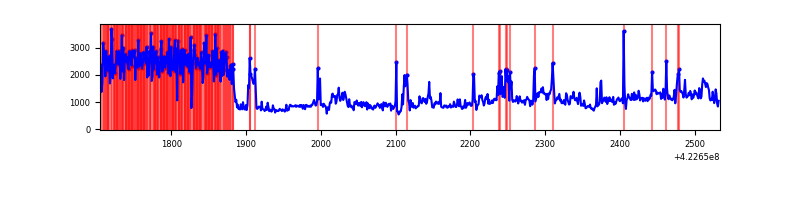 |
Top three noisy pixels from each quadrant. If the there are fewer than three noisy pixels in the level2.evt file, extra rows are filled as -1
| Pixel properties | Quadrant properties | ||||||
|---|---|---|---|---|---|---|---|
| Quadrant | DetID | PixID | Counts | Sigma | Mean | Median | Sigma |
| A | 10 | 83 | 152561 | 6552.5 | 103 | 101 | 23.3 |
| A | 12 | 189 | 4169 | 174.84 | 103 | 101 | 23.3 |
| A | 13 | 248 | 3193 | 132.89 | 103 | 101 | 23.3 |
| B | 0 | 190 | 32767 | 1472.73 | 103 | 100 | 22.2 |
| B | 5 | 255 | 21093 | 946.43 | 103 | 100 | 22.2 |
| B | 0 | 229 | 3187 | 139.17 | 103 | 100 | 22.2 |
| C | 0 | 10 | 306004 | 13239.57 | 91 | 91 | 23.1 |
| C | 15 | 214 | 35883 | 1549.04 | 91 | 91 | 23.1 |
| C | 12 | 249 | 7676 | 328.27 | 91 | 91 | 23.1 |
| D | 1 | 47 | 406369 | 17161.05 | 88 | 86 | 23.7 |
| D | 5 | 222 | 272598 | 11510.67 | 88 | 86 | 23.7 |
| D | 12 | 79 | 67244 | 2836.7 | 88 | 86 | 23.7 |
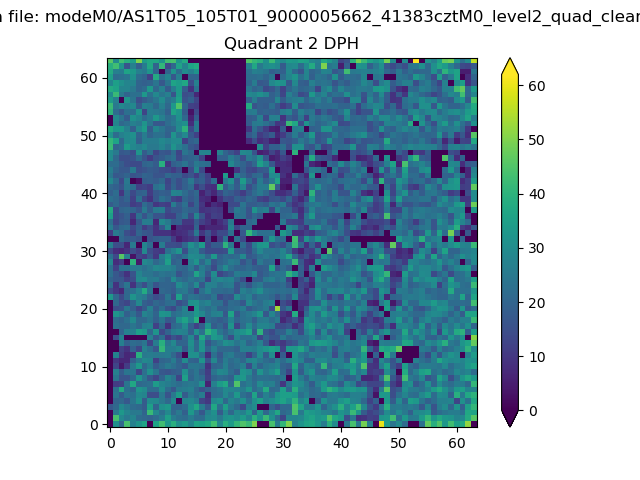
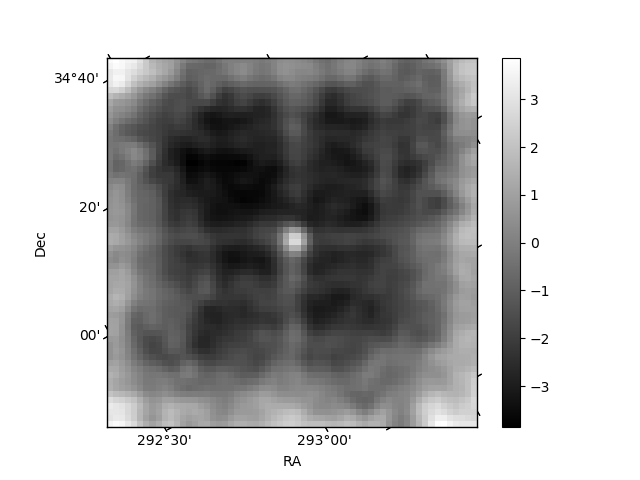
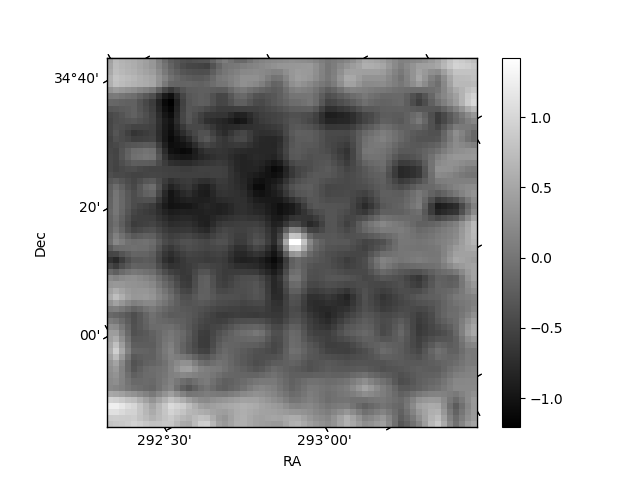
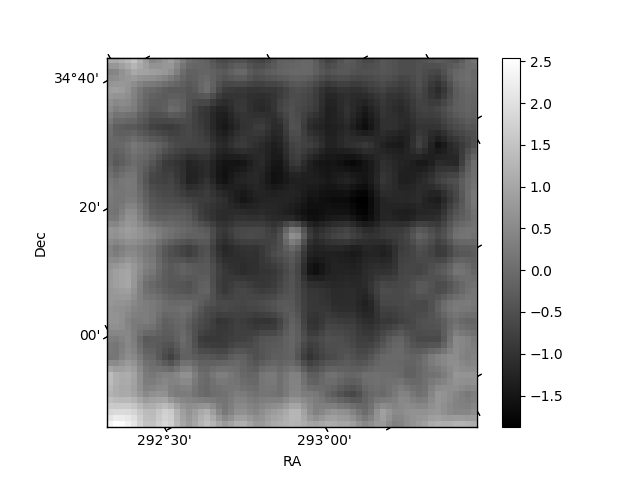
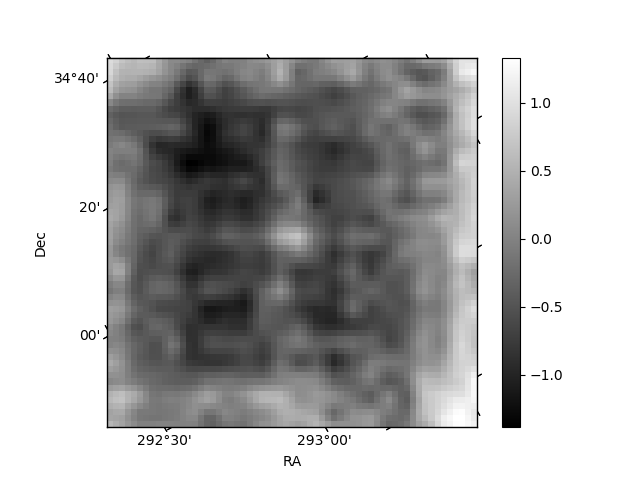
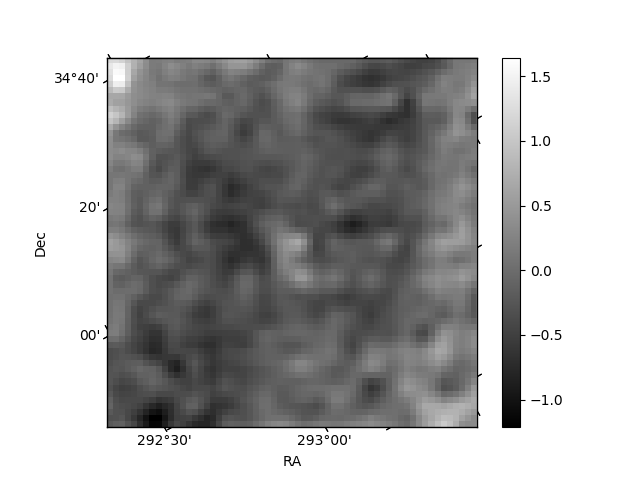
Histogram calculated using DETX and DETY for each event in the final _common_clean file
| Quadrant A | 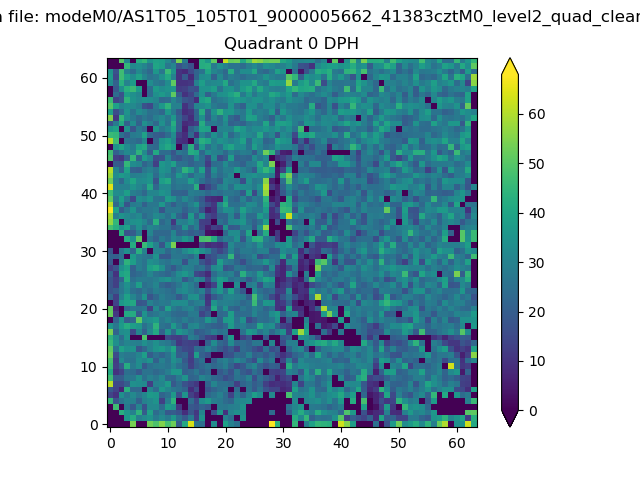 |
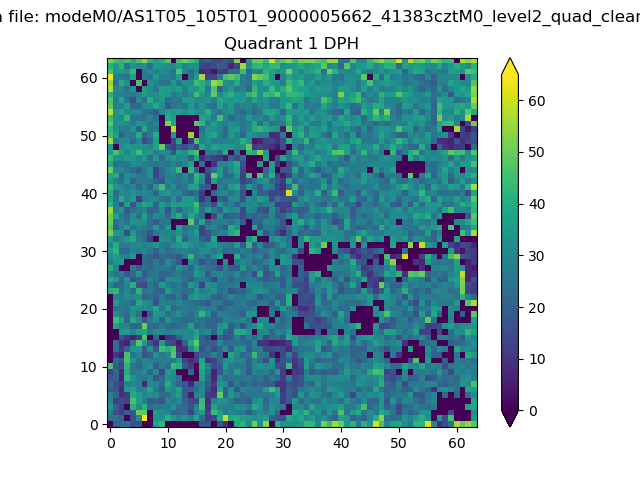 |
Quadrant B |
|---|---|---|---|
| Quadrant D | 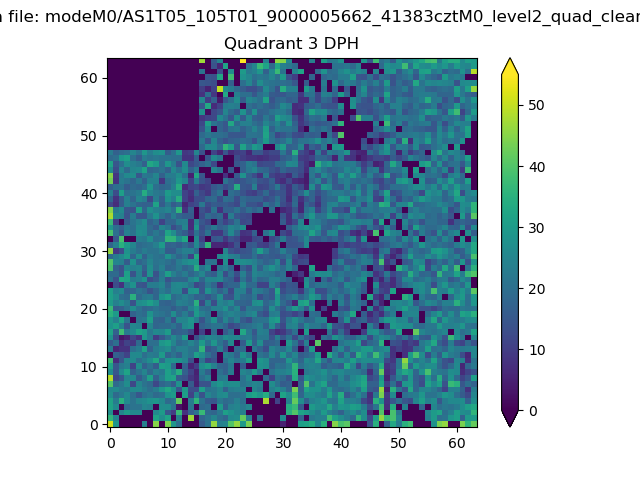 |
 |
Quadrant C |
| Plot type | Count rate plots | Images |
|---|---|---|
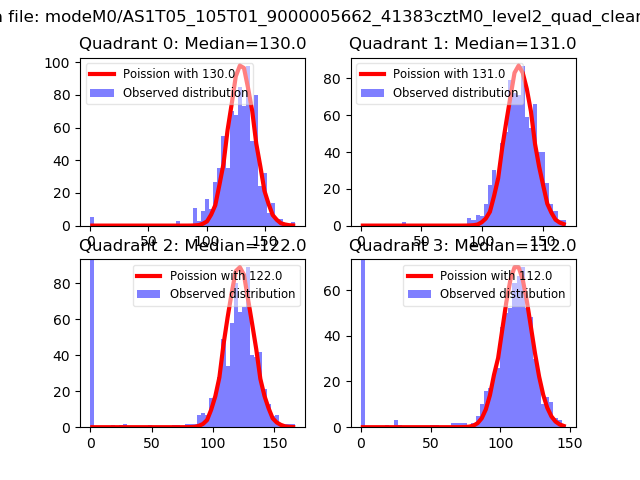
| Comparison with Poisson distribution Blue bars denote a histogram of data divided into 1 sec bins. Red curve is a Poisson curve with rate = median count rate of data. |
 |
 |
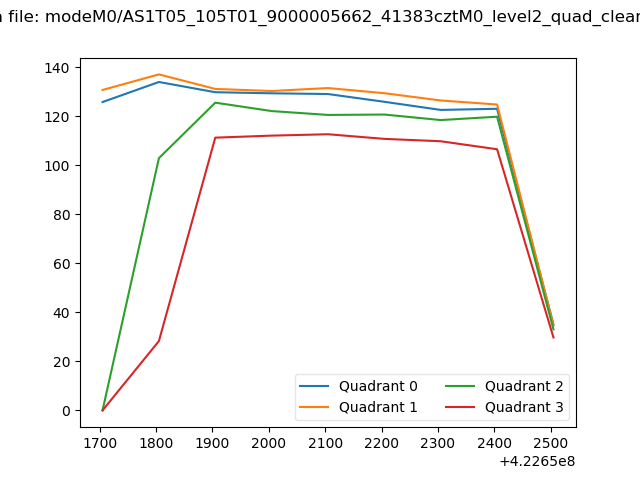
| Quadrant-wise count rates Data is divided into 100 sec bins |
 |
|
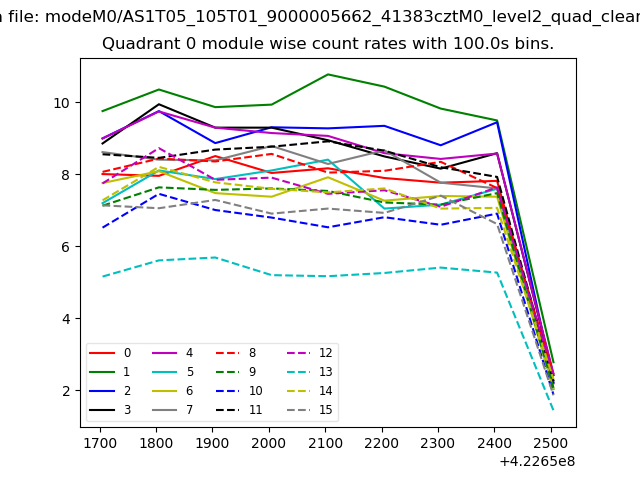
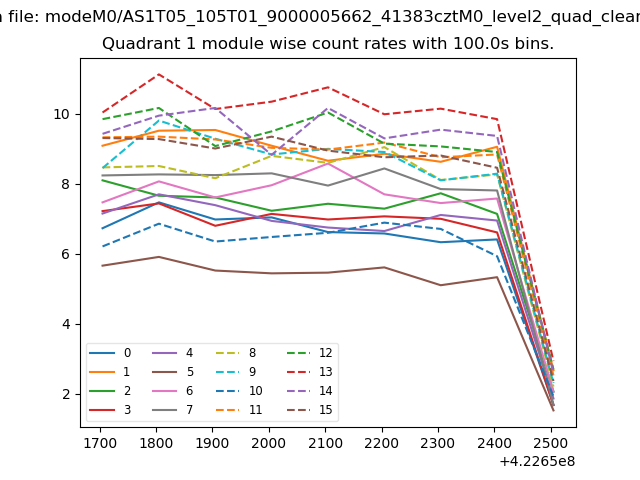
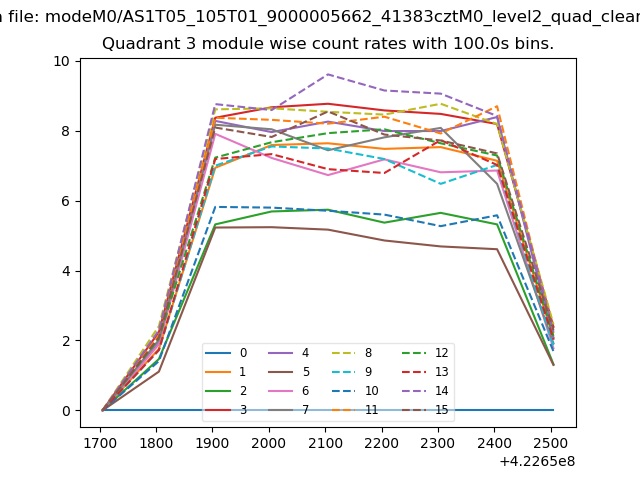
| Module-wise count rates for Quadrant A Data is divided into 100 sec bins |
 |
 |
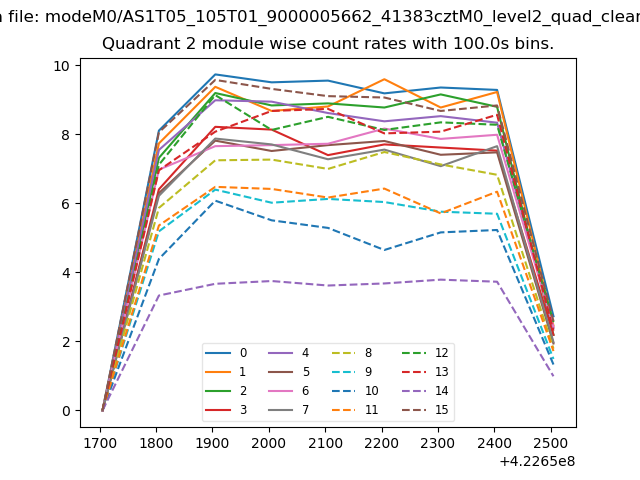
| Module-wise count rates for Quadrant B Data is divided into 100 sec bins |
 |
 |
| Module-wise count rates for Quadrant C Data is divided into 100 sec bins |
 |
 |
| Module-wise count rates for Quadrant D Data is divided into 100 sec bins |
 |
 |
| Parameter | Plot |
|---|---|
| CZT HV Monitor | 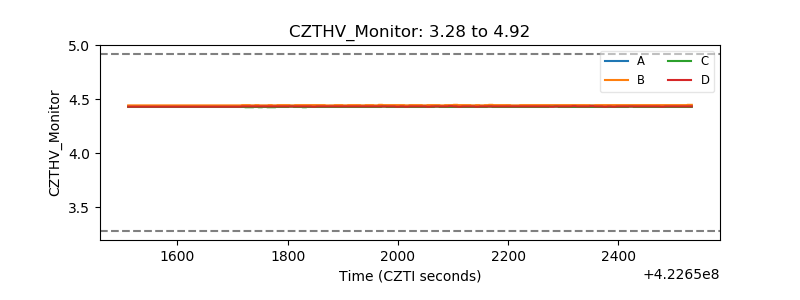 |
| D_VDD | 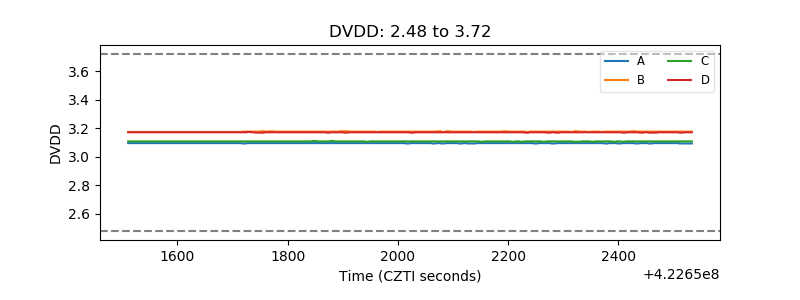 |
| Temperature 1 | 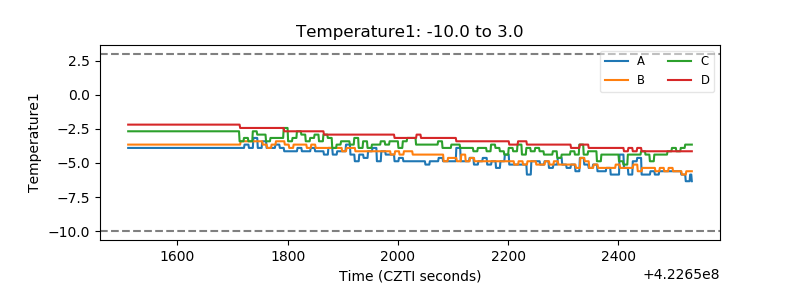 |
| Veto HV Monitor | 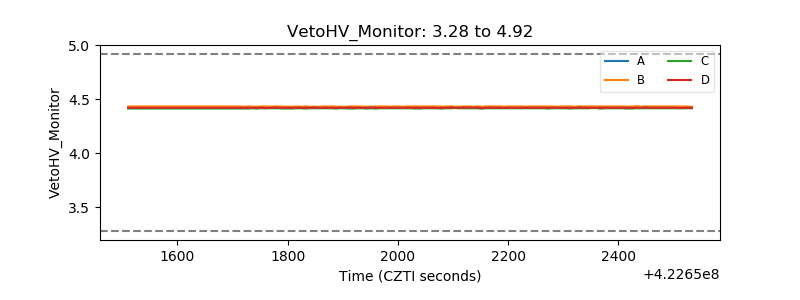 |
| Veto LLD | 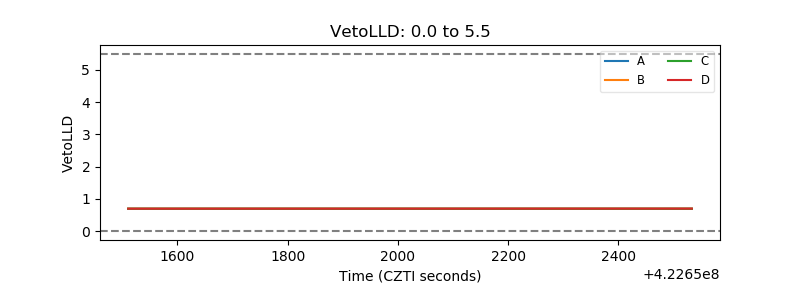 |
| Alpha Counter | 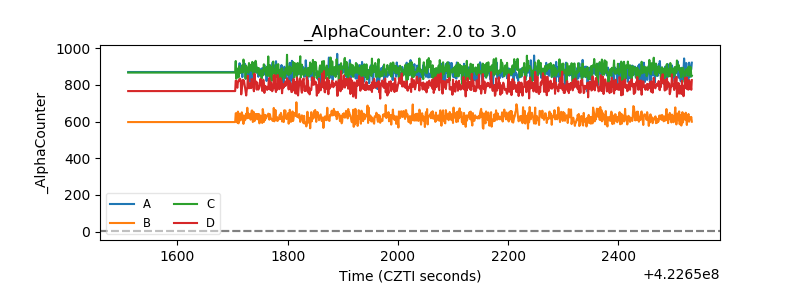 |
| _CPM_Rate | 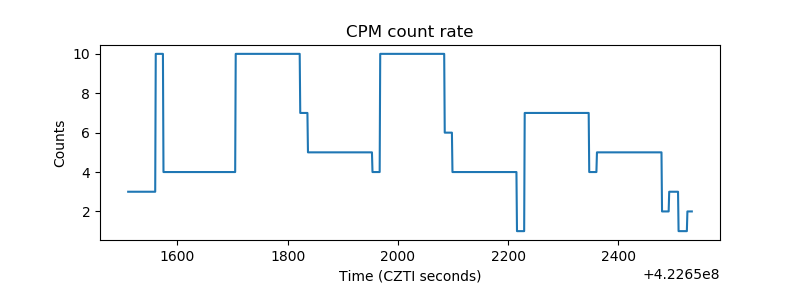 |
| CZT Counter | 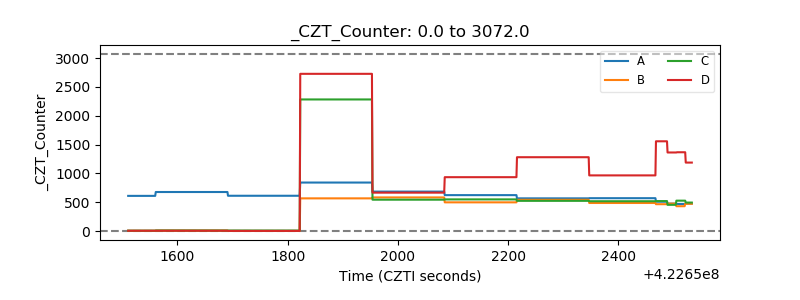 |
| +2.5 Volts monitor | 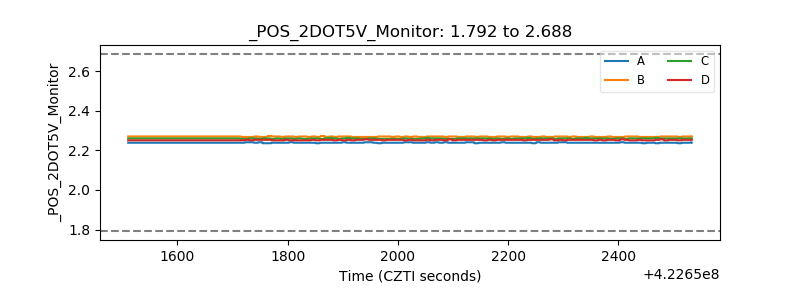 |
| +5 Volts monitor | 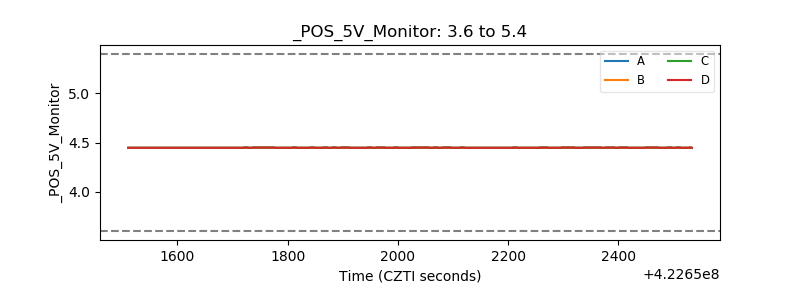 |
| _ROLL_ROT | 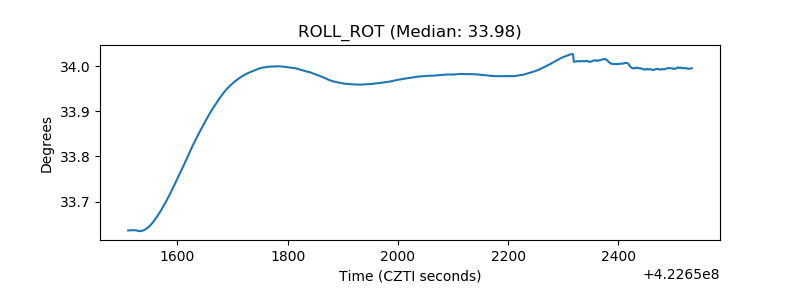 |
| _Roll_DEC | 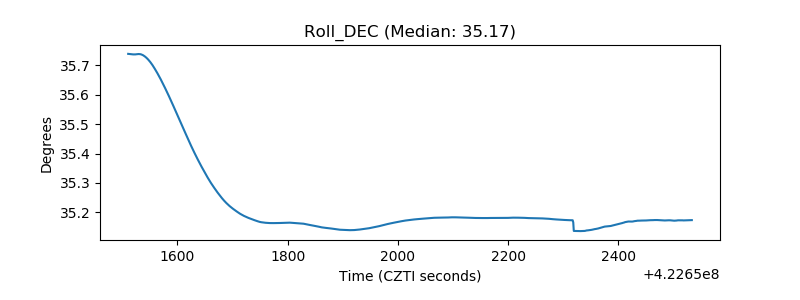 |
| _Roll_RA | 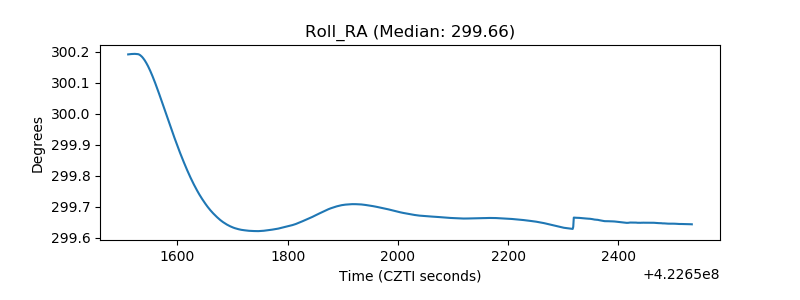 |
| Veto Counter | 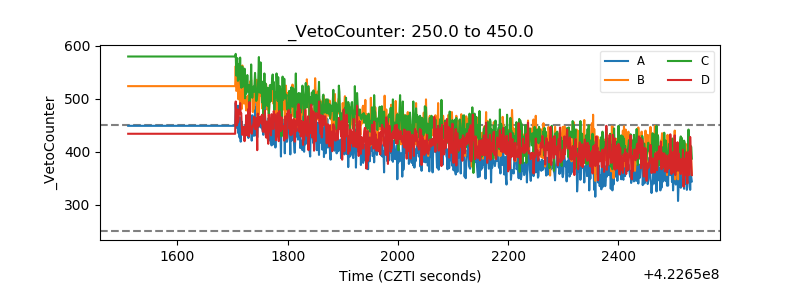 |