| Param | Original file | Final file |
|---|---|---|
| Filename | modeM0/AS1T05_105T01_9000005662_41385cztM0_level2.fits | modeM0/AS1T05_105T01_9000005662_41385cztM0_level2_quad_clean.evt |
| Size (bytes) | 389,617,920 | 90,987,840 |
| Size | 371.6 MB | 86.8 MB |
| Events in quadrant A | 2,886,014 | 629,473 |
| Events in quadrant B | 2,469,206 | 645,571 |
| Events in quadrant C | 3,053,089 | 584,235 |
| Events in quadrant D | 5,605,821 | 527,898 |
| Mode M9 | |||
|---|---|---|---|
| Quadrant | BADHDUFLAG | Total packets | Discarded packets |
| A | 0 | 20 | 0 |
| B | 0 | 20 | 0 |
| C | 0 | 20 | 0 |
| D | 0 | 20 | 0 |
| Mode SS | |||
|---|---|---|---|
| Quadrant | BADHDUFLAG | Total packets | Discarded packets |
| A | 0 | 108 | 0 |
| B | 0 | 108 | 0 |
| C | 0 | 108 | 0 |
| D | 0 | 108 | 0 |
| Mode M0 | |||
|---|---|---|---|
| Quadrant | BADHDUFLAG | Total packets | Discarded packets |
| A | 0 | 11834 | 3 |
| B | 0 | 10914 | 2 |
| C | 0 | 12352 | 2 |
| D | 0 | 20302 | 2 |
| Quadrant | Total seconds | Saturated seconds | Saturation percentage |
|---|---|---|---|
| A | 5252 | 15 | 0.285605% |
| B | 5252 | 15 | 0.285605% |
| C | 5252 | 251 | 4.779132% |
| D | 5252 | 396 | 7.539985% |
Noise dominated data is calculated using 1-second bins in cleaned event files. If a bin has >2000 counts, and if more than 50% of those come from <1% of pixels, then it is considered to be noise-dominated and hence unusable.
| Quadrant | # 1 sec bins | Bins with >0 counts | Bins with >2000 counts | High rate bins dominated by noise | Noise dominated (total time) | Noise dominated (detector-on time) | Marked lightcurve |
|---|---|---|---|---|---|---|---|
| A | 7046 | 5253 | 6 | 6 | 0.09% | 0.11% | 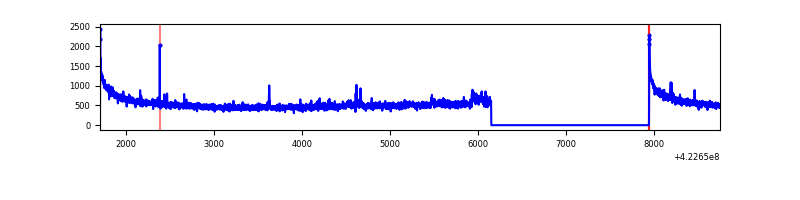 |
| B | 7046 | 5253 | 5 | 5 | 0.07% | 0.10% | 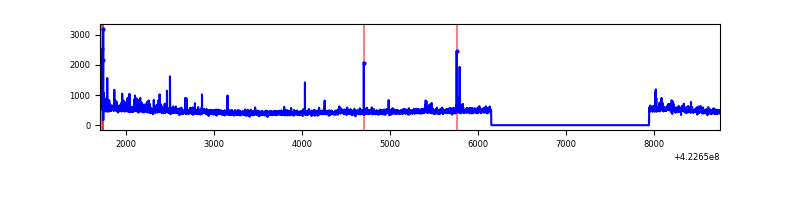 |
| C | 7046 | 5253 | 234 | 234 | 3.32% | 4.45% | 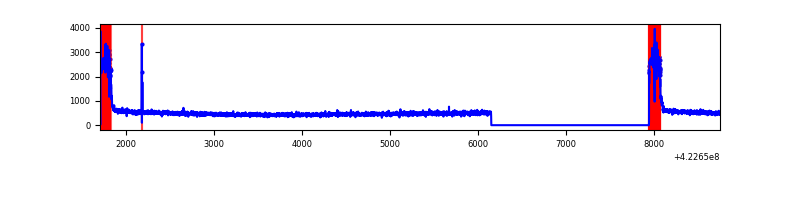 |
| D | 7046 | 5253 | 381 | 381 | 5.41% | 7.25% | 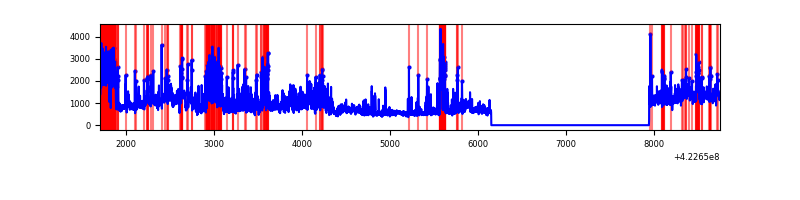 |
Top three noisy pixels from each quadrant. If the there are fewer than three noisy pixels in the level2.evt file, extra rows are filled as -1
| Pixel properties | Quadrant properties | ||||||
|---|---|---|---|---|---|---|---|
| Quadrant | DetID | PixID | Counts | Sigma | Mean | Median | Sigma |
| A | 10 | 83 | 508941 | 4199.89 | 594 | 582 | 121.0 |
| A | 9 | 240 | 31557 | 255.91 | 594 | 582 | 121.0 |
| A | 12 | 189 | 26603 | 214.98 | 594 | 582 | 121.0 |
| B | 0 | 190 | 61069 | 524.55 | 593 | 577 | 115.3 |
| B | 5 | 255 | 36450 | 311.07 | 593 | 577 | 115.3 |
| B | 0 | 229 | 28166 | 239.23 | 593 | 577 | 115.3 |
| C | 0 | 10 | 637679 | 4823.22 | 562 | 567 | 132.1 |
| C | 15 | 214 | 216616 | 1635.59 | 562 | 567 | 132.1 |
| C | 12 | 249 | 8373 | 59.09 | 562 | 567 | 132.1 |
| D | 5 | 222 | 1247712 | 9097.49 | 556 | 541 | 137.1 |
| D | 12 | 79 | 1045940 | 7625.67 | 556 | 541 | 137.1 |
| D | 1 | 47 | 410861 | 2993.08 | 556 | 541 | 137.1 |
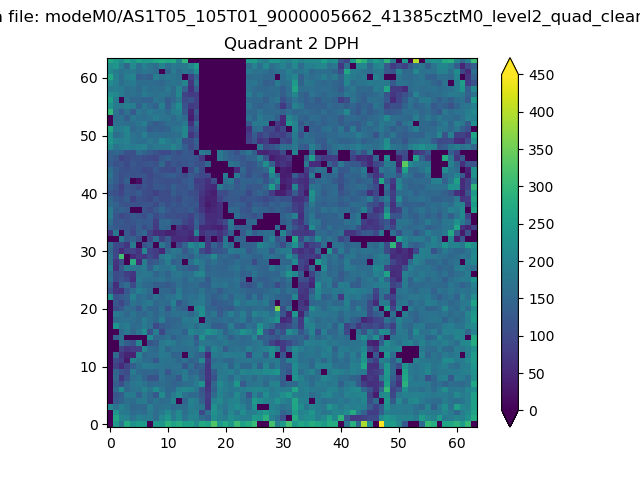
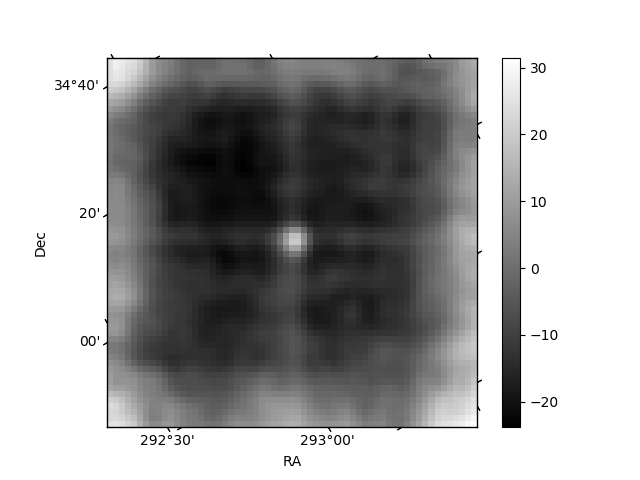
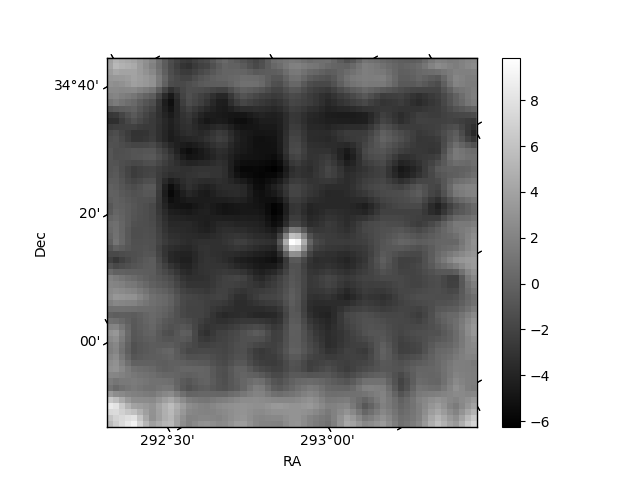
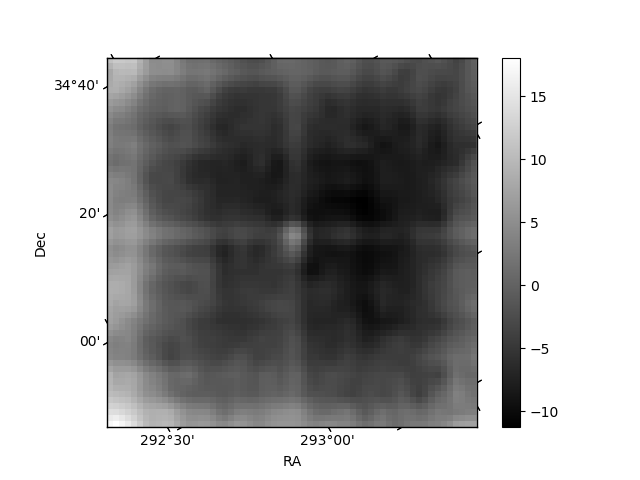
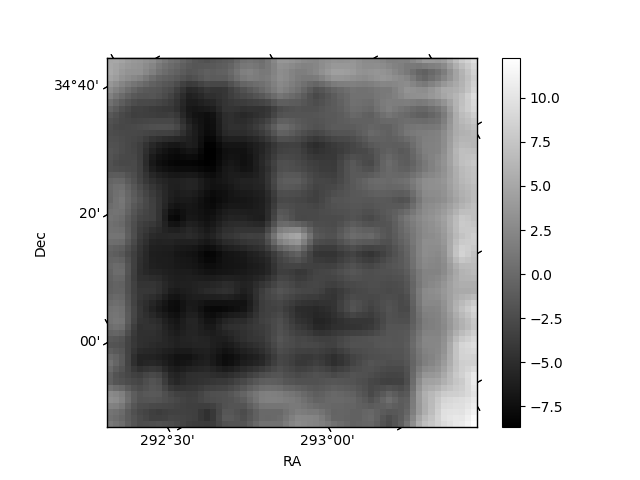
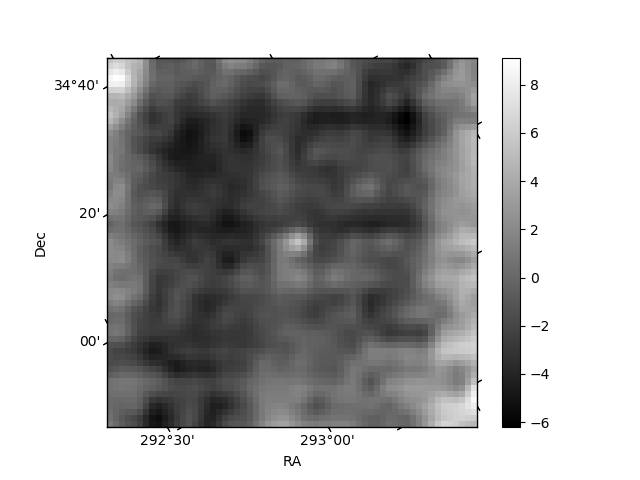
Histogram calculated using DETX and DETY for each event in the final _common_clean file
| Quadrant A | 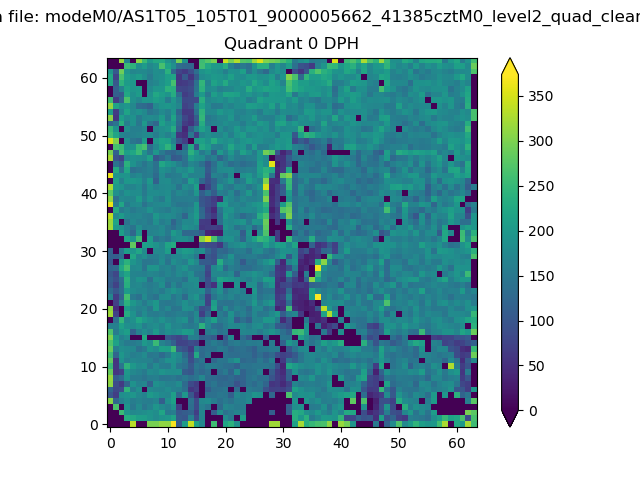 |
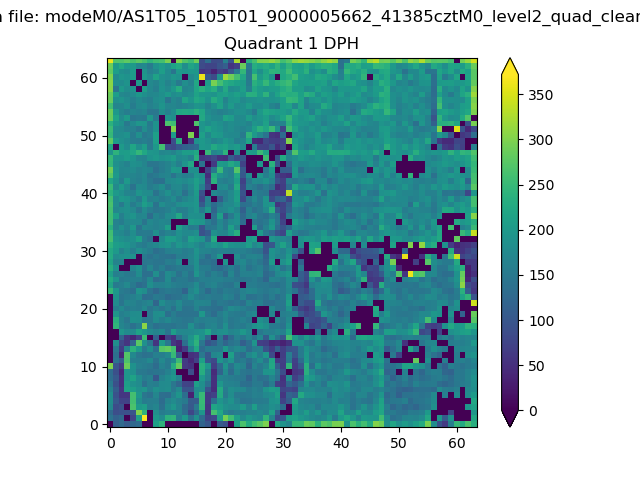 |
Quadrant B |
|---|---|---|---|
| Quadrant D | 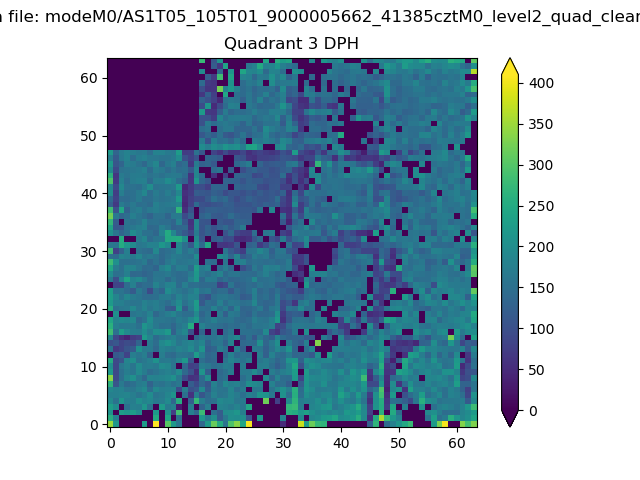 |
 |
Quadrant C |
| Plot type | Count rate plots | Images |
|---|---|---|
| Comparison with Poisson distribution Blue bars denote a histogram of data divided into 1 sec bins. Red curve is a Poisson curve with rate = median count rate of data. |
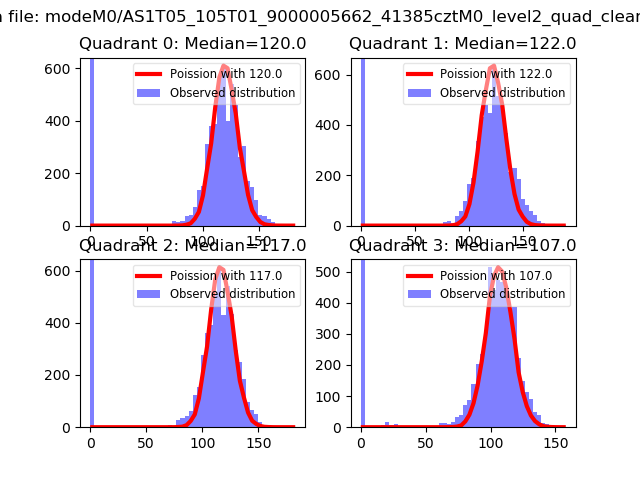 |
 |
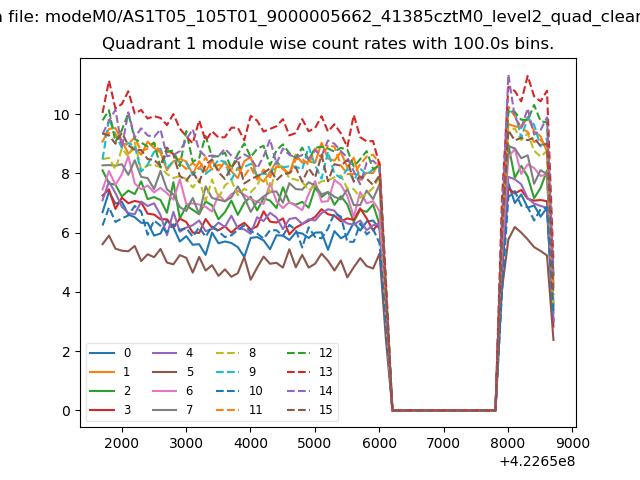
| Quadrant-wise count rates Data is divided into 100 sec bins |
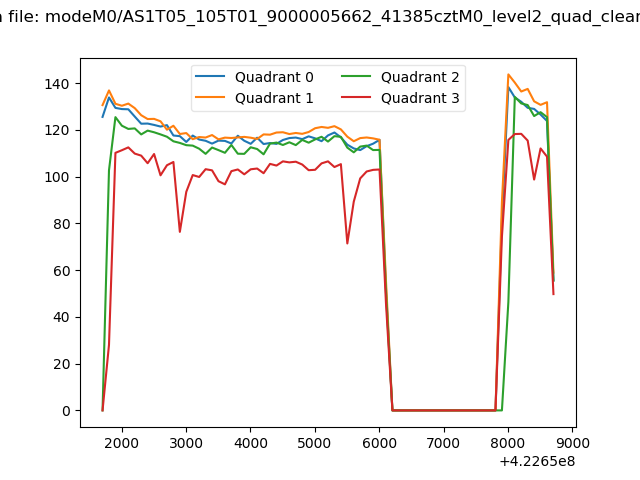 |
|
| Module-wise count rates for Quadrant A Data is divided into 100 sec bins |
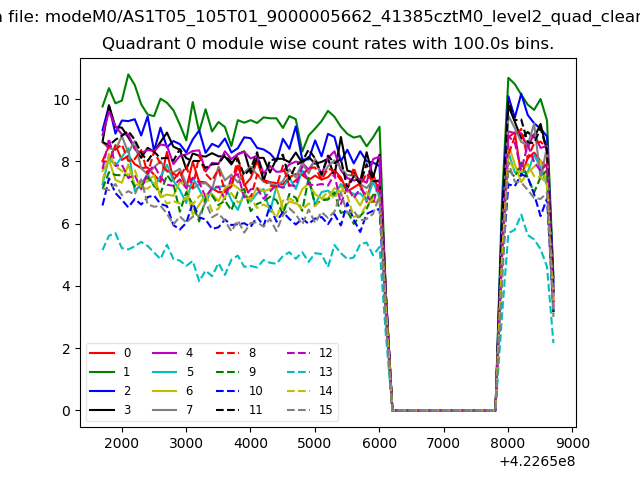 |
 |
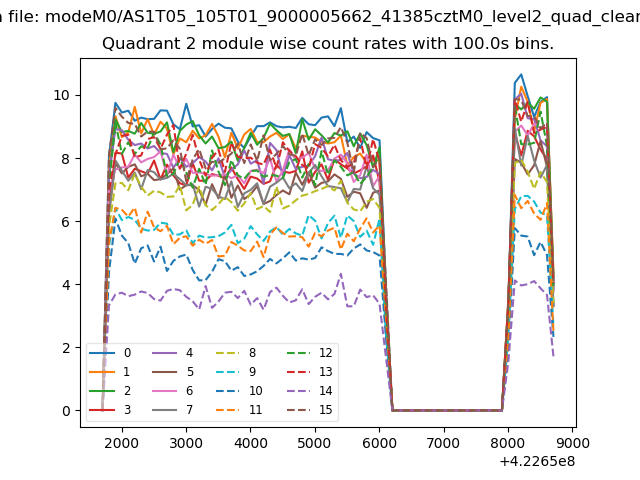
| Module-wise count rates for Quadrant B Data is divided into 100 sec bins |
 |
 |
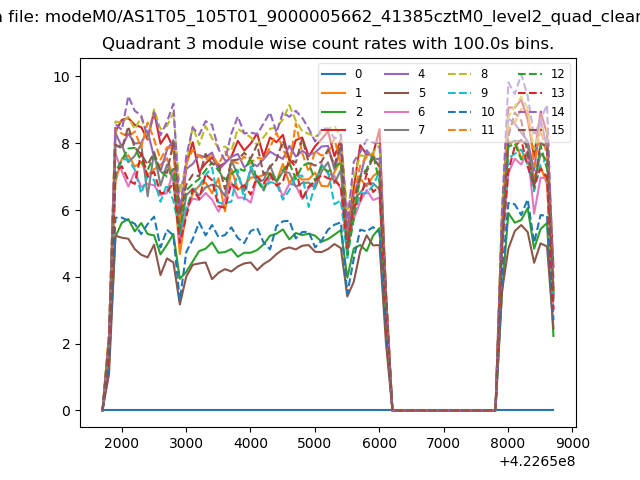
| Module-wise count rates for Quadrant C Data is divided into 100 sec bins |
 |
 |
| Module-wise count rates for Quadrant D Data is divided into 100 sec bins |
 |
 |
| Parameter | Plot |
|---|---|
| CZT HV Monitor | 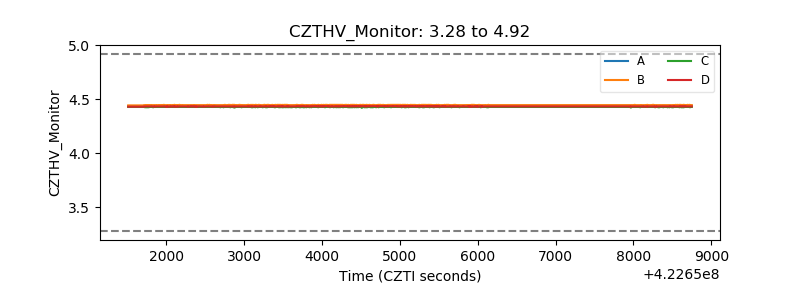 |
| D_VDD | 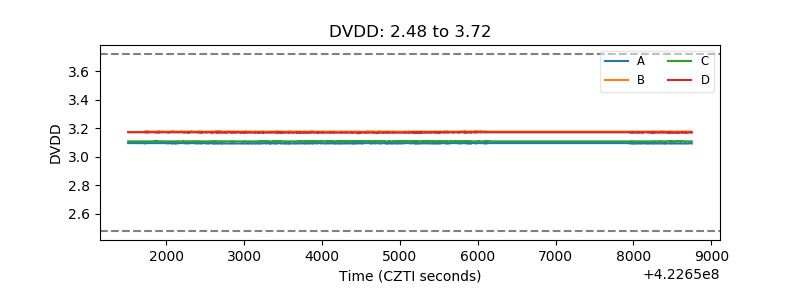 |
| Temperature 1 | 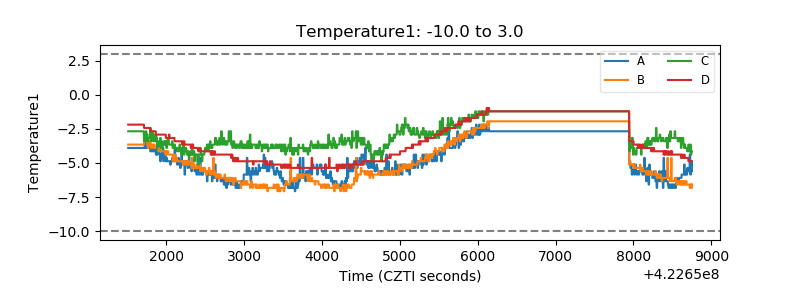 |
| Veto HV Monitor | 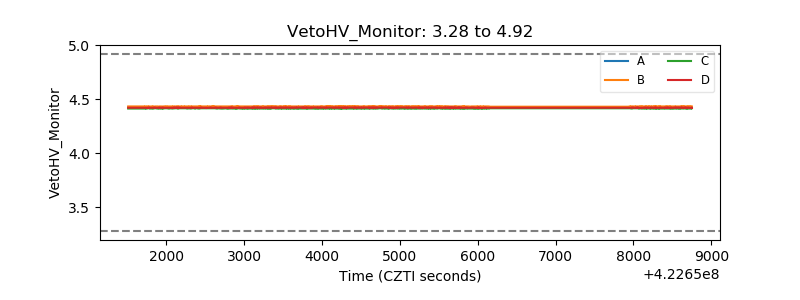 |
| Veto LLD | 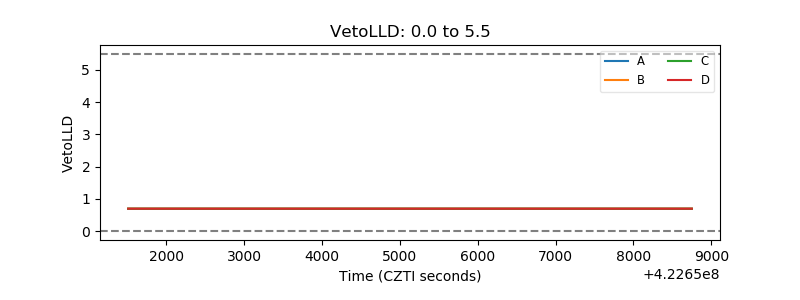 |
| Alpha Counter | 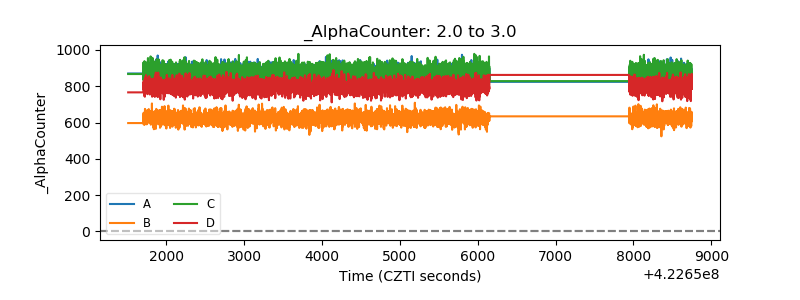 |
| _CPM_Rate | 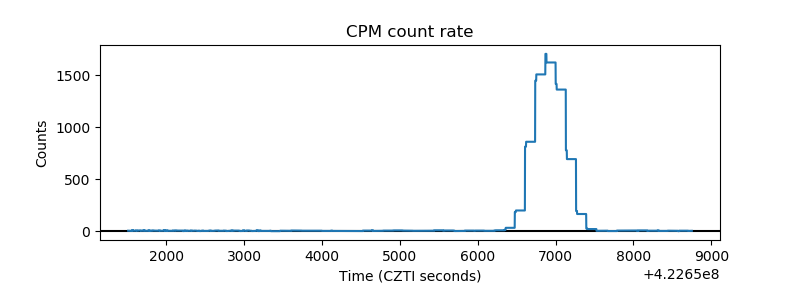 |
| CZT Counter | 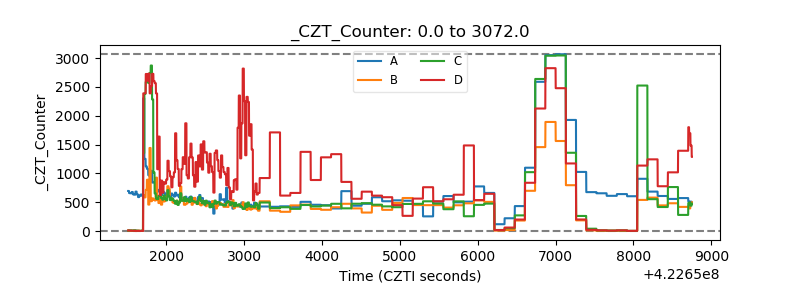 |
| +2.5 Volts monitor | 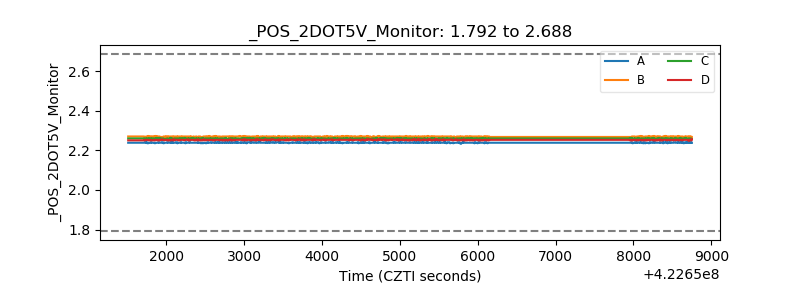 |
| +5 Volts monitor | 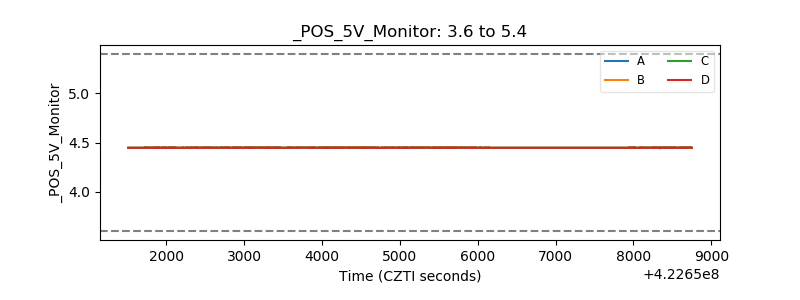 |
| _ROLL_ROT | 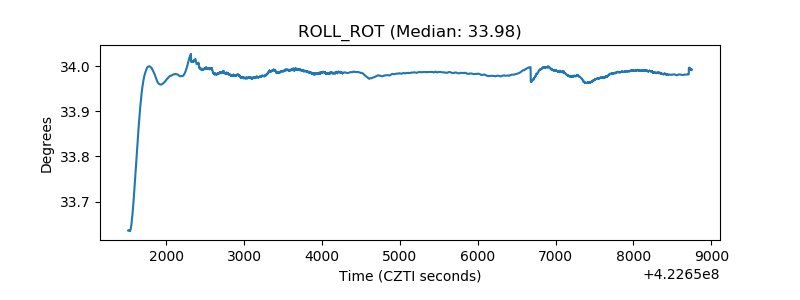 |
| _Roll_DEC |  |
| _Roll_RA | 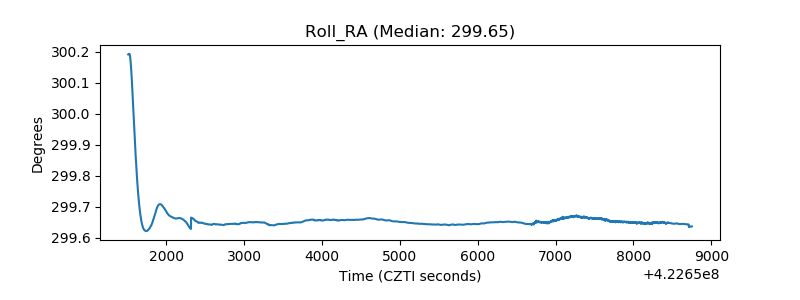 |
| Veto Counter | 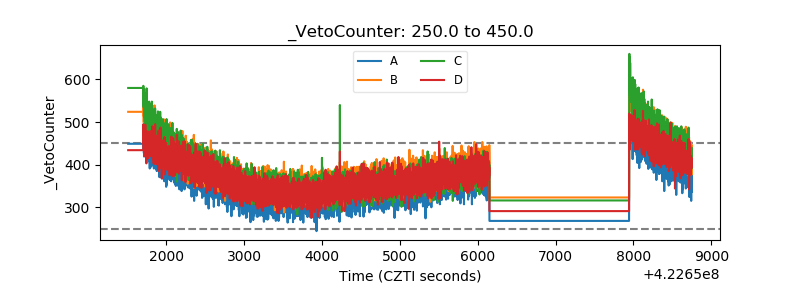 |