| Param | Original file | Final file |
|---|---|---|
| Filename | modeM0/AS1T05_105T01_9000005662_41386cztM0_level2.fits | modeM0/AS1T05_105T01_9000005662_41386cztM0_level2_quad_clean.evt |
| Size (bytes) | 398,355,840 | 89,565,120 |
| Size | 379.9 MB | 85.4 MB |
| Events in quadrant A | 2,755,159 | 616,188 |
| Events in quadrant B | 2,330,730 | 640,734 |
| Events in quadrant C | 3,009,755 | 578,513 |
| Events in quadrant D | 6,255,279 | 521,086 |
| Mode M9 | |||
|---|---|---|---|
| Quadrant | BADHDUFLAG | Total packets | Discarded packets |
| A | 0 | 35 | 0 |
| B | 0 | 35 | 0 |
| C | 0 | 35 | 0 |
| D | 0 | 36 | 0 |
| Mode SS | |||
|---|---|---|---|
| Quadrant | BADHDUFLAG | Total packets | Discarded packets |
| A | 0 | 102 | 0 |
| B | 0 | 102 | 0 |
| C | 0 | 102 | 0 |
| D | 0 | 102 | 0 |
| Mode M0 | |||
|---|---|---|---|
| Quadrant | BADHDUFLAG | Total packets | Discarded packets |
| A | 0 | 11282 | 3 |
| B | 0 | 10336 | 2 |
| C | 0 | 12059 | 2 |
| D | 0 | 22173 | 2 |
| Quadrant | Total seconds | Saturated seconds | Saturation percentage |
|---|---|---|---|
| A | 5081 | 8 | 0.157449% |
| B | 5081 | 8 | 0.157449% |
| C | 5081 | 261 | 5.136784% |
| D | 5081 | 454 | 8.935249% |
Noise dominated data is calculated using 1-second bins in cleaned event files. If a bin has >2000 counts, and if more than 50% of those come from <1% of pixels, then it is considered to be noise-dominated and hence unusable.
| Quadrant | # 1 sec bins | Bins with >0 counts | Bins with >2000 counts | High rate bins dominated by noise | Noise dominated (total time) | Noise dominated (detector-on time) | Marked lightcurve |
|---|---|---|---|---|---|---|---|
| A | 7024 | 5082 | 4 | 4 | 0.06% | 0.08% | 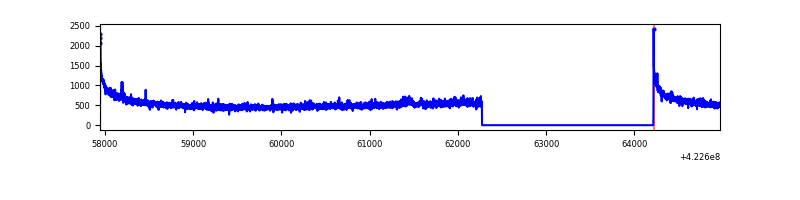 |
| B | 7024 | 5082 | 0 | 0 | 0.00% | 0.00% | 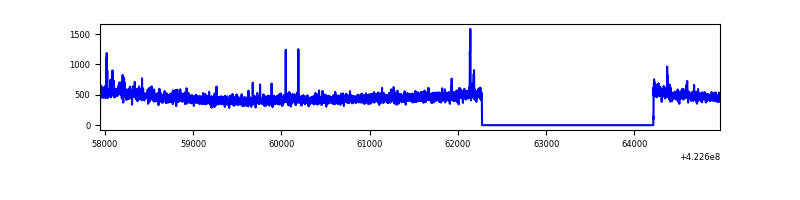 |
| C | 7024 | 5082 | 251 | 251 | 3.57% | 4.94% | 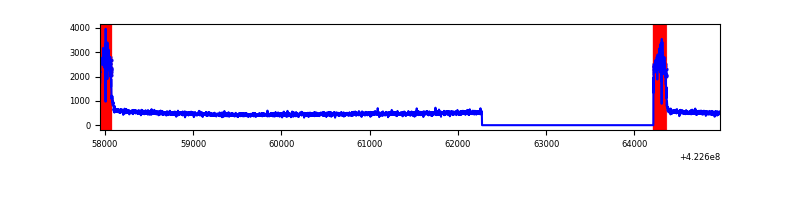 |
| D | 7024 | 5082 | 460 | 460 | 6.55% | 9.05% | 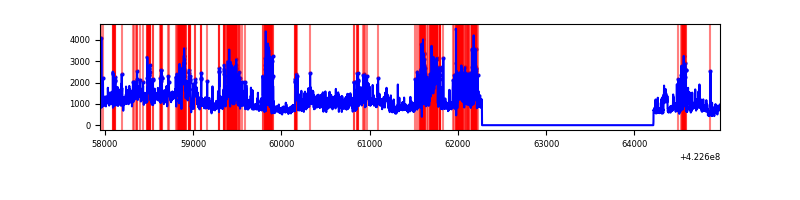 |
Top three noisy pixels from each quadrant. If the there are fewer than three noisy pixels in the level2.evt file, extra rows are filled as -1
| Pixel properties | Quadrant properties | ||||||
|---|---|---|---|---|---|---|---|
| Quadrant | DetID | PixID | Counts | Sigma | Mean | Median | Sigma |
| A | 10 | 83 | 487358 | 4116.17 | 577 | 566 | 118.3 |
| A | 12 | 189 | 28170 | 233.41 | 577 | 566 | 118.3 |
| A | 13 | 254 | 8200 | 64.55 | 577 | 566 | 118.3 |
| B | 0 | 190 | 26633 | 234.86 | 578 | 564 | 111.0 |
| B | 12 | 111 | 13923 | 120.35 | 578 | 564 | 111.0 |
| B | 4 | 81 | 13058 | 112.56 | 578 | 564 | 111.0 |
| C | 0 | 10 | 671635 | 5253.03 | 546 | 550 | 127.8 |
| C | 15 | 214 | 208987 | 1631.57 | 546 | 550 | 127.8 |
| C | 13 | 61 | 3550 | 23.48 | 546 | 550 | 127.8 |
| D | 12 | 79 | 1831969 | 13855.09 | 542 | 529 | 132.2 |
| D | 5 | 222 | 1015556 | 7678.82 | 542 | 529 | 132.2 |
| D | 2 | 249 | 742018 | 5609.46 | 542 | 529 | 132.2 |
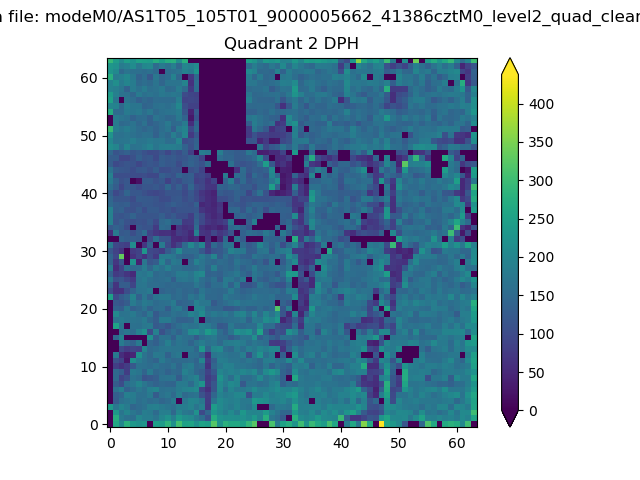
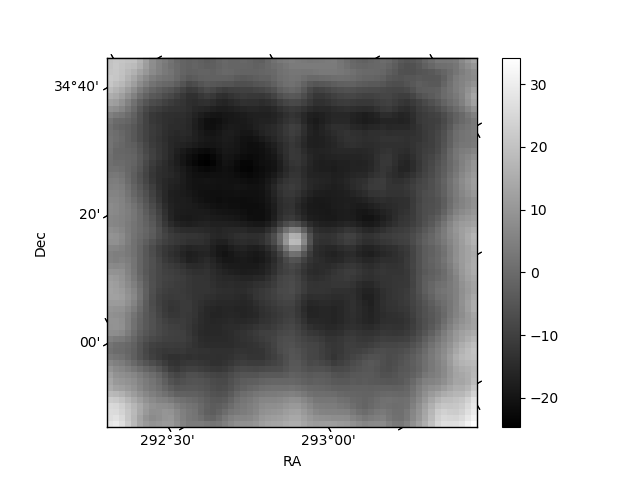
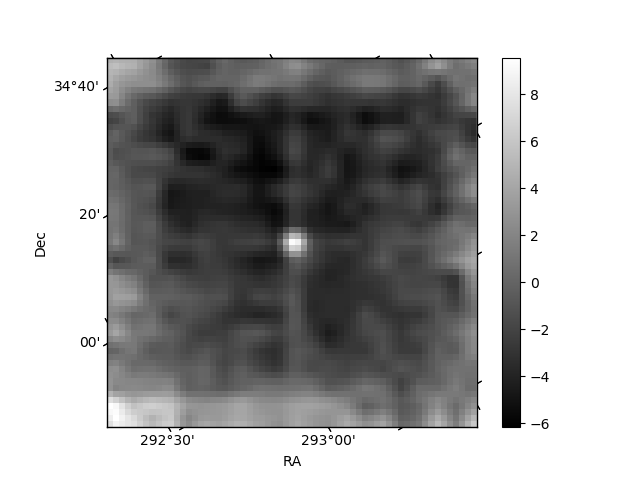
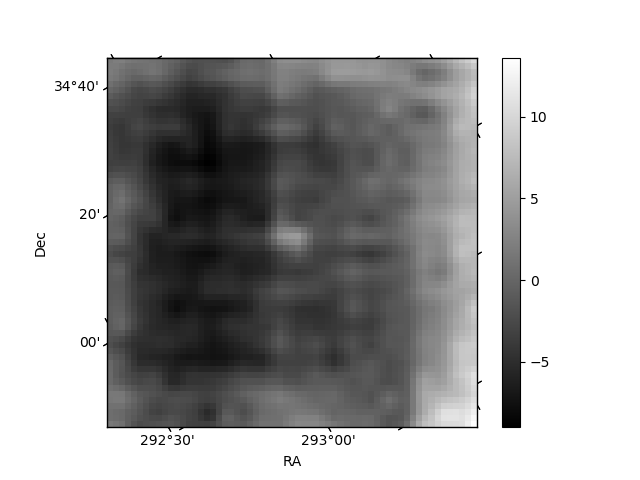
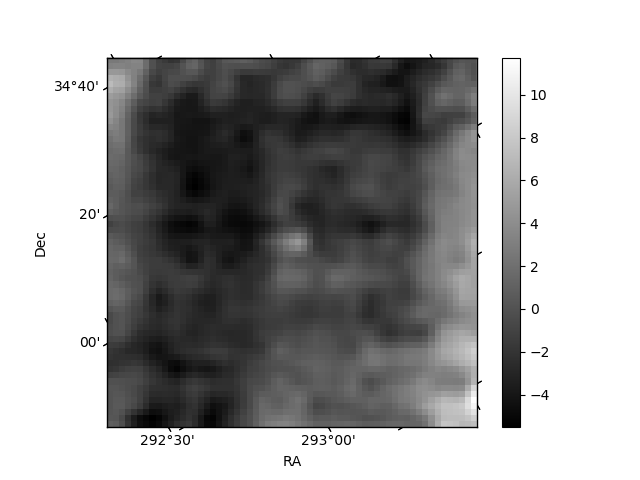
Histogram calculated using DETX and DETY for each event in the final _common_clean file
| Quadrant A | 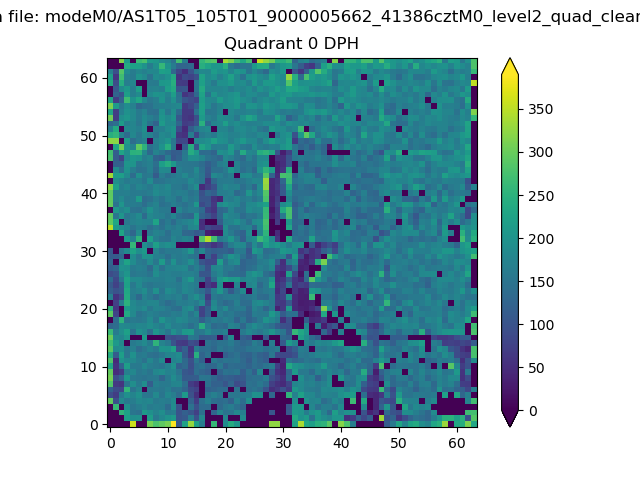 |
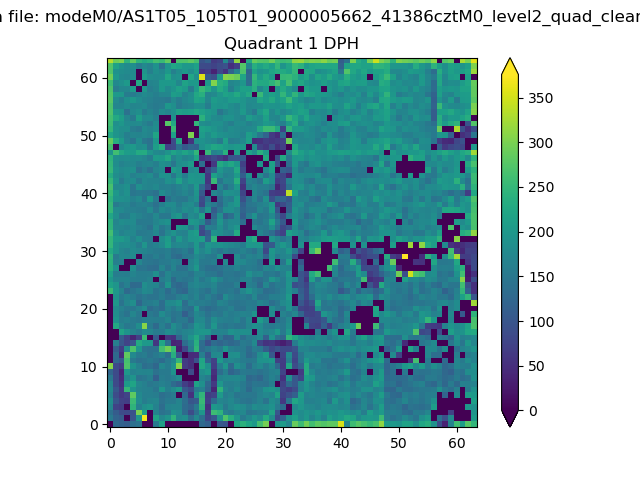 |
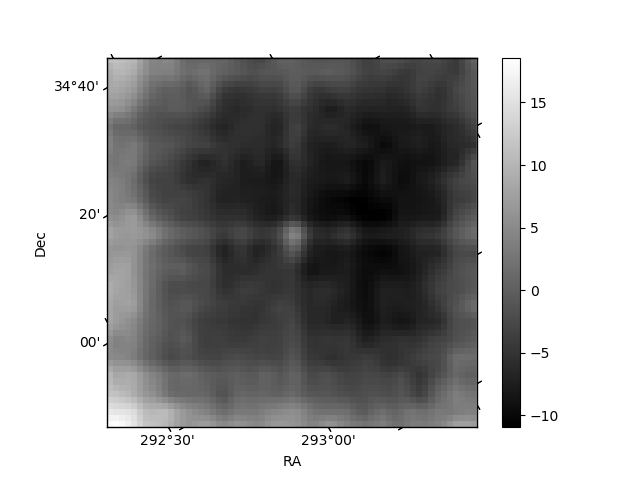
Quadrant B |
|---|---|---|---|
| Quadrant D | 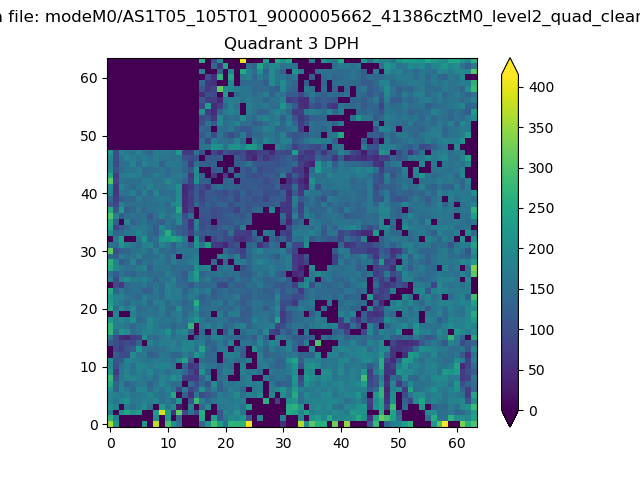 |
 |
Quadrant C |
| Plot type | Count rate plots | Images |
|---|---|---|
| Comparison with Poisson distribution Blue bars denote a histogram of data divided into 1 sec bins. Red curve is a Poisson curve with rate = median count rate of data. |
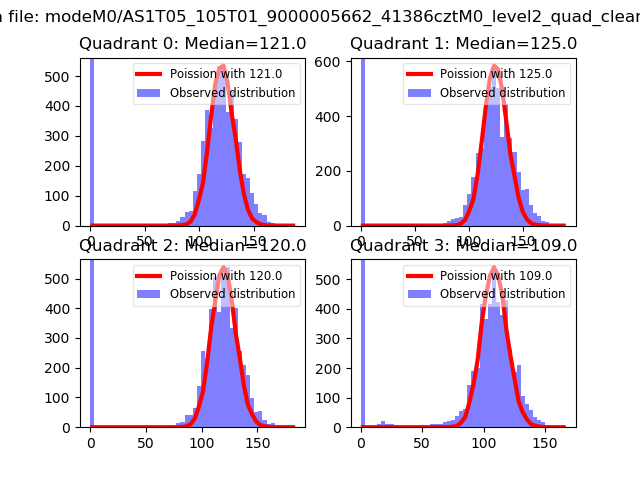 |
 |
| Quadrant-wise count rates Data is divided into 100 sec bins |
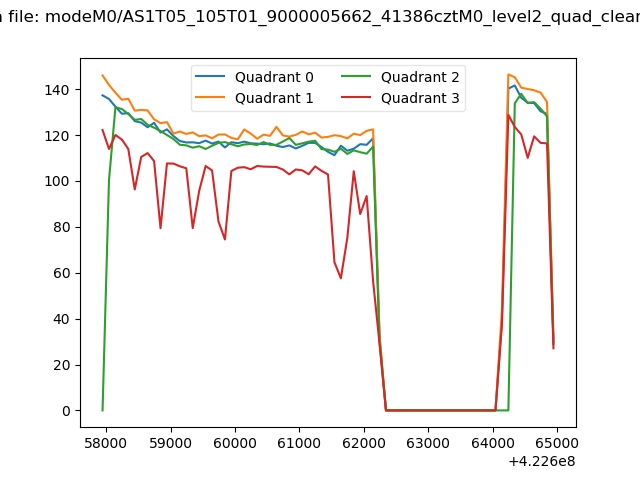 |
|
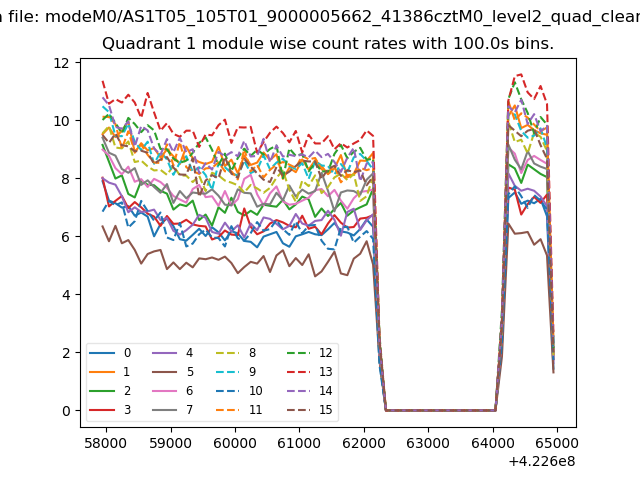
| Module-wise count rates for Quadrant A Data is divided into 100 sec bins |
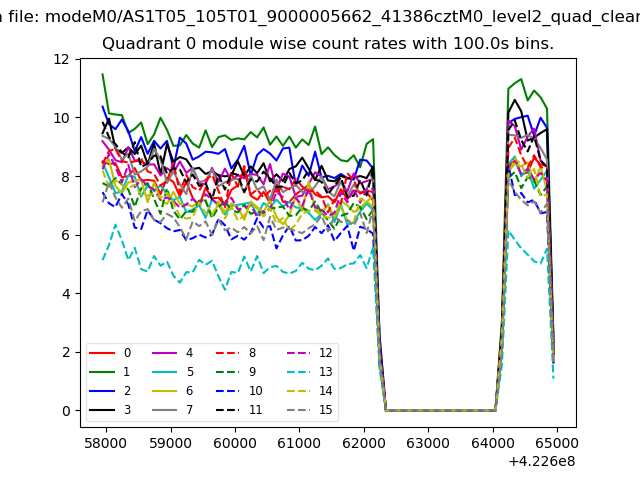 |
 |
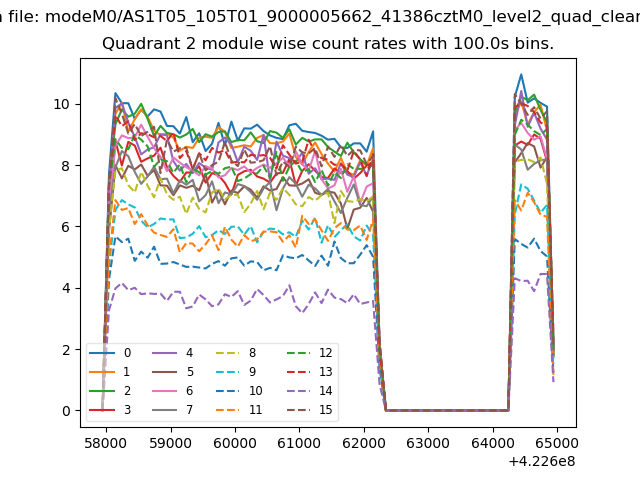
| Module-wise count rates for Quadrant B Data is divided into 100 sec bins |
 |
 |
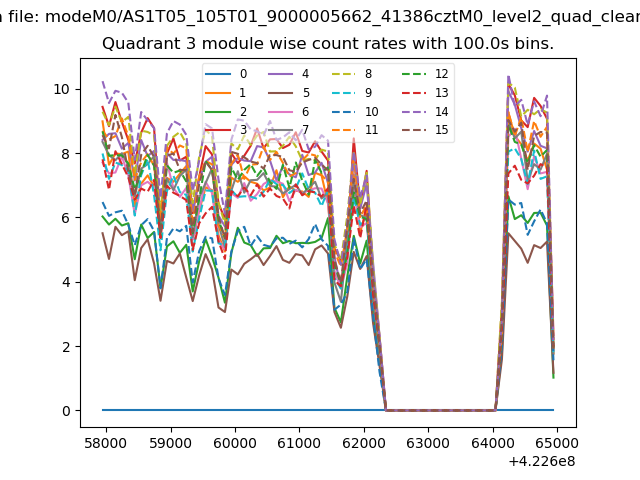
| Module-wise count rates for Quadrant C Data is divided into 100 sec bins |
 |
 |
| Module-wise count rates for Quadrant D Data is divided into 100 sec bins |
 |
 |
| Parameter | Plot |
|---|---|
| CZT HV Monitor | 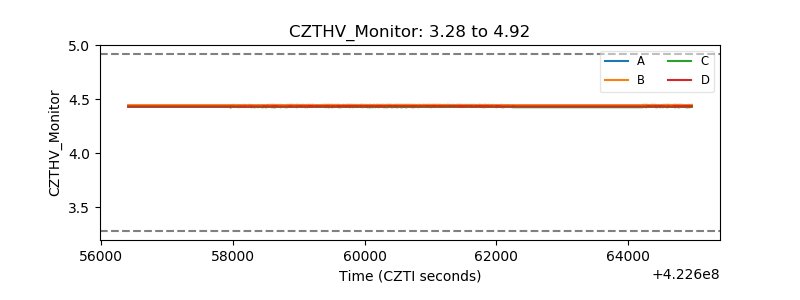 |
| D_VDD | 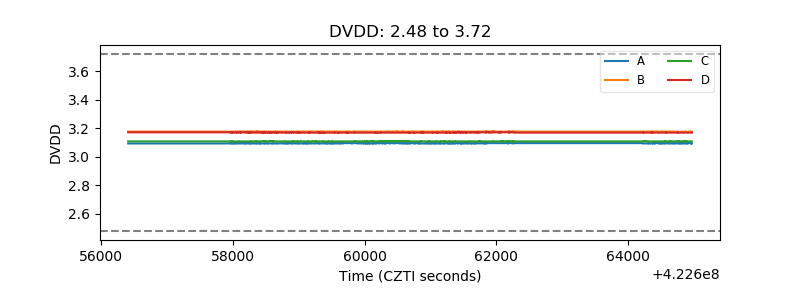 |
| Temperature 1 | 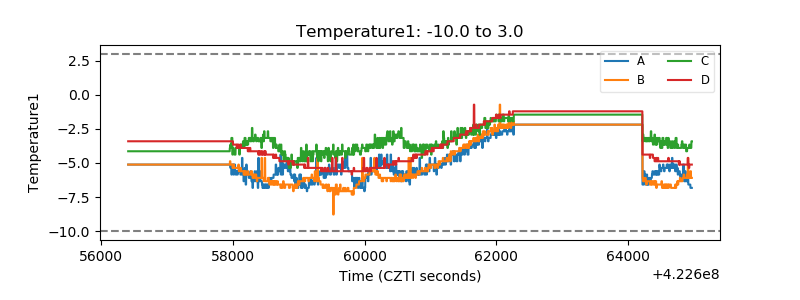 |
| Veto HV Monitor | 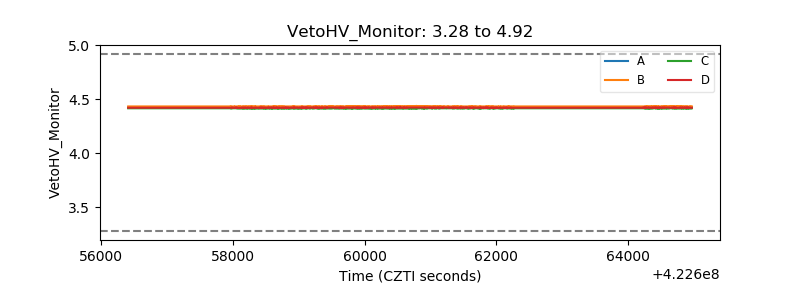 |
| Veto LLD | 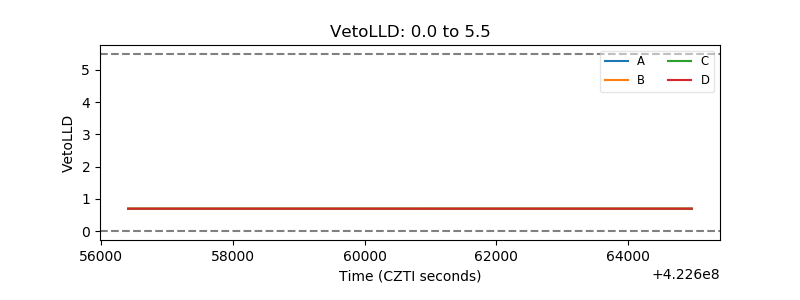 |
| Alpha Counter | 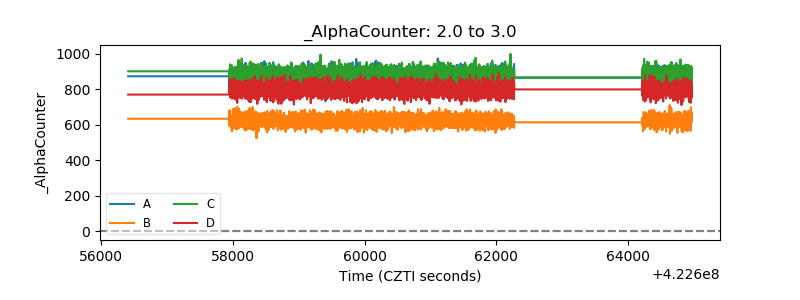 |
| _CPM_Rate | 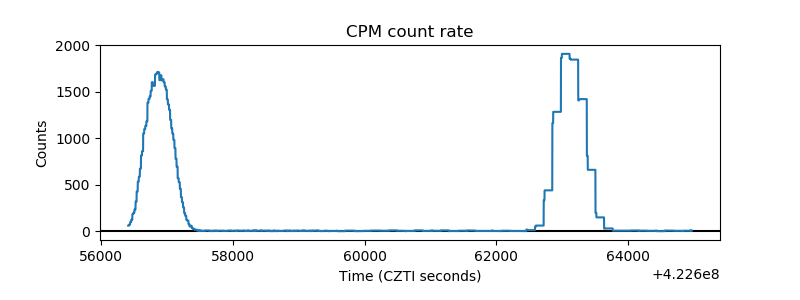 |
| CZT Counter | 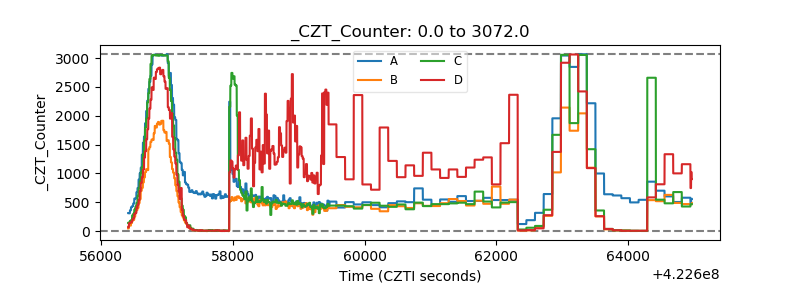 |
| +2.5 Volts monitor | 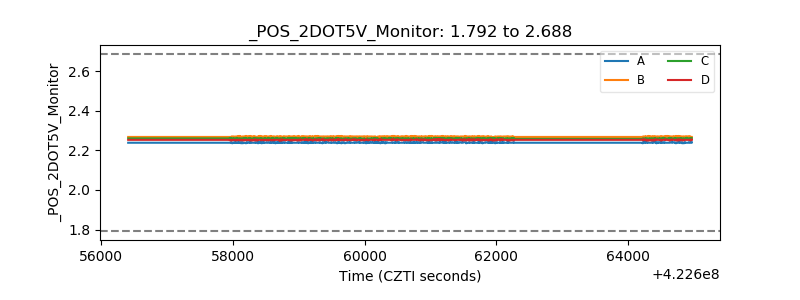 |
| +5 Volts monitor | 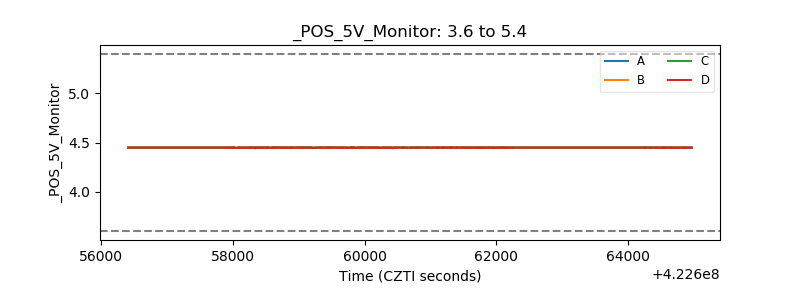 |
| _ROLL_ROT | 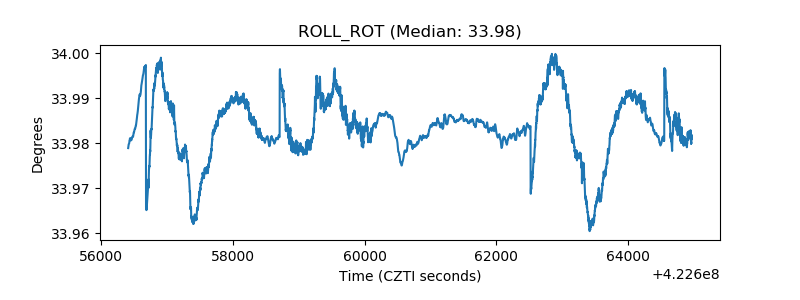 |
| _Roll_DEC | 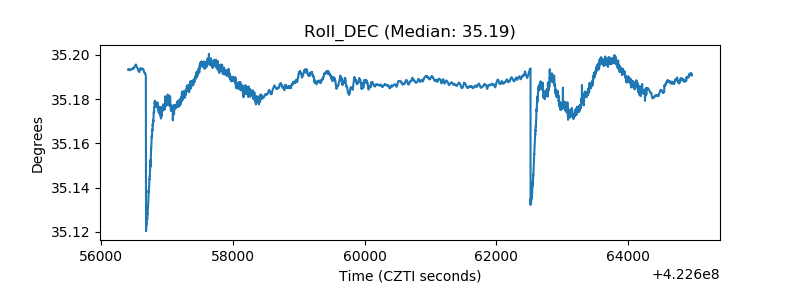 |
| _Roll_RA | 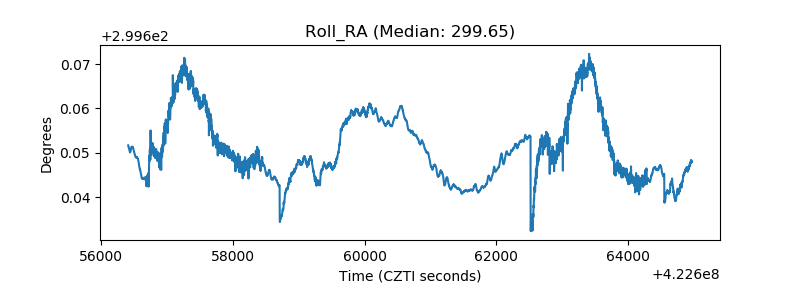 |
| Veto Counter | 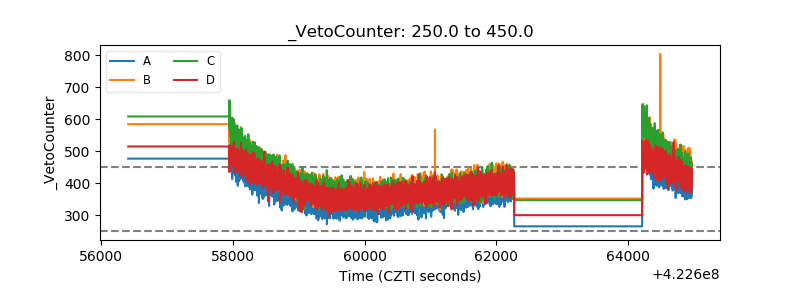 |