| Param | Original file | Final file |
|---|---|---|
| Filename | modeM0/AS1T05_105T01_9000005662_41387cztM0_level2.fits | modeM0/AS1T05_105T01_9000005662_41387cztM0_level2_quad_clean.evt |
| Size (bytes) | 327,162,240 | 89,472,960 |
| Size | 312.0 MB | 85.3 MB |
| Events in quadrant A | 2,701,360 | 611,719 |
| Events in quadrant B | 2,345,809 | 636,850 |
| Events in quadrant C | 3,011,414 | 569,064 |
| Events in quadrant D | 3,663,542 | 542,261 |
| Mode M9 | |||
|---|---|---|---|
| Quadrant | BADHDUFLAG | Total packets | Discarded packets |
| A | 0 | 29 | 0 |
| B | 0 | 29 | 0 |
| C | 0 | 29 | 0 |
| D | 0 | 30 | 0 |
| Mode SS | |||
|---|---|---|---|
| Quadrant | BADHDUFLAG | Total packets | Discarded packets |
| A | 0 | 102 | 0 |
| B | 0 | 102 | 0 |
| C | 0 | 102 | 0 |
| D | 0 | 102 | 0 |
| Mode M0 | |||
|---|---|---|---|
| Quadrant | BADHDUFLAG | Total packets | Discarded packets |
| A | 0 | 11013 | 3 |
| B | 0 | 10269 | 2 |
| C | 0 | 11913 | 2 |
| D | 0 | 14254 | 2 |
| Quadrant | Total seconds | Saturated seconds | Saturation percentage |
|---|---|---|---|
| A | 4985 | 11 | 0.220662% |
| B | 4985 | 16 | 0.320963% |
| C | 4985 | 268 | 5.376128% |
| D | 4985 | 89 | 1.785356% |
Noise dominated data is calculated using 1-second bins in cleaned event files. If a bin has >2000 counts, and if more than 50% of those come from <1% of pixels, then it is considered to be noise-dominated and hence unusable.
| Quadrant | # 1 sec bins | Bins with >0 counts | Bins with >2000 counts | High rate bins dominated by noise | Noise dominated (total time) | Noise dominated (detector-on time) | Marked lightcurve |
|---|---|---|---|---|---|---|---|
| A | 7019 | 4986 | 3 | 3 | 0.04% | 0.06% | 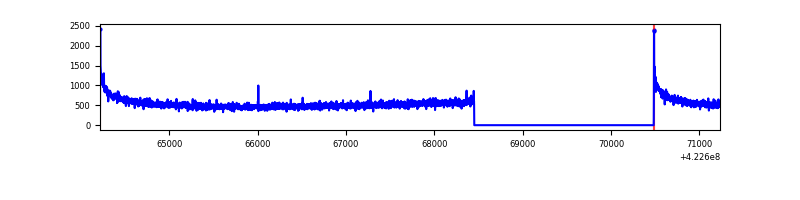 |
| B | 7019 | 4986 | 1 | 1 | 0.01% | 0.02% | 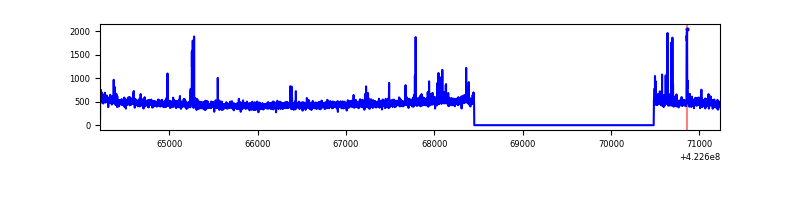 |
| C | 7019 | 4986 | 261 | 261 | 3.72% | 5.23% | 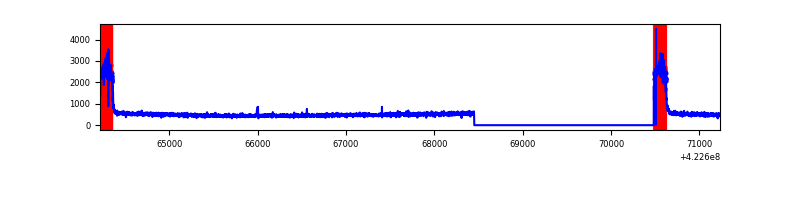 |
| D | 7019 | 4986 | 84 | 84 | 1.20% | 1.68% | 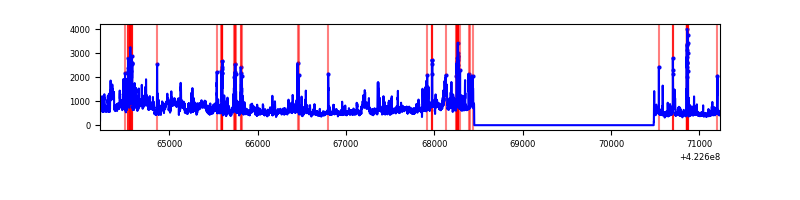 |
Top three noisy pixels from each quadrant. If the there are fewer than three noisy pixels in the level2.evt file, extra rows are filled as -1
| Pixel properties | Quadrant properties | ||||||
|---|---|---|---|---|---|---|---|
| Quadrant | DetID | PixID | Counts | Sigma | Mean | Median | Sigma |
| A | 10 | 83 | 485137 | 4124.35 | 567 | 557 | 117.5 |
| A | 12 | 189 | 11102 | 89.75 | 567 | 557 | 117.5 |
| A | 13 | 6 | 9977 | 80.18 | 567 | 557 | 117.5 |
| B | 5 | 255 | 72425 | 654.74 | 570 | 556 | 109.8 |
| B | 0 | 190 | 22593 | 200.76 | 570 | 556 | 109.8 |
| B | 12 | 111 | 13567 | 118.53 | 570 | 556 | 109.8 |
| C | 0 | 10 | 715657 | 5697.51 | 534 | 540 | 125.5 |
| C | 15 | 214 | 204973 | 1628.77 | 534 | 540 | 125.5 |
| C | 3 | 233 | 5145 | 36.69 | 534 | 540 | 125.5 |
| D | 12 | 79 | 820166 | 6190.9 | 545 | 532 | 132.4 |
| D | 5 | 222 | 205512 | 1548.27 | 545 | 532 | 132.4 |
| D | 1 | 52 | 198311 | 1493.88 | 545 | 532 | 132.4 |
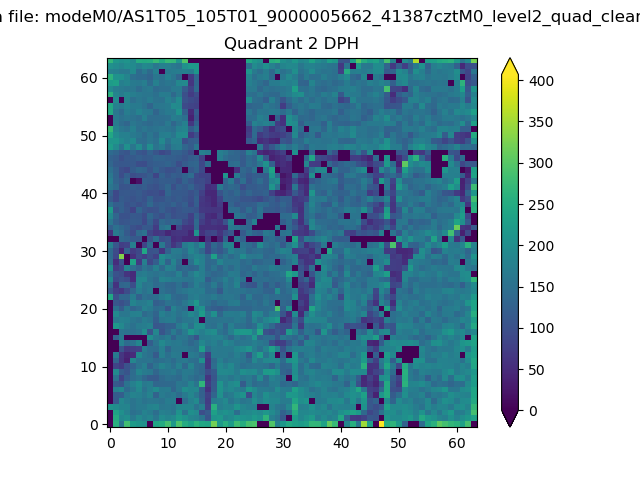
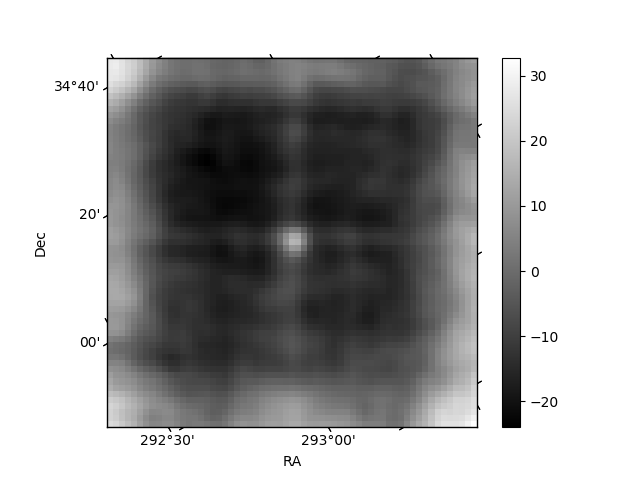
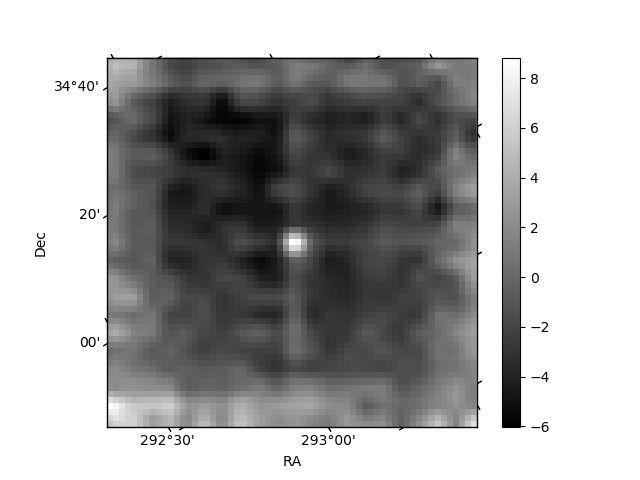
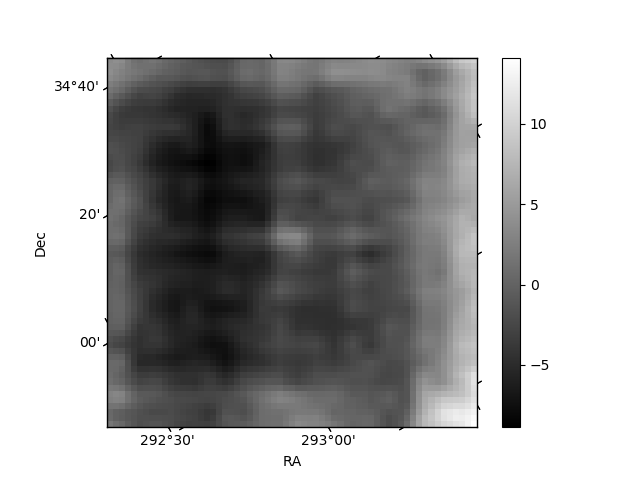
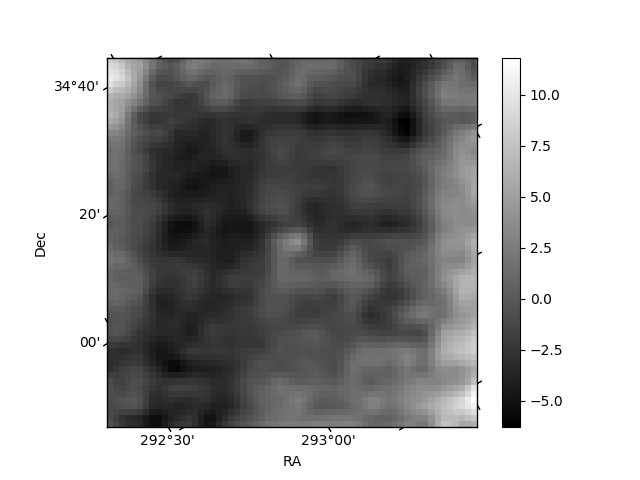
Histogram calculated using DETX and DETY for each event in the final _common_clean file
| Quadrant A | 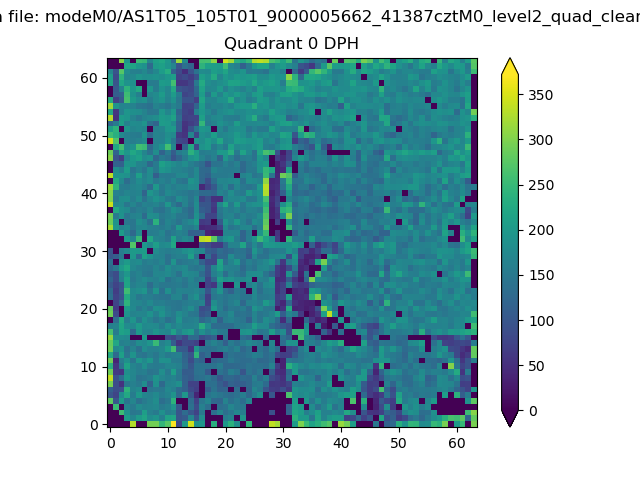 |
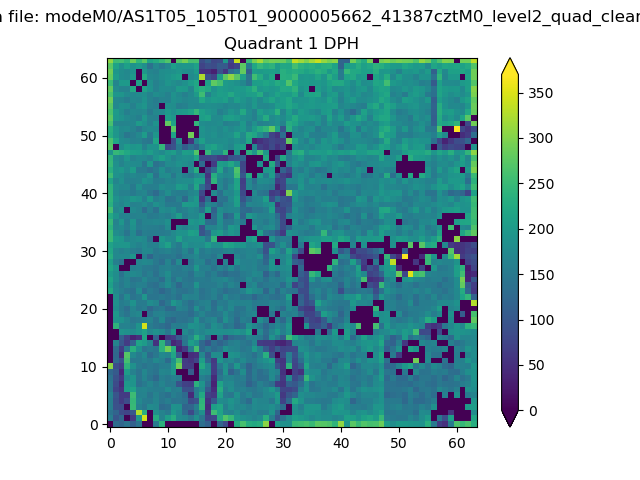 |
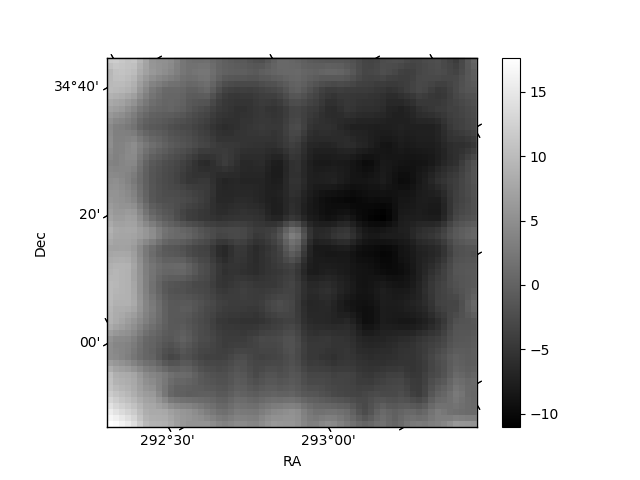
Quadrant B |
|---|---|---|---|
| Quadrant D | 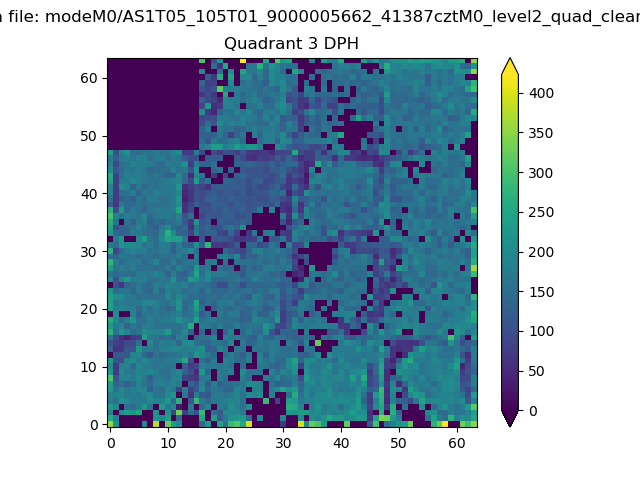 |
 |
Quadrant C |
| Plot type | Count rate plots | Images |
|---|---|---|
| Comparison with Poisson distribution Blue bars denote a histogram of data divided into 1 sec bins. Red curve is a Poisson curve with rate = median count rate of data. |
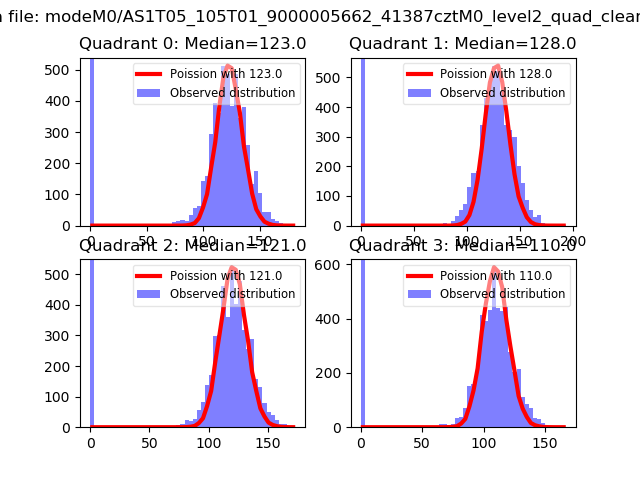 |
 |
| Quadrant-wise count rates Data is divided into 100 sec bins |
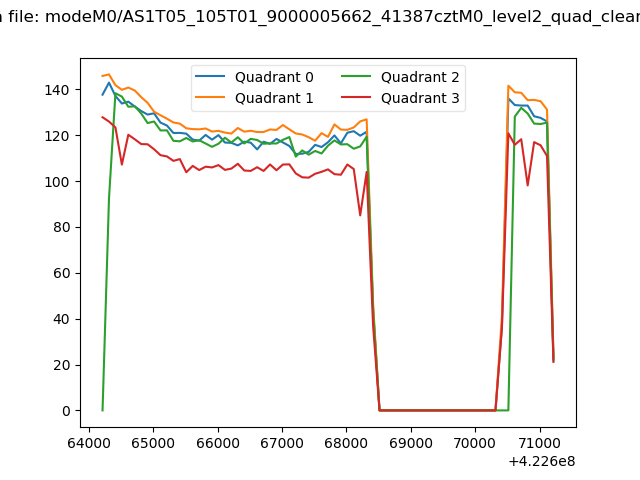 |
|
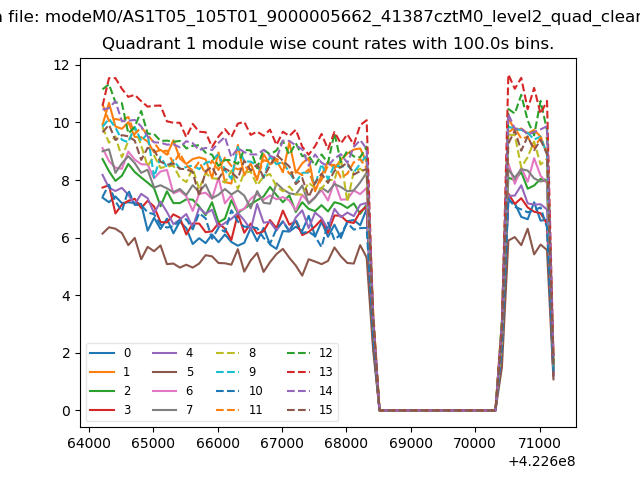
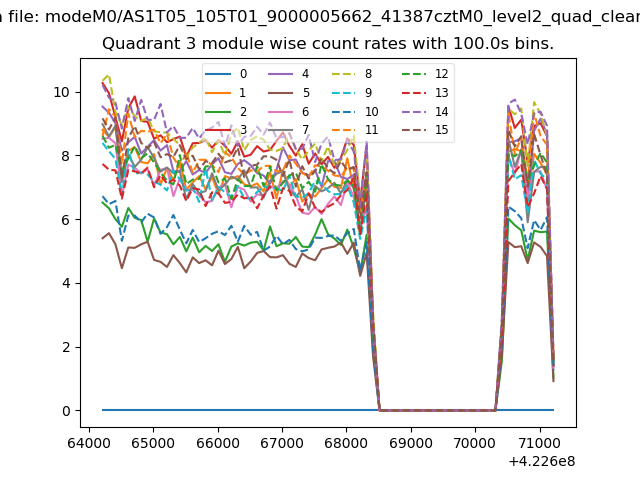
| Module-wise count rates for Quadrant A Data is divided into 100 sec bins |
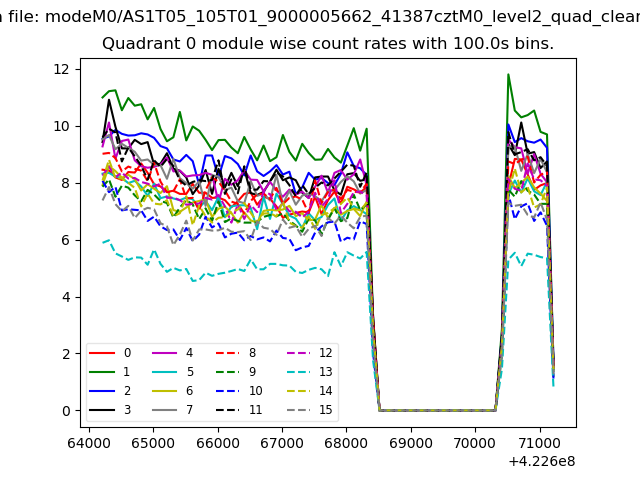 |
 |
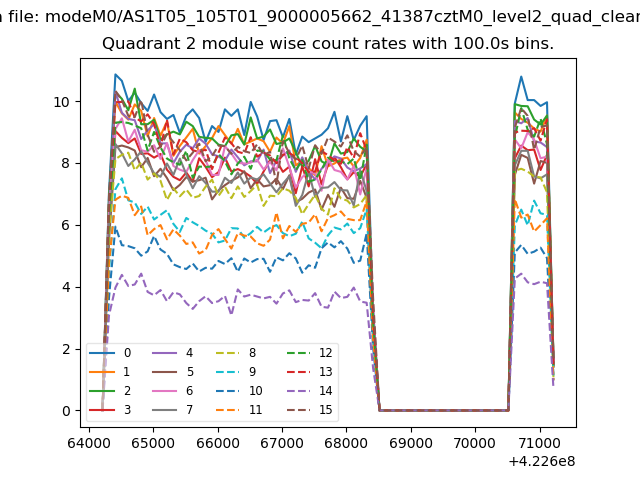
| Module-wise count rates for Quadrant B Data is divided into 100 sec bins |
 |
 |
| Module-wise count rates for Quadrant C Data is divided into 100 sec bins |
 |
 |
| Module-wise count rates for Quadrant D Data is divided into 100 sec bins |
 |
 |
| Parameter | Plot |
|---|---|
| CZT HV Monitor | 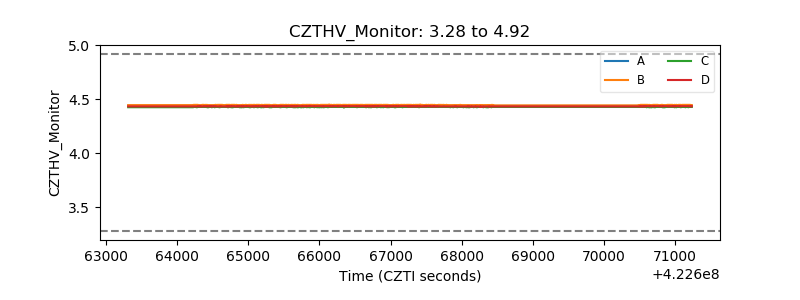 |
| D_VDD | 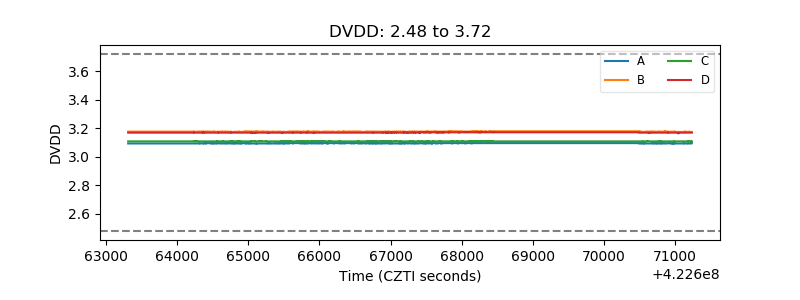 |
| Temperature 1 | 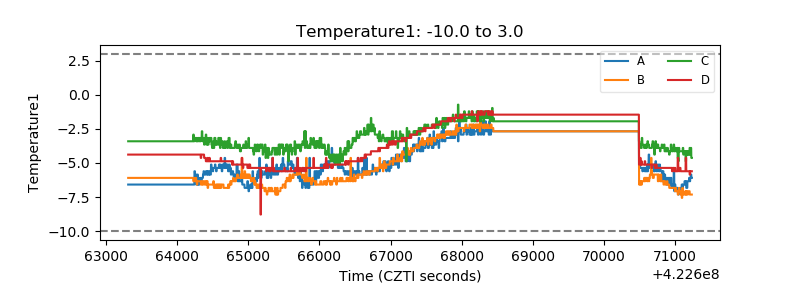 |
| Veto HV Monitor | 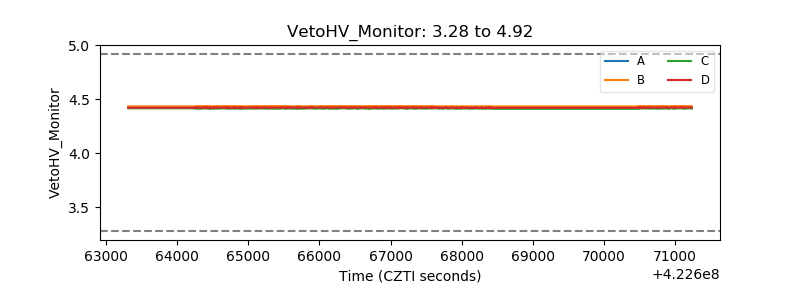 |
| Veto LLD | 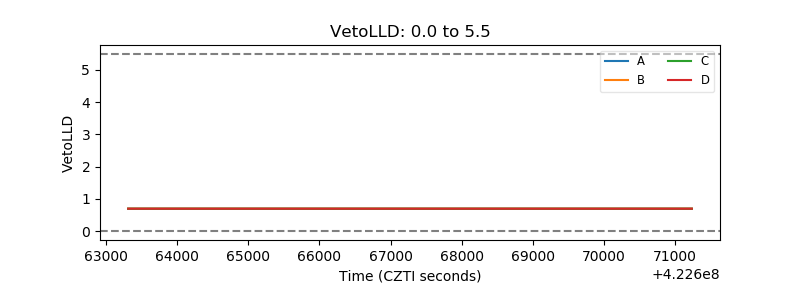 |
| Alpha Counter | 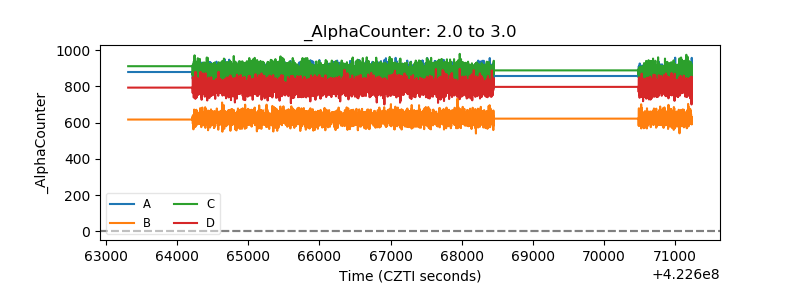 |
| _CPM_Rate | 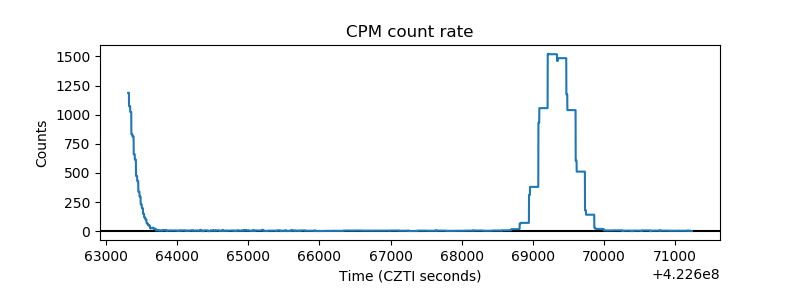 |
| CZT Counter | 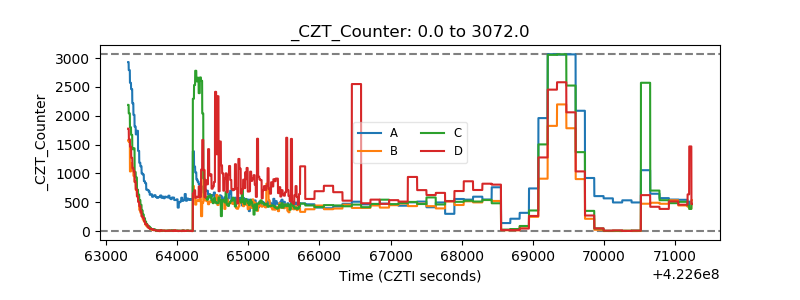 |
| +2.5 Volts monitor | 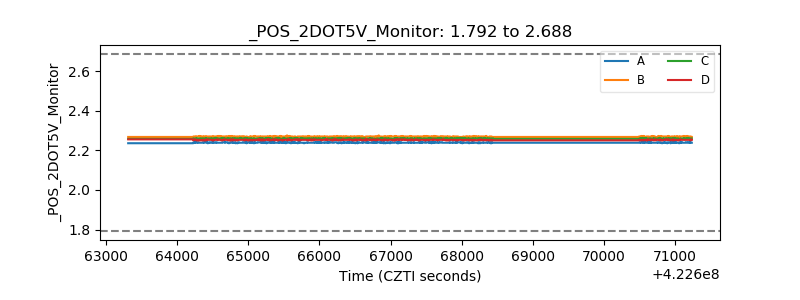 |
| +5 Volts monitor | 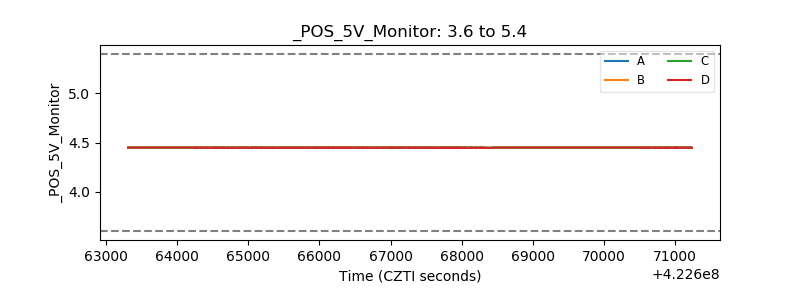 |
| _ROLL_ROT | 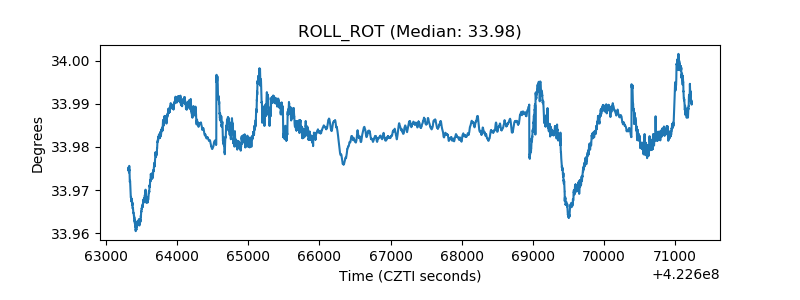 |
| _Roll_DEC | 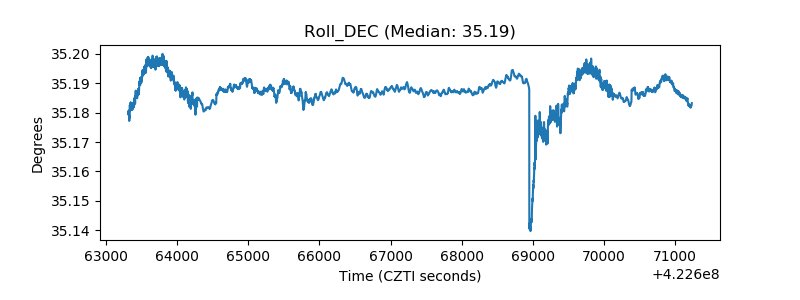 |
| _Roll_RA | 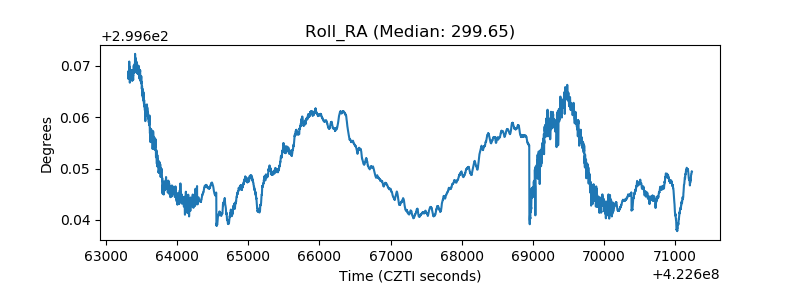 |
| Veto Counter | 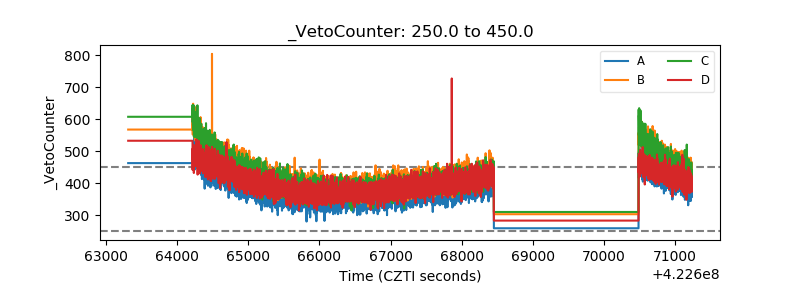 |