| Param | Original file | Final file |
|---|---|---|
| Filename | modeM0/AS1T05_105T01_9000005662_41389cztM0_level2.fits | modeM0/AS1T05_105T01_9000005662_41389cztM0_level2_quad_clean.evt |
| Size (bytes) | 526,357,440 | 139,608,000 |
| Size | 502.0 MB | 133.1 MB |
| Events in quadrant A | 4,458,918 | 957,758 |
| Events in quadrant B | 3,828,343 | 997,958 |
| Events in quadrant C | 4,612,637 | 899,588 |
| Events in quadrant D | 5,938,531 | 794,739 |
| Mode M9 | |||
|---|---|---|---|
| Quadrant | BADHDUFLAG | Total packets | Discarded packets |
| A | 0 | 45 | 2 |
| B | 0 | 55 | 12 |
| C | 0 | 44 | 1 |
| D | 0 | 46 | 3 |
| Mode SS | |||
|---|---|---|---|
| Quadrant | BADHDUFLAG | Total packets | Discarded packets |
| A | 0 | 189 | 11 |
| B | 0 | 189 | 14 |
| C | 0 | 181 | 10 |
| D | 0 | 190 | 16 |
| Mode M0 | |||
|---|---|---|---|
| Quadrant | BADHDUFLAG | Total packets | Discarded packets |
| A | 0 | 19822 | 1643 |
| B | 0 | 18583 | 1602 |
| C | 0 | 20741 | 1864 |
| D | 0 | 25539 | 2171 |
| Quadrant | Total seconds | Saturated seconds | Saturation percentage |
|---|---|---|---|
| A | 8299 | 26 | 0.313291% |
| B | 8318 | 19 | 0.228420% |
| C | 8293 | 304 | 3.665742% |
| D | 8263 | 656 | 7.939005% |
Noise dominated data is calculated using 1-second bins in cleaned event files. If a bin has >2000 counts, and if more than 50% of those come from <1% of pixels, then it is considered to be noise-dominated and hence unusable.
| Quadrant | # 1 sec bins | Bins with >0 counts | Bins with >2000 counts | High rate bins dominated by noise | Noise dominated (total time) | Noise dominated (detector-on time) | Marked lightcurve |
|---|---|---|---|---|---|---|---|
| A | 13510 | 8736 | 7 | 7 | 0.05% | 0.08% | 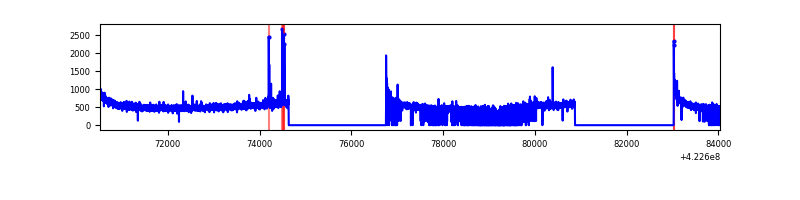 |
| B | 13510 | 8738 | 3 | 3 | 0.02% | 0.03% | 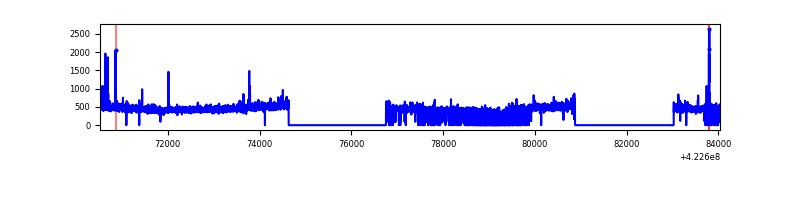 |
| C | 13508 | 8745 | 281 | 281 | 2.08% | 3.21% | 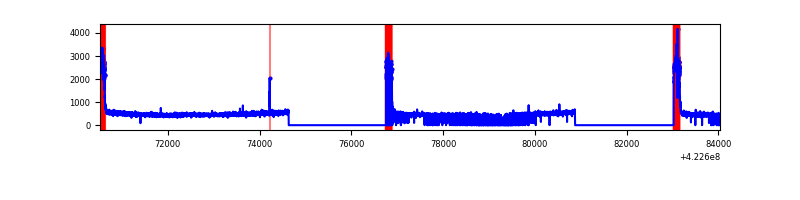 |
| D | 13510 | 8717 | 506 | 506 | 3.75% | 5.80% | 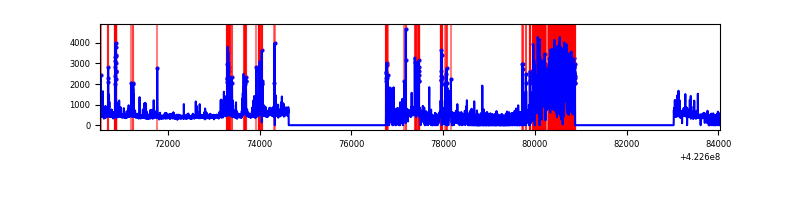 |
Top three noisy pixels from each quadrant. If the there are fewer than three noisy pixels in the level2.evt file, extra rows are filled as -1
| Pixel properties | Quadrant properties | ||||||
|---|---|---|---|---|---|---|---|
| Quadrant | DetID | PixID | Counts | Sigma | Mean | Median | Sigma |
| A | 10 | 83 | 762408 | 4016.14 | 933 | 916 | 189.6 |
| A | 13 | 248 | 42474 | 219.18 | 933 | 916 | 189.6 |
| A | 13 | 6 | 19543 | 98.24 | 933 | 916 | 189.6 |
| B | 0 | 190 | 57107 | 316.53 | 932 | 909 | 177.5 |
| B | 0 | 229 | 53345 | 295.34 | 932 | 909 | 177.5 |
| B | 5 | 255 | 52335 | 289.65 | 932 | 909 | 177.5 |
| C | 0 | 10 | 816782 | 3974.95 | 883 | 891 | 205.3 |
| C | 15 | 214 | 344567 | 1674.36 | 883 | 891 | 205.3 |
| C | 12 | 251 | 7959 | 34.43 | 883 | 891 | 205.3 |
| D | 2 | 249 | 1203651 | 5698.42 | 859 | 835 | 211.1 |
| D | 1 | 52 | 385306 | 1821.46 | 859 | 835 | 211.1 |
| D | 1 | 47 | 313107 | 1479.41 | 859 | 835 | 211.1 |
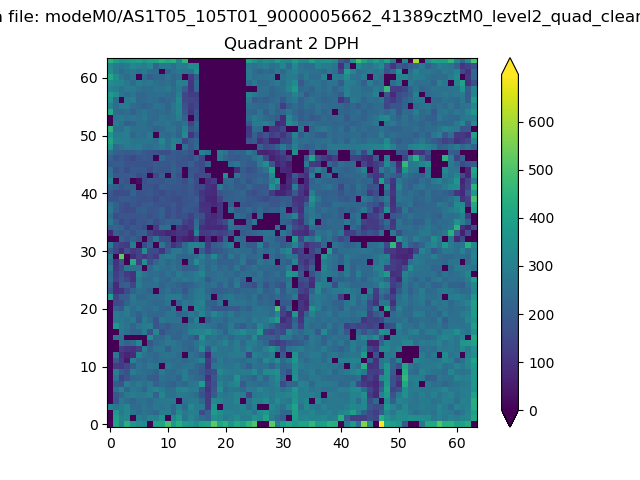
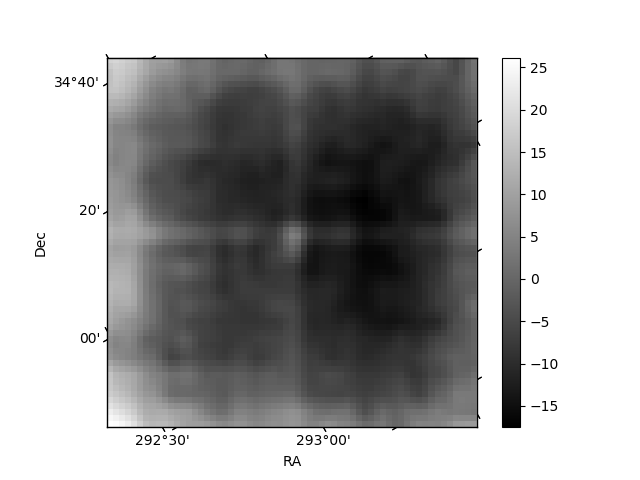
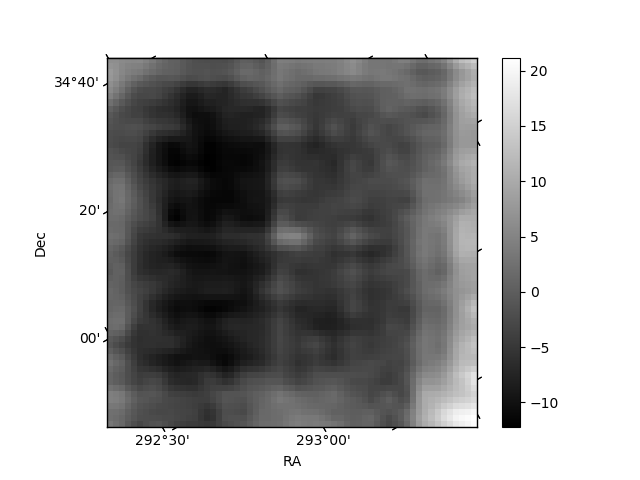
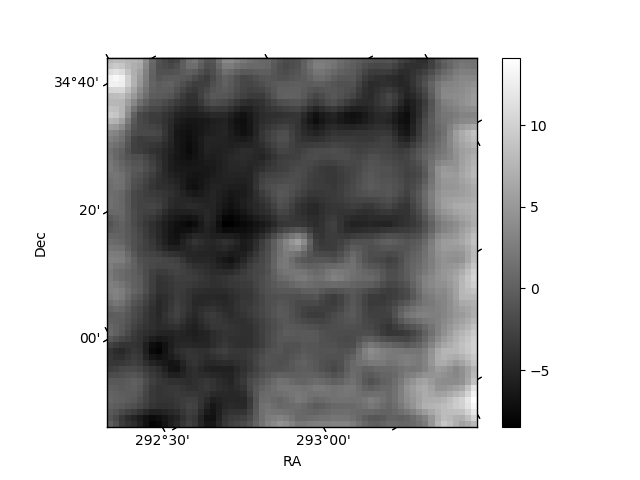
Histogram calculated using DETX and DETY for each event in the final _common_clean file
| Quadrant A | 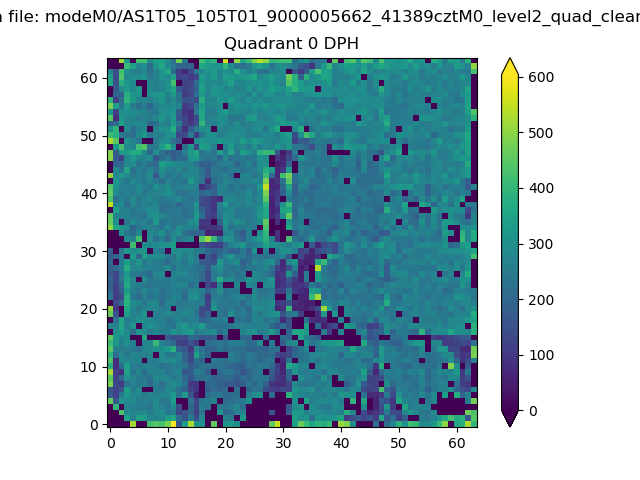 |
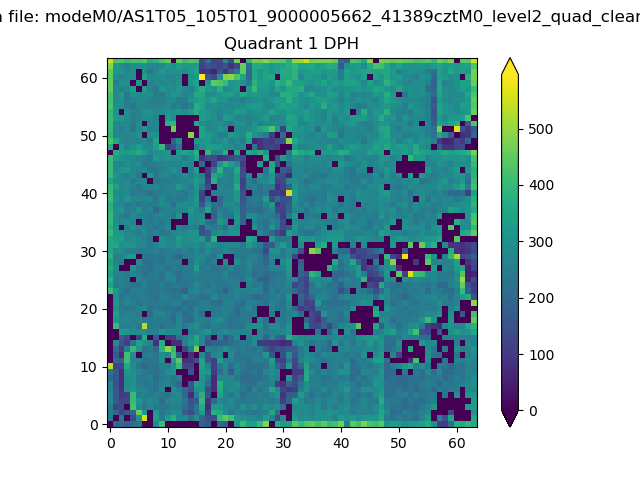 |
Quadrant B |
|---|---|---|---|
| Quadrant D | 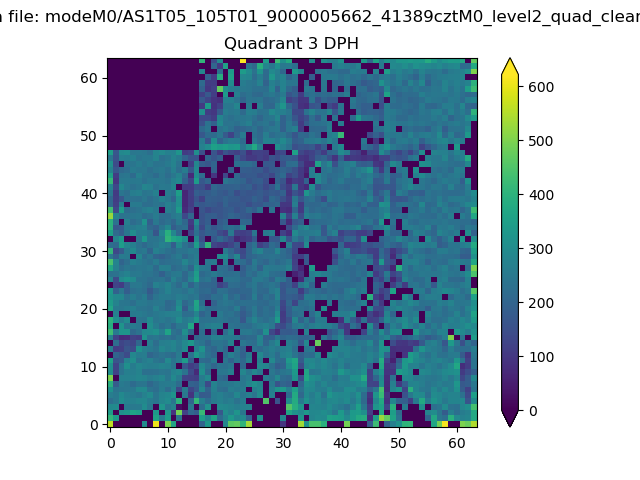 |
 |
Quadrant C |
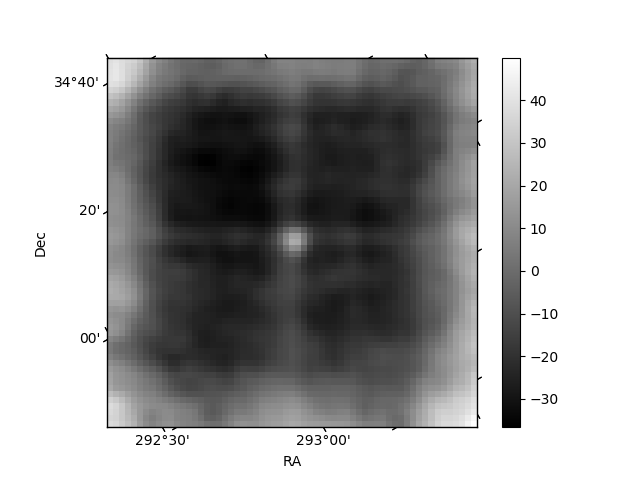
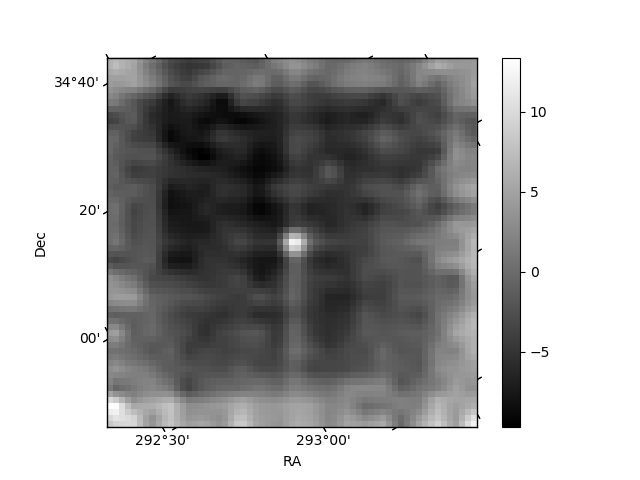
| Plot type | Count rate plots | Images |
|---|---|---|
| Comparison with Poisson distribution Blue bars denote a histogram of data divided into 1 sec bins. Red curve is a Poisson curve with rate = median count rate of data. |
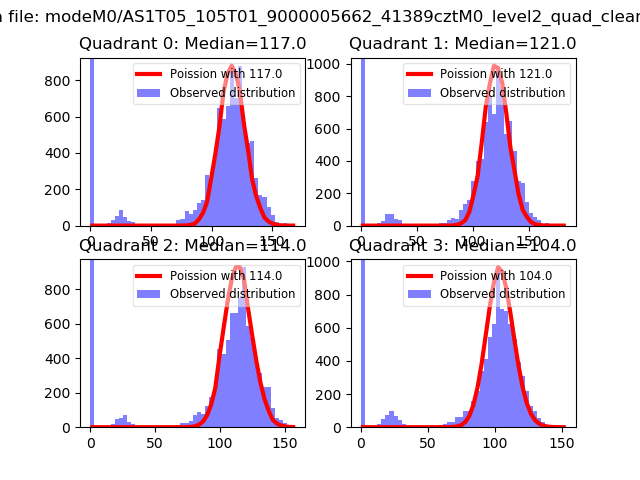 |
 |
| Quadrant-wise count rates Data is divided into 100 sec bins |
 |
|
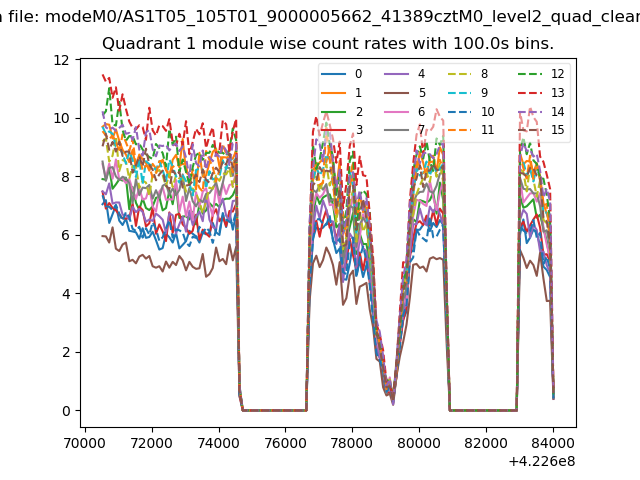
| Module-wise count rates for Quadrant A Data is divided into 100 sec bins |
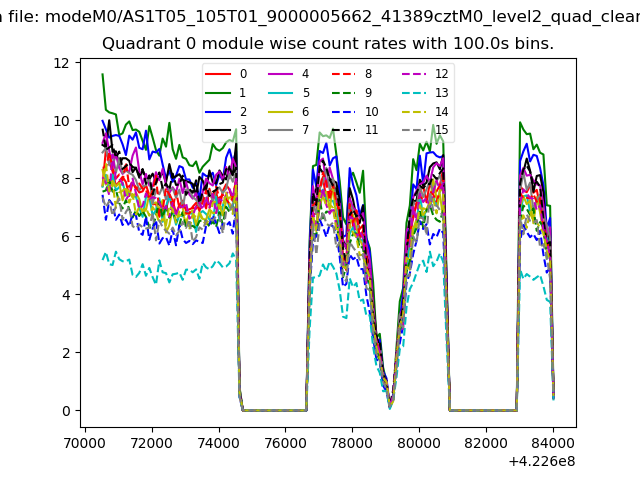 |
 |
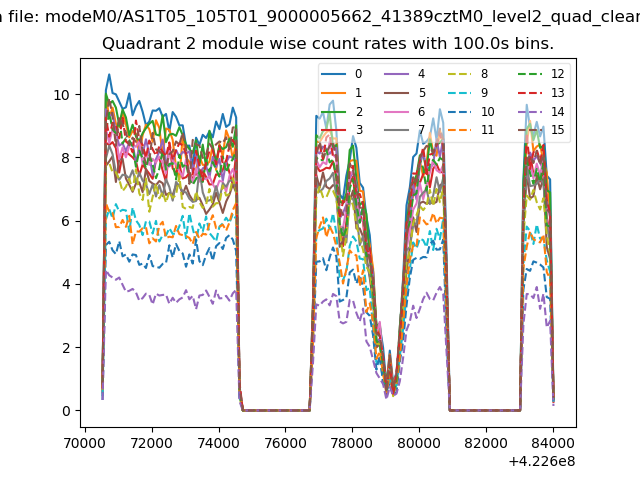
| Module-wise count rates for Quadrant B Data is divided into 100 sec bins |
 |
 |
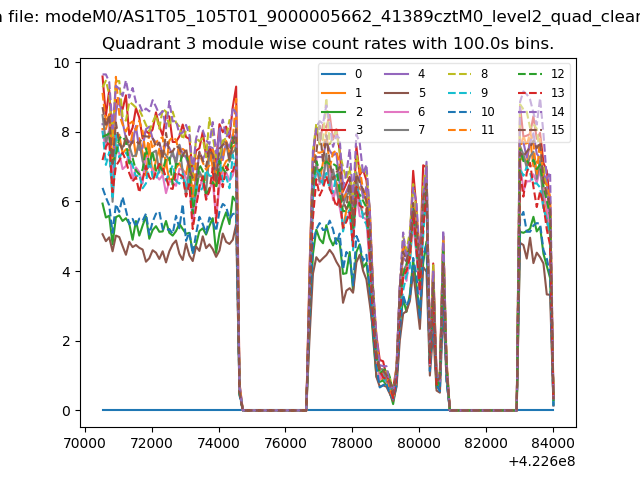
| Module-wise count rates for Quadrant C Data is divided into 100 sec bins |
 |
 |
| Module-wise count rates for Quadrant D Data is divided into 100 sec bins |
 |
 |
| Parameter | Plot |
|---|---|
| CZT HV Monitor | 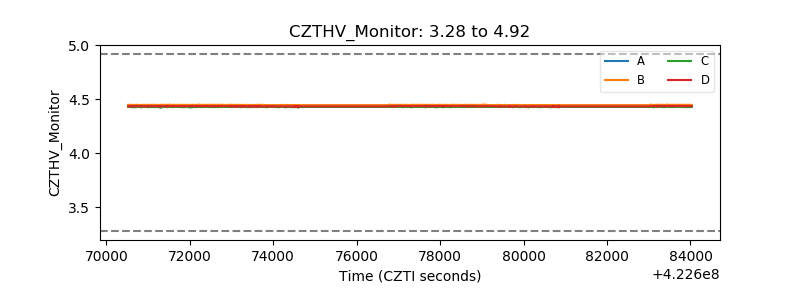 |
| D_VDD | 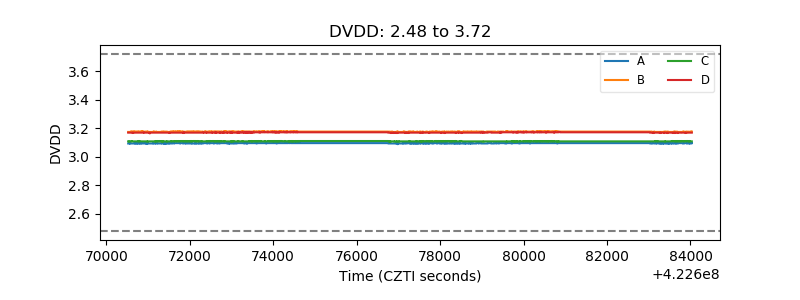 |
| Temperature 1 | 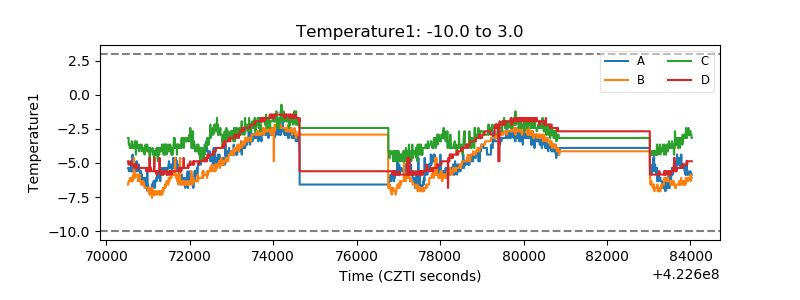 |
| Veto HV Monitor | 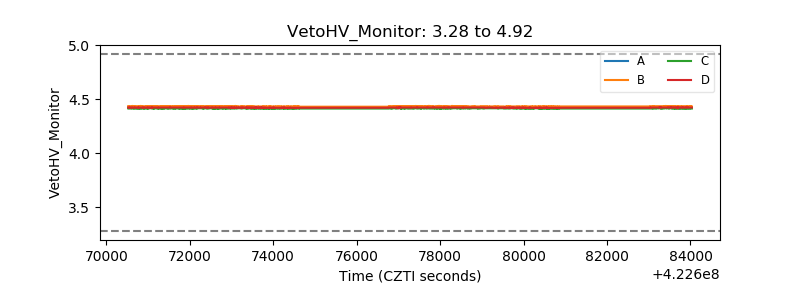 |
| Veto LLD | 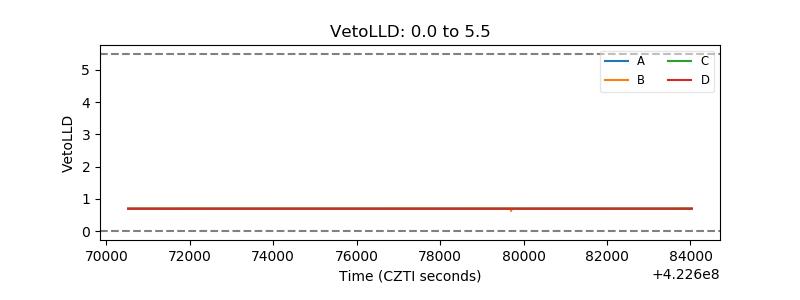 |
| Alpha Counter | 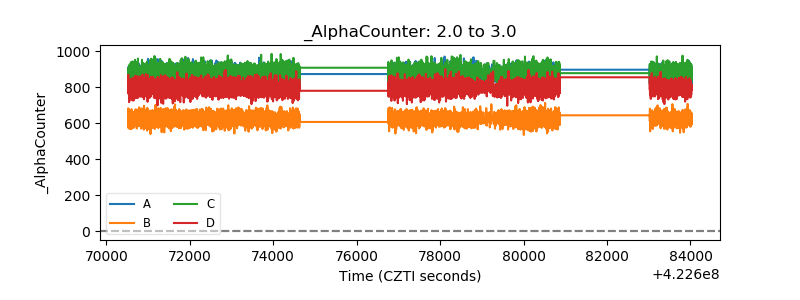 |
| _CPM_Rate | 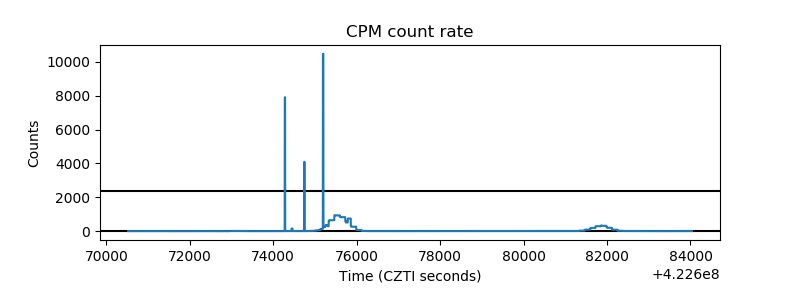 |
| CZT Counter | 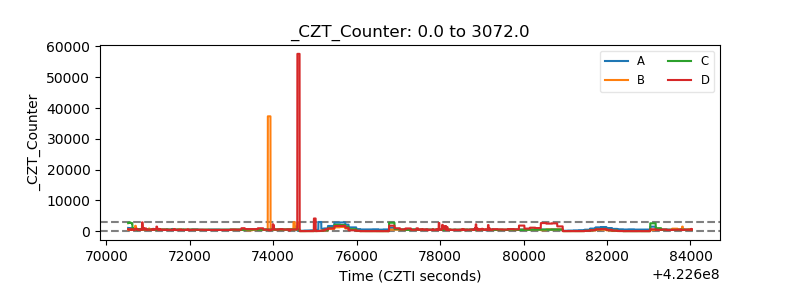 |
| +2.5 Volts monitor | 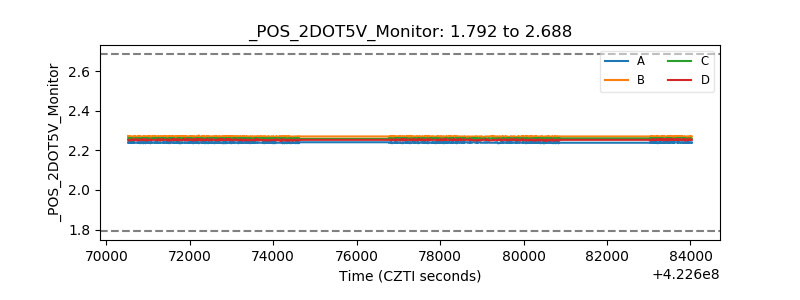 |
| +5 Volts monitor | 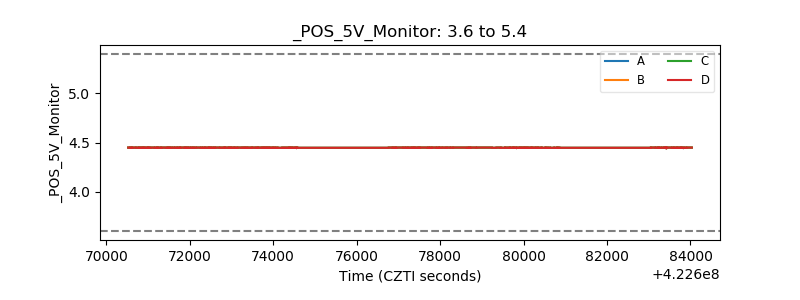 |
| _ROLL_ROT | 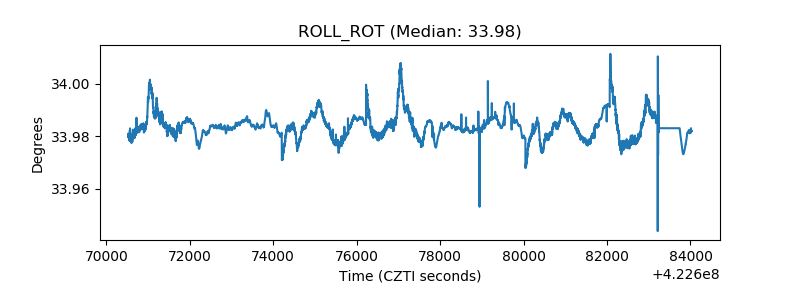 |
| _Roll_DEC | 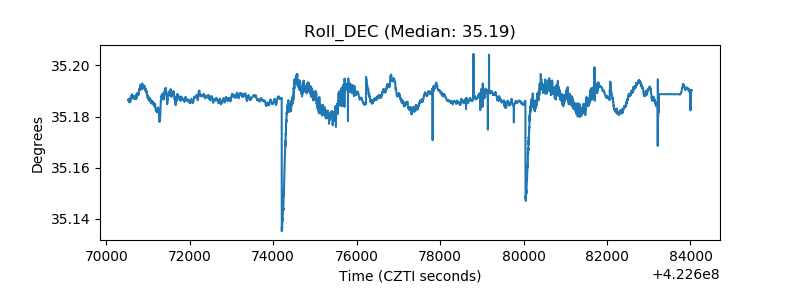 |
| _Roll_RA | 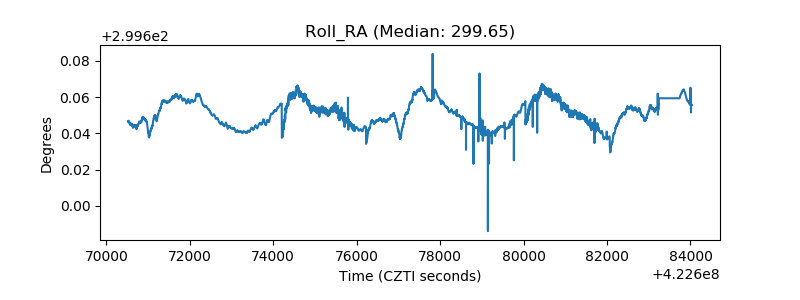 |
| Veto Counter | 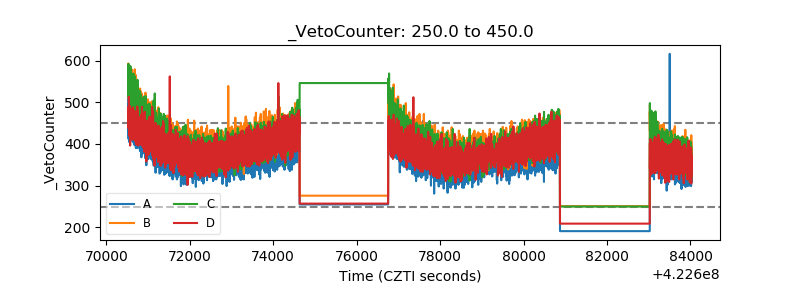 |