| Param | Original file | Final file |
|---|---|---|
| Filename | modeM0/AS1T05_105T01_9000005662_41393cztM0_level2.fits | modeM0/AS1T05_105T01_9000005662_41393cztM0_level2_quad_clean.evt |
| Size (bytes) | 1,843,133,760 | 456,514,560 |
| Size | 1.7 GB | 435.4 MB |
| Events in quadrant A | 14,749,303 | 3,134,781 |
| Events in quadrant B | 13,261,790 | 3,213,980 |
| Events in quadrant C | 15,016,538 | 2,970,622 |
| Events in quadrant D | 23,057,907 | 2,600,173 |
| Mode M9 | |||
|---|---|---|---|
| Quadrant | BADHDUFLAG | Total packets | Discarded packets |
| A | 0 | 107 | 0 |
| B | 0 | 107 | 0 |
| C | 0 | 107 | 0 |
| D | 0 | 107 | 0 |
| Mode SS | |||
|---|---|---|---|
| Quadrant | BADHDUFLAG | Total packets | Discarded packets |
| A | 0 | 564 | 0 |
| B | 0 | 564 | 0 |
| C | 0 | 564 | 0 |
| D | 0 | 564 | 0 |
| Mode M0 | |||
|---|---|---|---|
| Quadrant | BADHDUFLAG | Total packets | Discarded packets |
| A | 0 | 59748 | 7 |
| B | 0 | 58248 | 6 |
| C | 0 | 61853 | 6 |
| D | 0 | 87402 | 6 |
| Quadrant | Total seconds | Saturated seconds | Saturation percentage |
|---|---|---|---|
| A | 27683 | 86 | 0.310660% |
| B | 27683 | 334 | 1.206517% |
| C | 27683 | 840 | 3.034353% |
| D | 27683 | 2639 | 9.532926% |
Noise dominated data is calculated using 1-second bins in cleaned event files. If a bin has >2000 counts, and if more than 50% of those come from <1% of pixels, then it is considered to be noise-dominated and hence unusable.
| Quadrant | # 1 sec bins | Bins with >0 counts | Bins with >2000 counts | High rate bins dominated by noise | Noise dominated (total time) | Noise dominated (detector-on time) | Marked lightcurve |
|---|---|---|---|---|---|---|---|
| A | 38376 | 27690 | 34 | 34 | 0.09% | 0.12% | 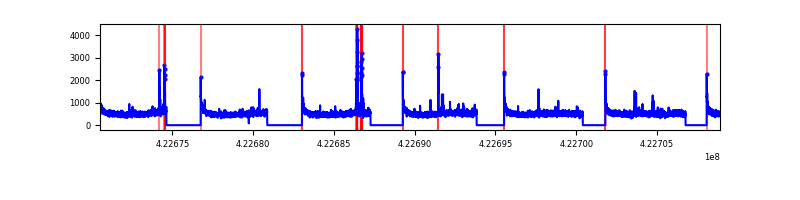 |
| B | 38376 | 27690 | 240 | 240 | 0.63% | 0.87% | 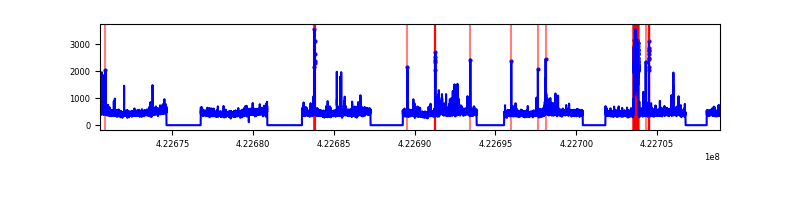 |
| C | 38376 | 27690 | 852 | 852 | 2.22% | 3.08% | 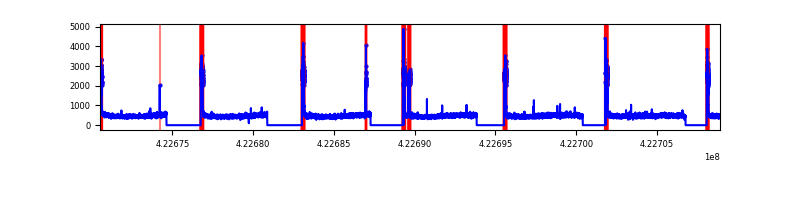 |
| D | 38375 | 27689 | 2149 | 2149 | 5.60% | 7.76% | 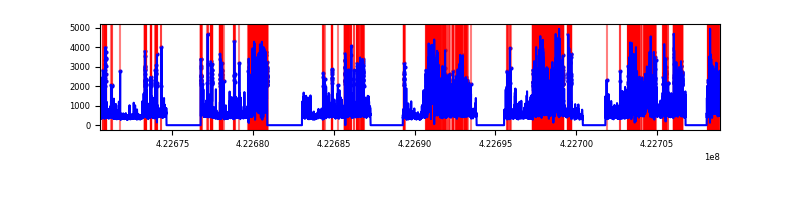 |
Top three noisy pixels from each quadrant. If the there are fewer than three noisy pixels in the level2.evt file, extra rows are filled as -1
| Pixel properties | Quadrant properties | ||||||
|---|---|---|---|---|---|---|---|
| Quadrant | DetID | PixID | Counts | Sigma | Mean | Median | Sigma |
| A | 10 | 83 | 2356153 | 3737.31 | 3100 | 3045 | 629.6 |
| A | 13 | 248 | 217166 | 340.08 | 3100 | 3045 | 629.6 |
| A | 12 | 189 | 115513 | 178.63 | 3100 | 3045 | 629.6 |
| B | 0 | 186 | 620582 | 1051.69 | 3069 | 2996 | 587.2 |
| B | 0 | 190 | 252763 | 425.33 | 3069 | 2996 | 587.2 |
| B | 5 | 255 | 160251 | 267.79 | 3069 | 2996 | 587.2 |
| C | 0 | 10 | 2137006 | 3126.05 | 2953 | 2973 | 682.7 |
| C | 15 | 214 | 1143457 | 1670.64 | 2953 | 2973 | 682.7 |
| C | 2 | 16 | 201101 | 290.23 | 2953 | 2973 | 682.7 |
| D | 2 | 249 | 4627593 | 6565.27 | 2873 | 2792 | 704.4 |
| D | 1 | 52 | 2291925 | 3249.61 | 2873 | 2792 | 704.4 |
| D | 13 | 249 | 1690889 | 2396.39 | 2873 | 2792 | 704.4 |
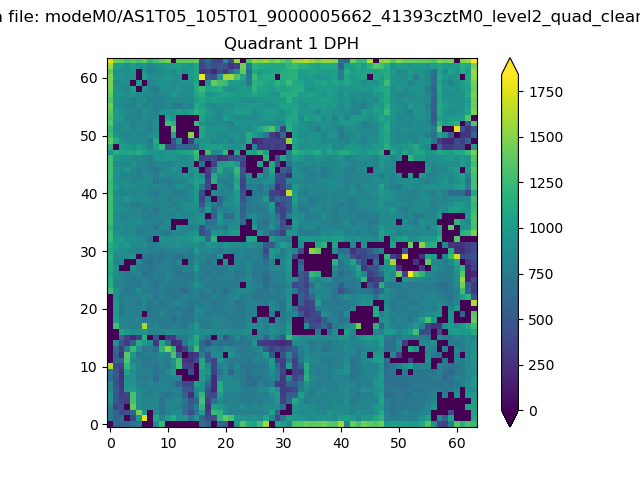
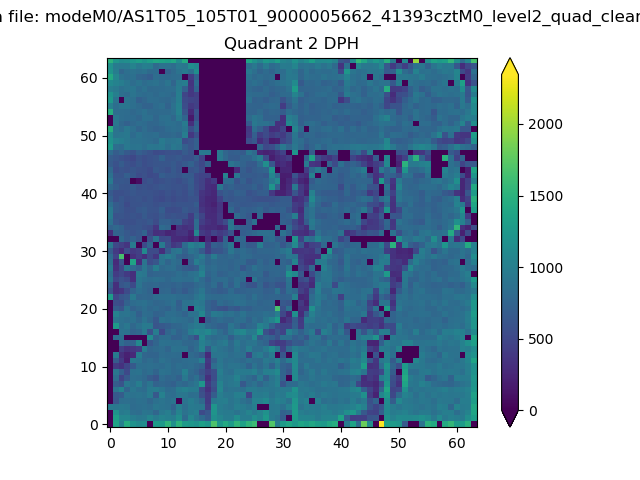
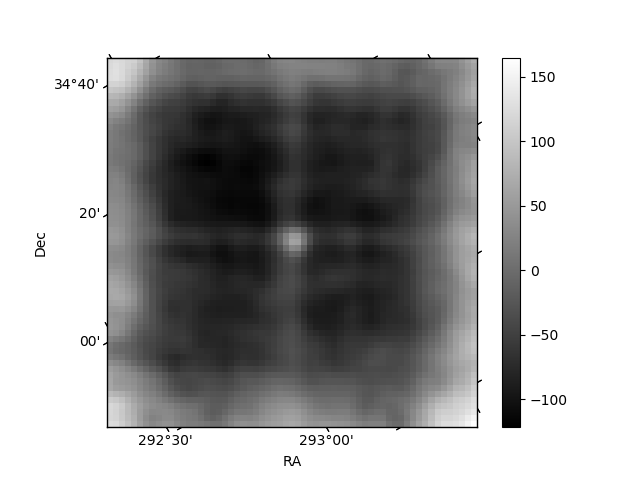
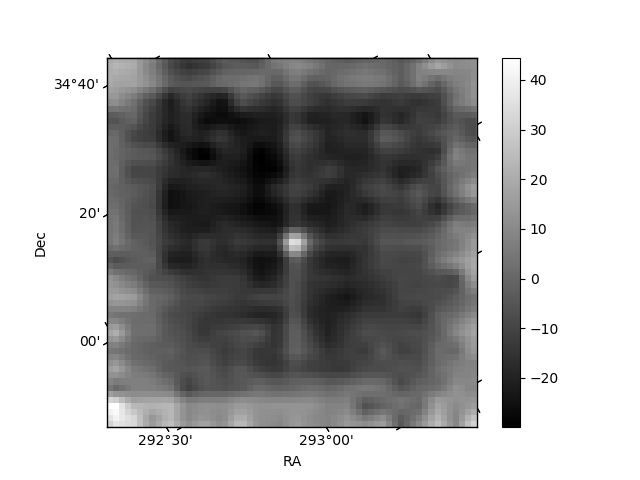
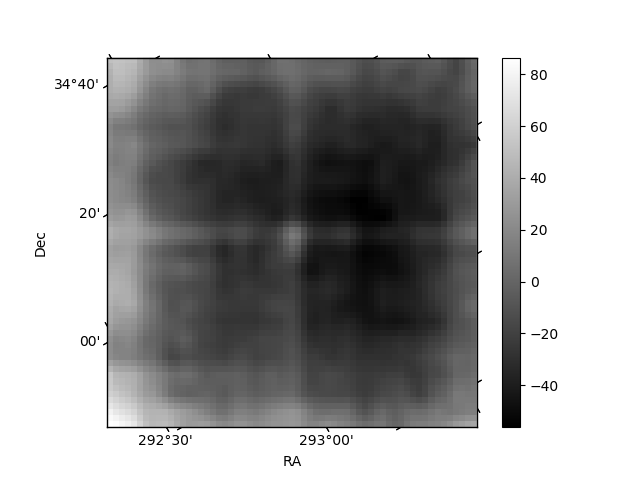
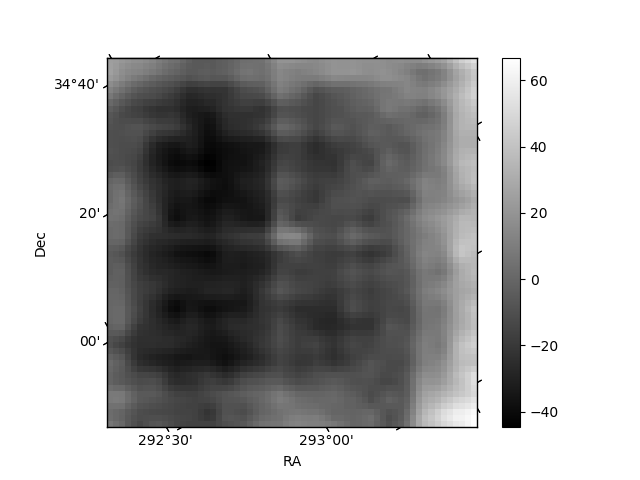
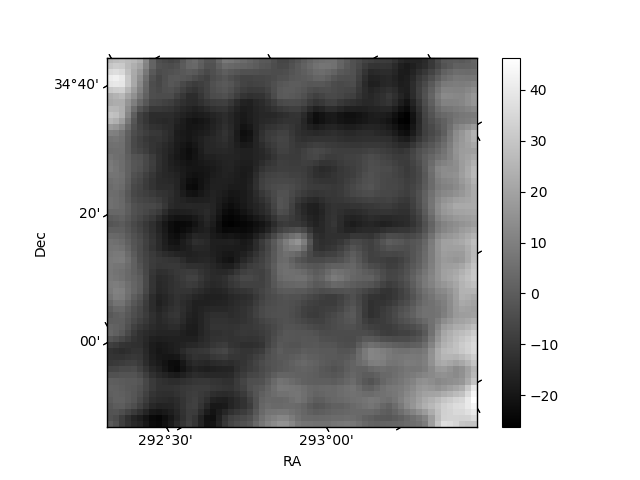
Histogram calculated using DETX and DETY for each event in the final _common_clean file
| Quadrant A |  |
 |
Quadrant B |
|---|---|---|---|
| Quadrant D | 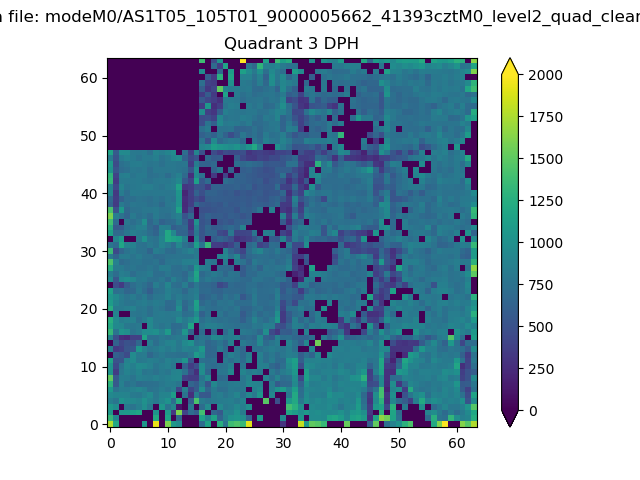 |
 |
Quadrant C |
| Plot type | Count rate plots | Images |
|---|---|---|
| Comparison with Poisson distribution Blue bars denote a histogram of data divided into 1 sec bins. Red curve is a Poisson curve with rate = median count rate of data. |
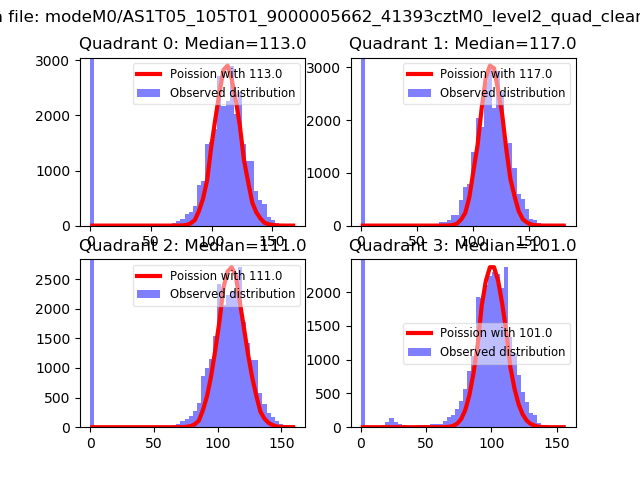 |
 |
| Quadrant-wise count rates Data is divided into 100 sec bins |
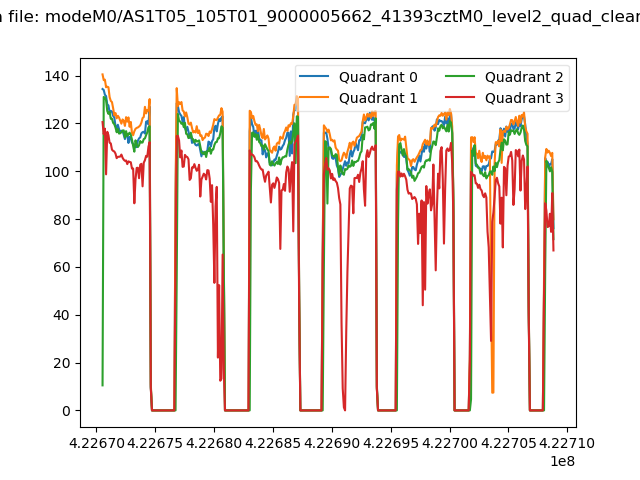 |
|
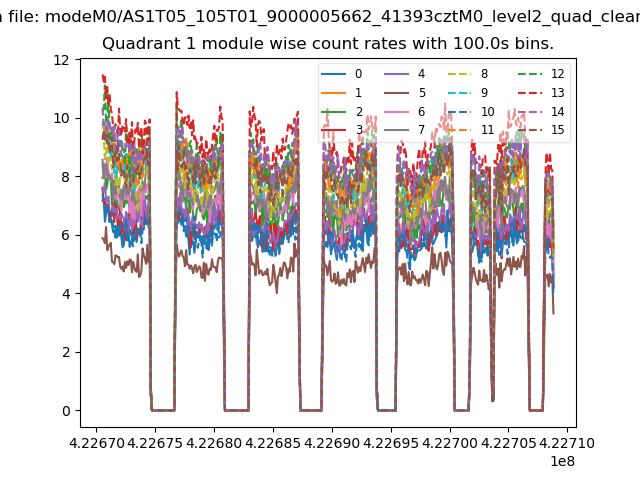
| Module-wise count rates for Quadrant A Data is divided into 100 sec bins |
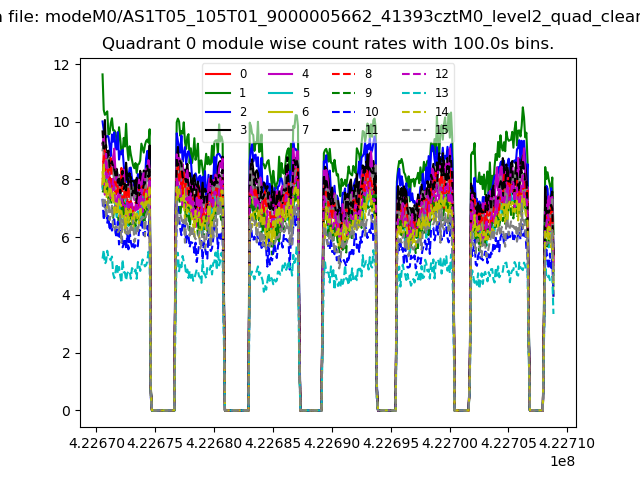 |
 |
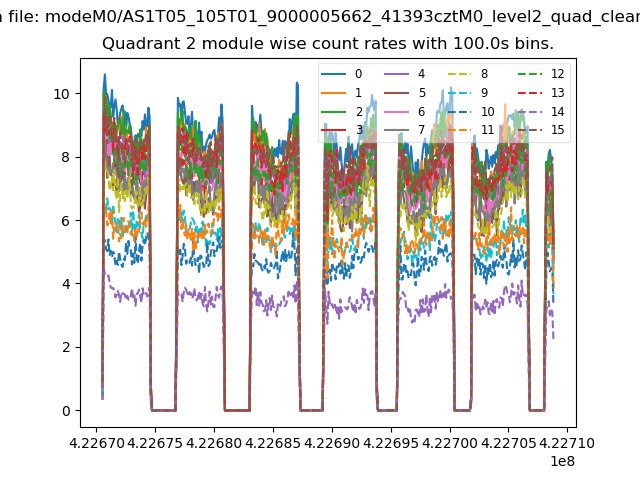
| Module-wise count rates for Quadrant B Data is divided into 100 sec bins |
 |
 |
| Module-wise count rates for Quadrant C Data is divided into 100 sec bins |
 |
 |
| Module-wise count rates for Quadrant D Data is divided into 100 sec bins |
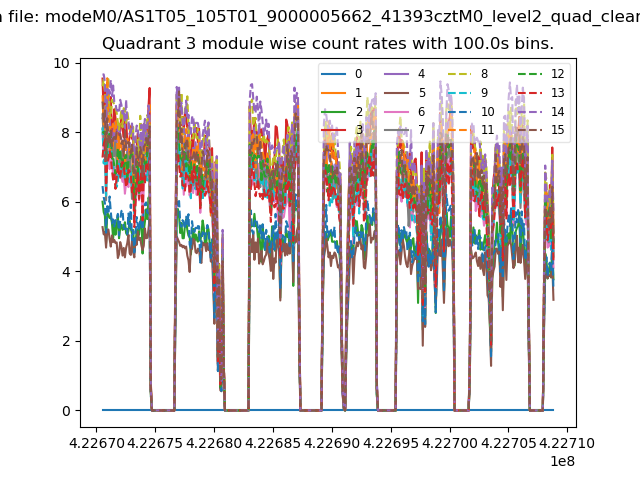 |
 |
| Parameter | Plot |
|---|---|
| CZT HV Monitor | 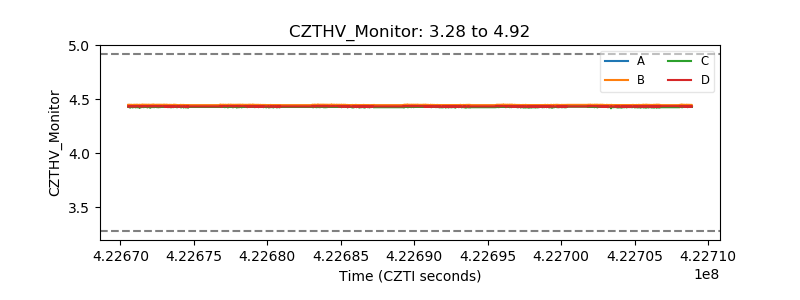 |
| D_VDD | 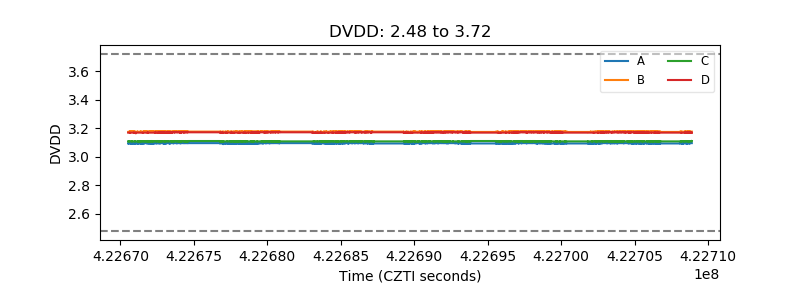 |
| Temperature 1 | 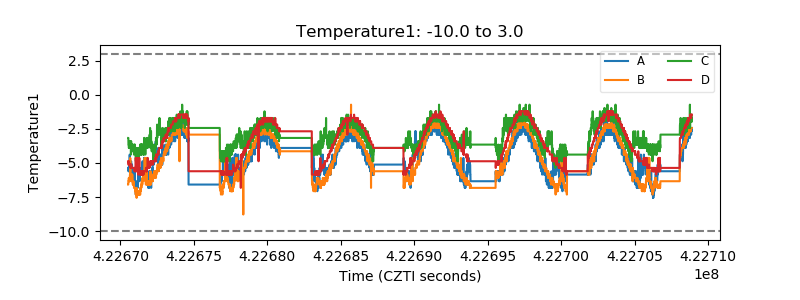 |
| Veto HV Monitor | 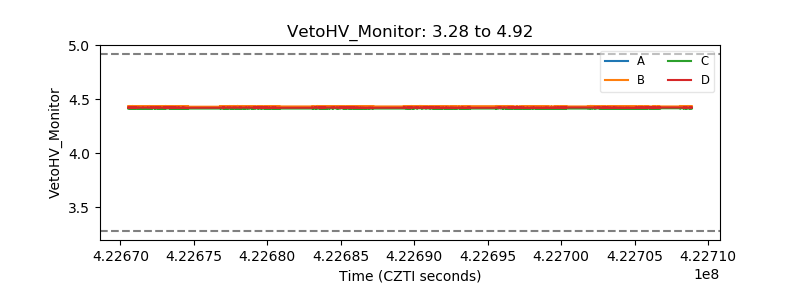 |
| Veto LLD | 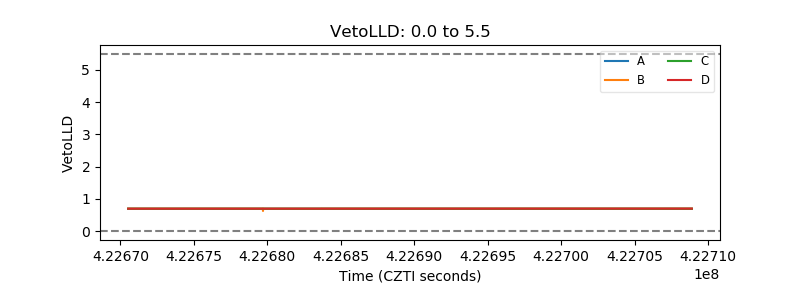 |
| Alpha Counter | 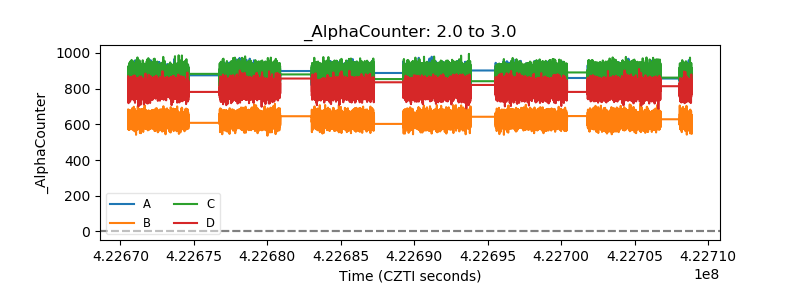 |
| _CPM_Rate | 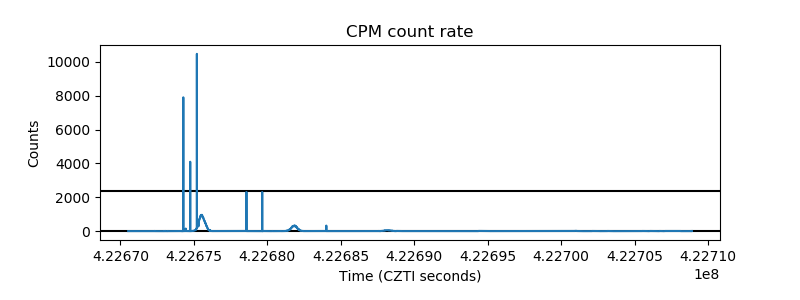 |
| CZT Counter | 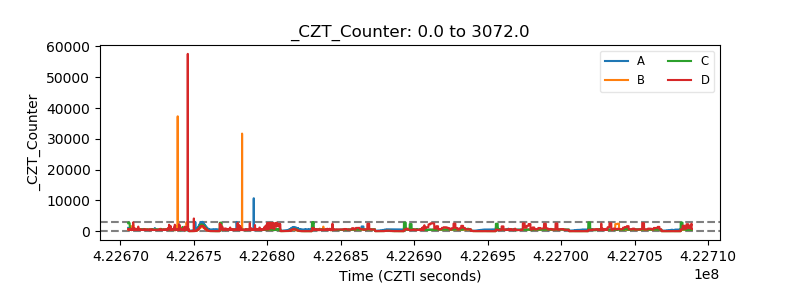 |
| +2.5 Volts monitor |  |
| +5 Volts monitor | 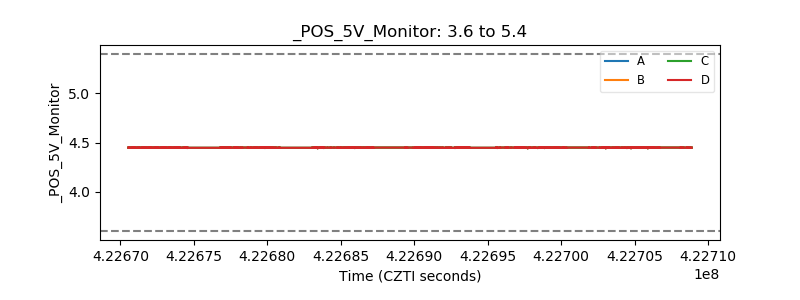 |
| _ROLL_ROT | 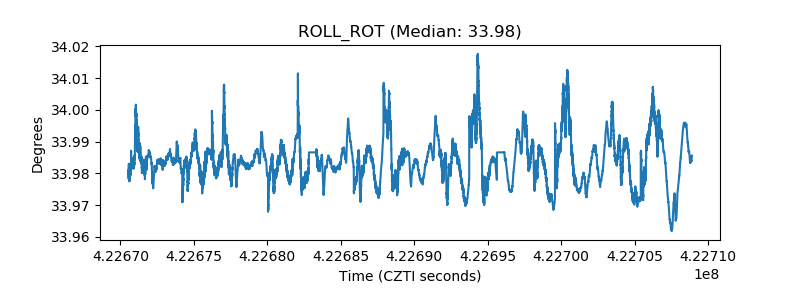 |
| _Roll_DEC | 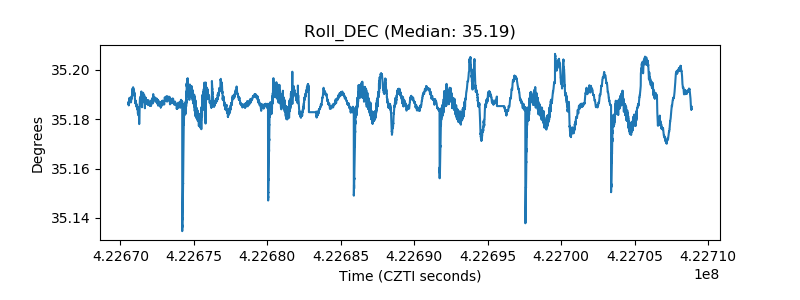 |
| _Roll_RA | 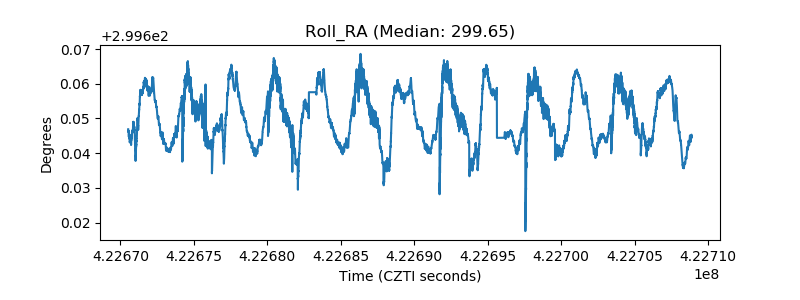 |
| Veto Counter | 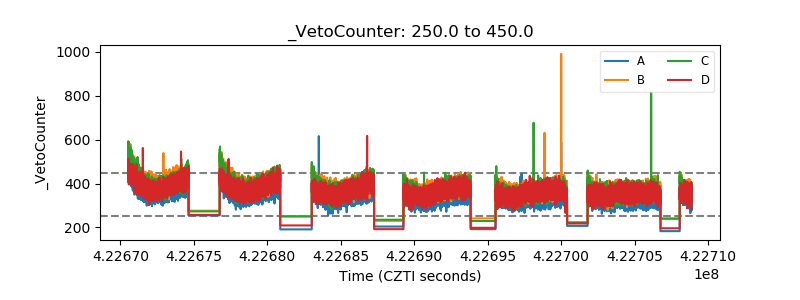 |