| Param | Original file | Final file |
|---|---|---|
| Filename | modeM0/AS1T05_105T01_9000005662_41396cztM0_level2.fits | modeM0/AS1T05_105T01_9000005662_41396cztM0_level2_quad_clean.evt |
| Size (bytes) | 287,631,360 | 56,753,280 |
| Size | 274.3 MB | 54.1 MB |
| Events in quadrant A | 1,982,219 | 397,127 |
| Events in quadrant B | 1,651,017 | 406,764 |
| Events in quadrant C | 1,918,187 | 373,030 |
| Events in quadrant D | 4,812,245 | 284,902 |
| Mode M9 | |||
|---|---|---|---|
| Quadrant | BADHDUFLAG | Total packets | Discarded packets |
| A | 0 | 10 | 0 |
| B | 0 | 10 | 0 |
| C | 0 | 10 | 0 |
| D | 0 | 11 | 0 |
| Mode SS | |||
|---|---|---|---|
| Quadrant | BADHDUFLAG | Total packets | Discarded packets |
| A | 0 | 72 | 0 |
| B | 0 | 72 | 0 |
| C | 0 | 72 | 0 |
| D | 0 | 72 | 0 |
| Mode M0 | |||
|---|---|---|---|
| Quadrant | BADHDUFLAG | Total packets | Discarded packets |
| A | 0 | 7955 | 1 |
| B | 0 | 7358 | 1 |
| C | 0 | 7947 | 1 |
| D | 0 | 16762 | 1 |
| Quadrant | Total seconds | Saturated seconds | Saturation percentage |
|---|---|---|---|
| A | 3626 | 31 | 0.854937% |
| B | 3626 | 7 | 0.193050% |
| C | 3626 | 98 | 2.702703% |
| D | 3626 | 924 | 25.482625% |
Noise dominated data is calculated using 1-second bins in cleaned event files. If a bin has >2000 counts, and if more than 50% of those come from <1% of pixels, then it is considered to be noise-dominated and hence unusable.
| Quadrant | # 1 sec bins | Bins with >0 counts | Bins with >2000 counts | High rate bins dominated by noise | Noise dominated (total time) | Noise dominated (detector-on time) | Marked lightcurve |
|---|---|---|---|---|---|---|---|
| A | 3626 | 3626 | 17 | 17 | 0.47% | 0.47% | 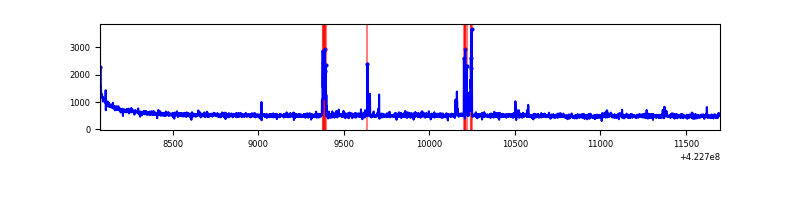 |
| B | 3626 | 3626 | 1 | 1 | 0.03% | 0.03% | 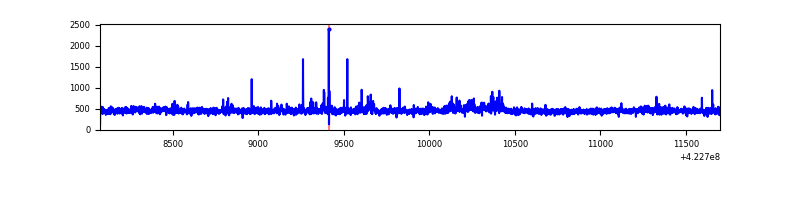 |
| C | 3626 | 3626 | 95 | 95 | 2.62% | 2.62% | 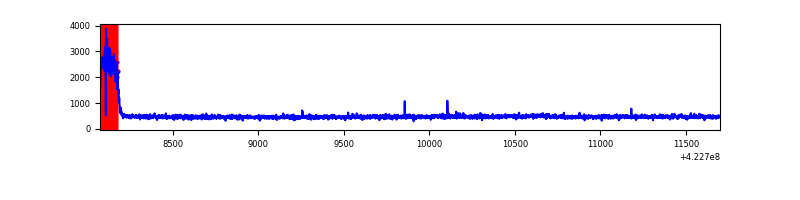 |
| D | 3626 | 3626 | 782 | 782 | 21.57% | 21.57% | 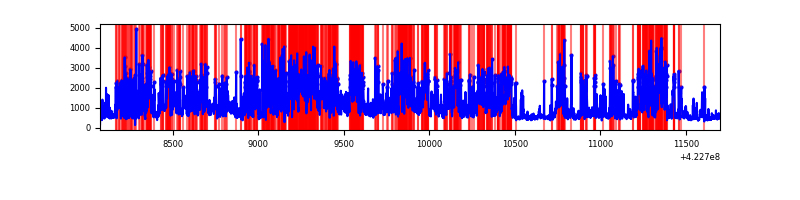 |
Top three noisy pixels from each quadrant. If the there are fewer than three noisy pixels in the level2.evt file, extra rows are filled as -1
| Pixel properties | Quadrant properties | ||||||
|---|---|---|---|---|---|---|---|
| Quadrant | DetID | PixID | Counts | Sigma | Mean | Median | Sigma |
| A | 10 | 83 | 323241 | 3784.15 | 401 | 392 | 85.3 |
| A | 2 | 79 | 50749 | 590.24 | 401 | 392 | 85.3 |
| A | 13 | 248 | 44481 | 516.77 | 401 | 392 | 85.3 |
| B | 0 | 190 | 44454 | 556.86 | 398 | 386 | 79.1 |
| B | 5 | 255 | 12950 | 158.76 | 398 | 386 | 79.1 |
| B | 12 | 111 | 9841 | 119.48 | 398 | 386 | 79.1 |
| C | 0 | 10 | 255848 | 2783.68 | 385 | 387 | 91.8 |
| C | 15 | 214 | 151008 | 1641.27 | 385 | 387 | 91.8 |
| C | 8 | 222 | 5932 | 60.42 | 385 | 387 | 91.8 |
| D | 1 | 52 | 1967072 | 21863.94 | 357 | 345 | 90.0 |
| D | 2 | 249 | 568329 | 6314.23 | 357 | 345 | 90.0 |
| D | 5 | 222 | 375882 | 4174.81 | 357 | 345 | 90.0 |
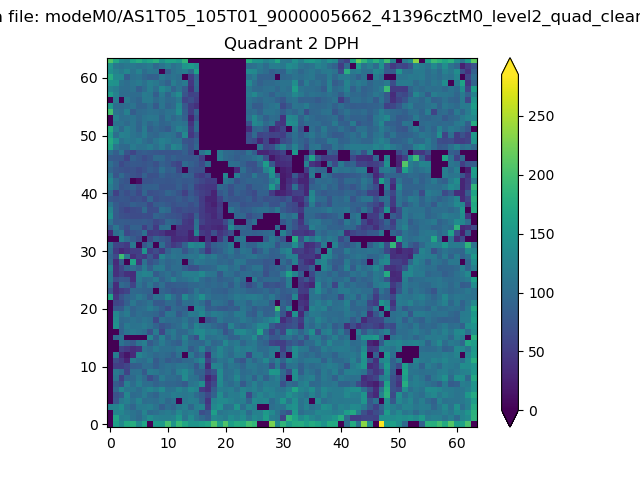
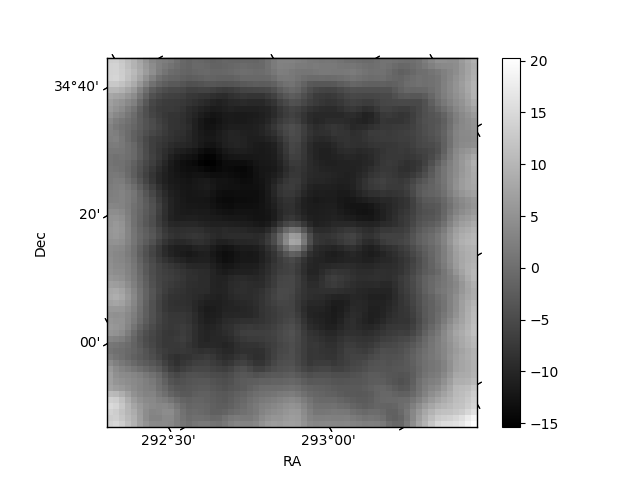
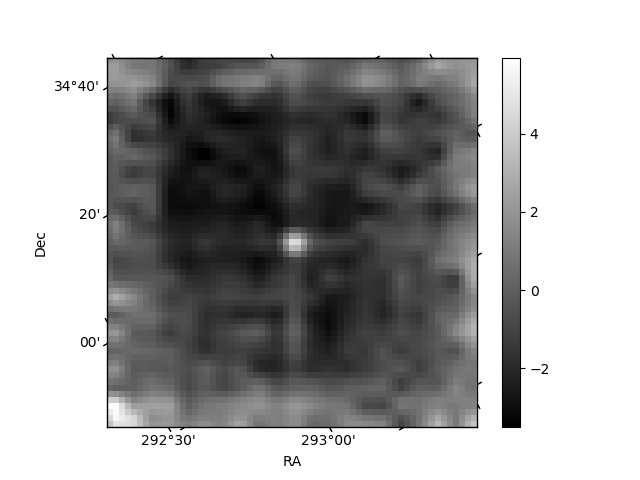
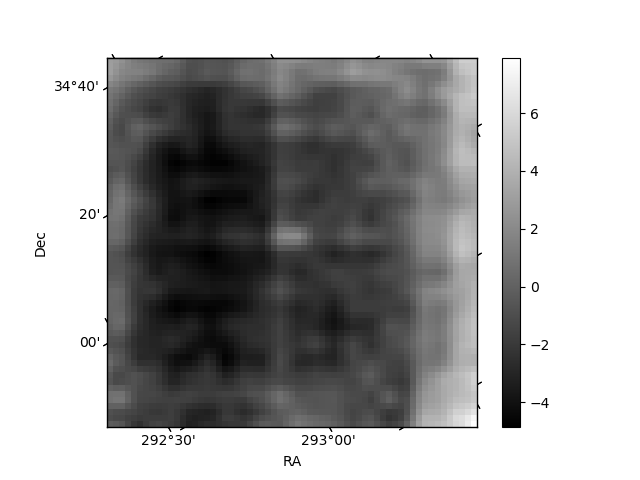
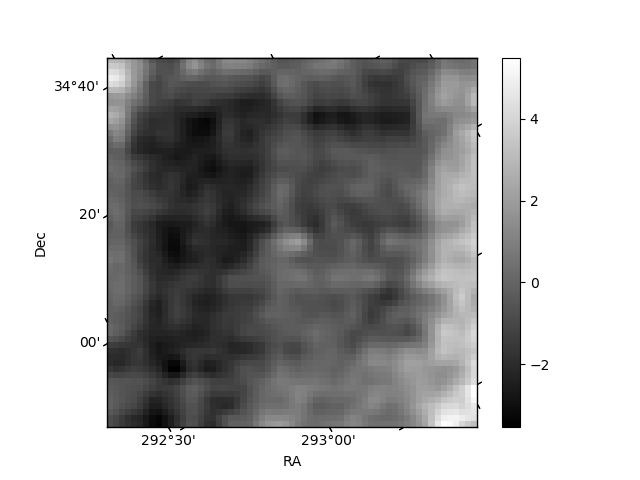
Histogram calculated using DETX and DETY for each event in the final _common_clean file
| Quadrant A | 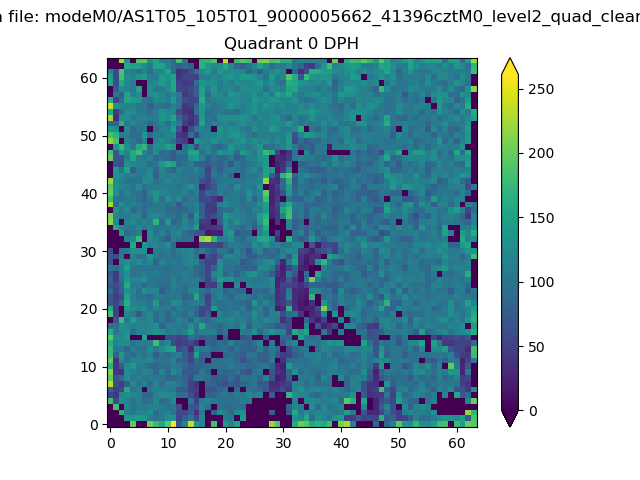 |
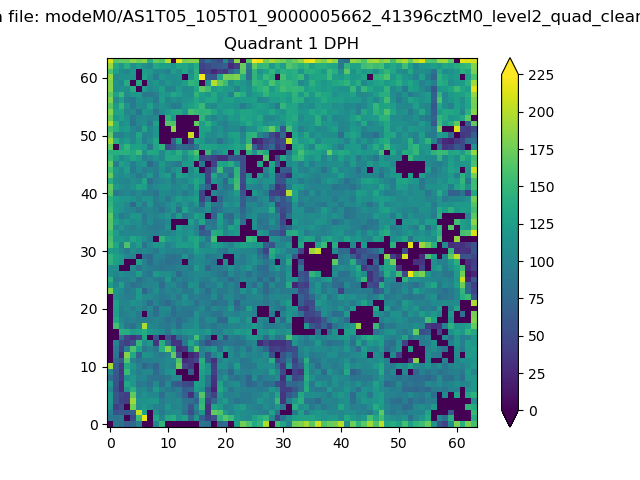 |
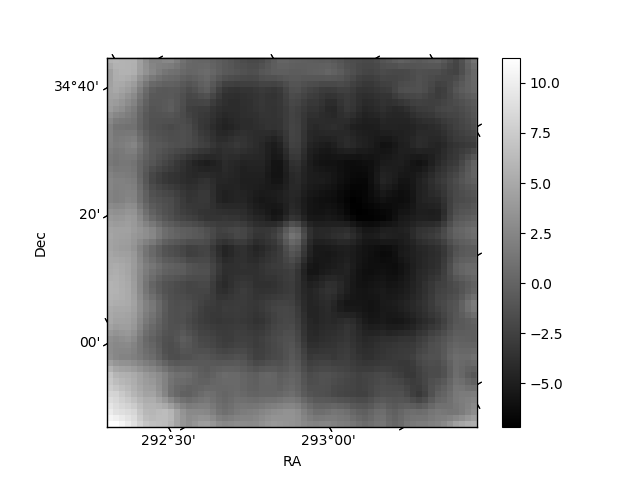
Quadrant B |
|---|---|---|---|
| Quadrant D | 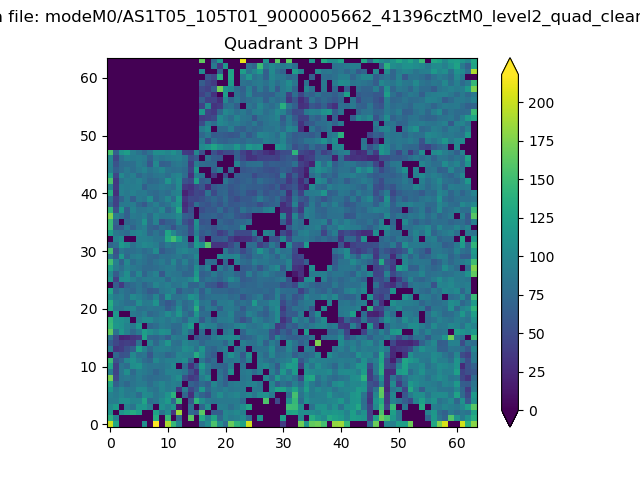 |
 |
Quadrant C |
| Plot type | Count rate plots | Images |
|---|---|---|
| Comparison with Poisson distribution Blue bars denote a histogram of data divided into 1 sec bins. Red curve is a Poisson curve with rate = median count rate of data. |
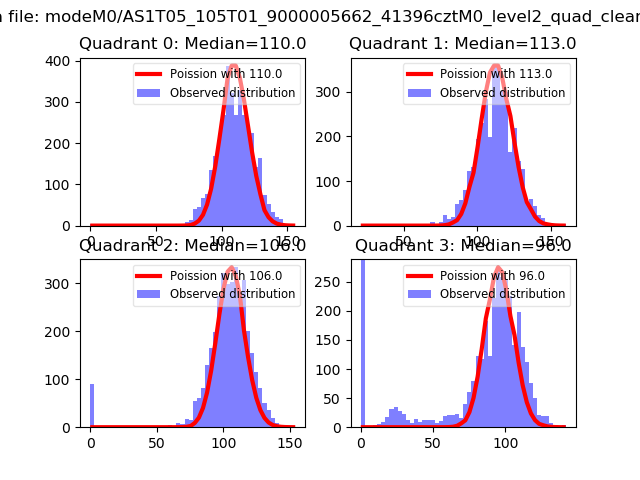 |
 |
| Quadrant-wise count rates Data is divided into 100 sec bins |
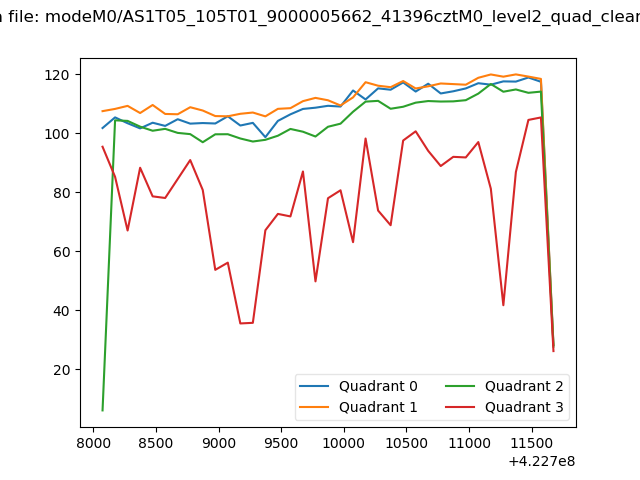 |
|
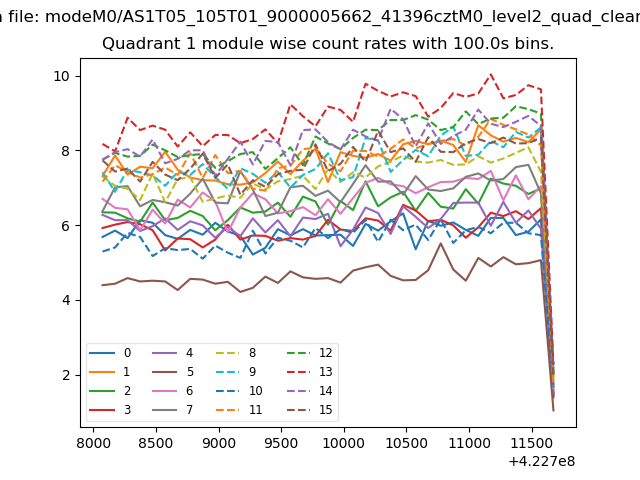
| Module-wise count rates for Quadrant A Data is divided into 100 sec bins |
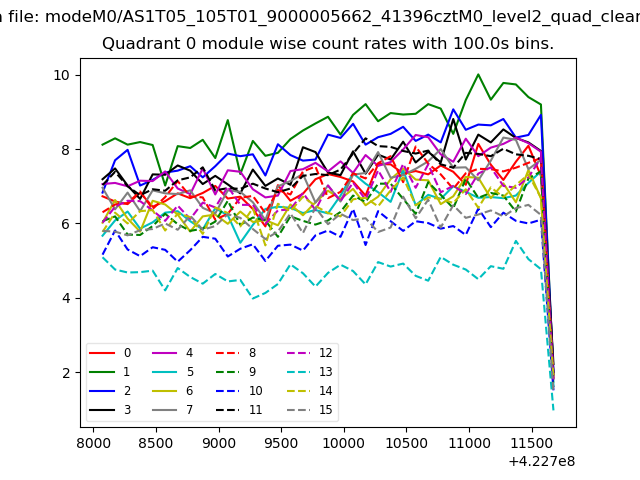 |
 |
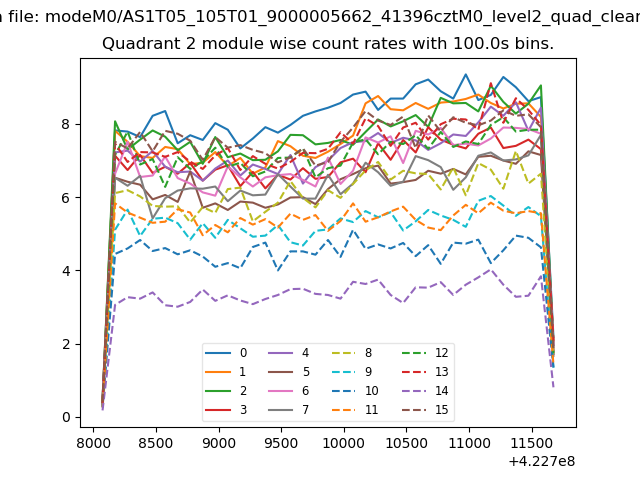
| Module-wise count rates for Quadrant B Data is divided into 100 sec bins |
 |
 |
| Module-wise count rates for Quadrant C Data is divided into 100 sec bins |
 |
 |
| Module-wise count rates for Quadrant D Data is divided into 100 sec bins |
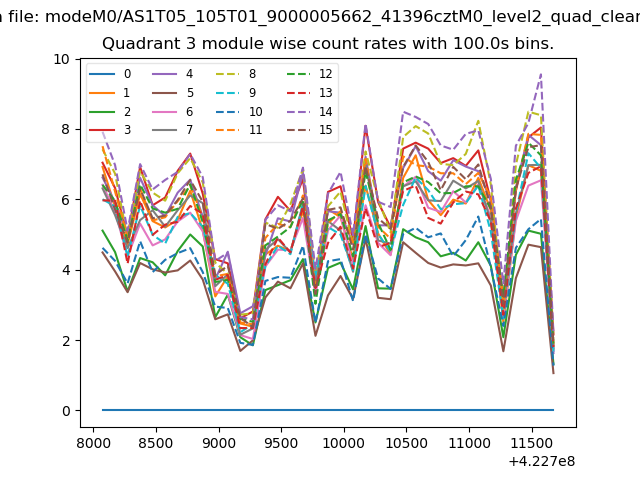 |
 |
| Parameter | Plot |
|---|---|
| CZT HV Monitor | 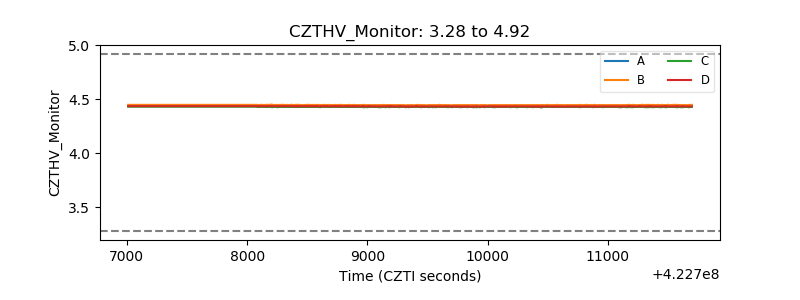 |
| D_VDD | 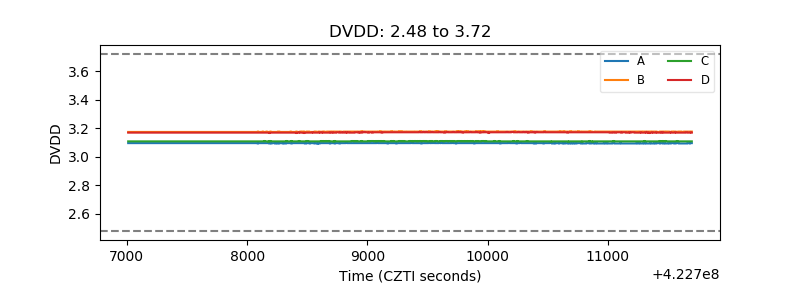 |
| Temperature 1 | 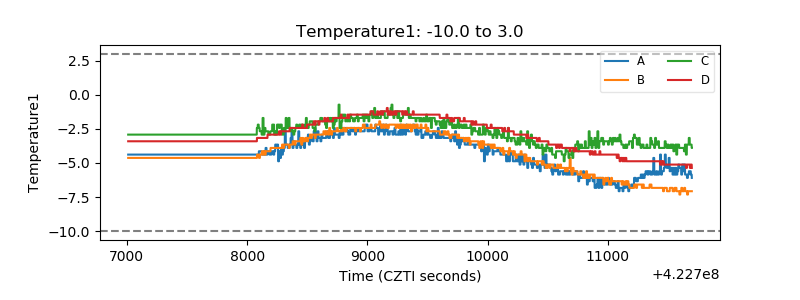 |
| Veto HV Monitor | 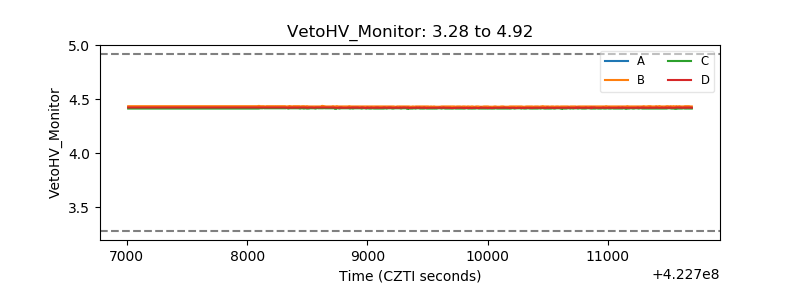 |
| Veto LLD | 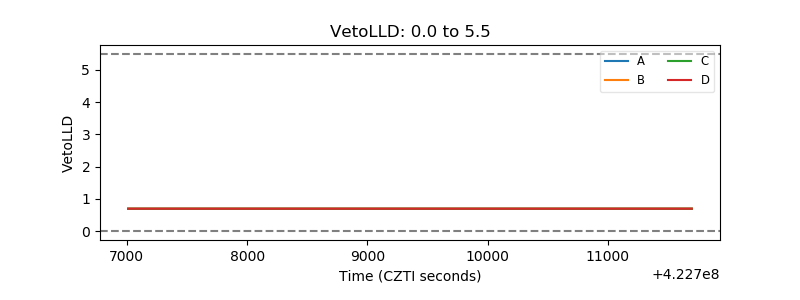 |
| Alpha Counter | 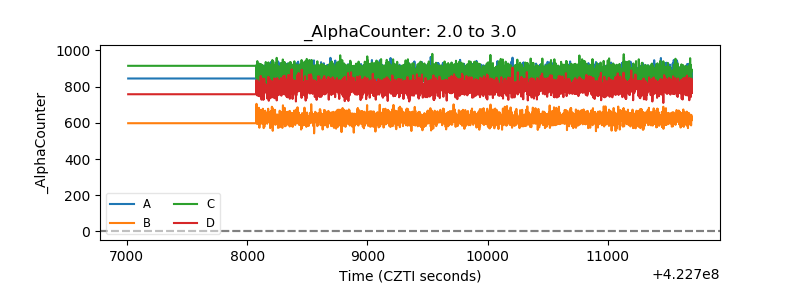 |
| _CPM_Rate | 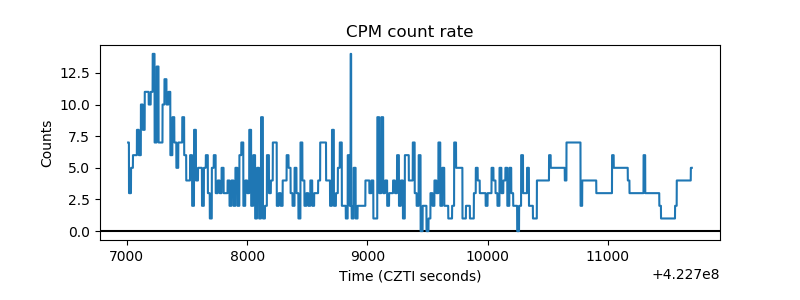 |
| CZT Counter | 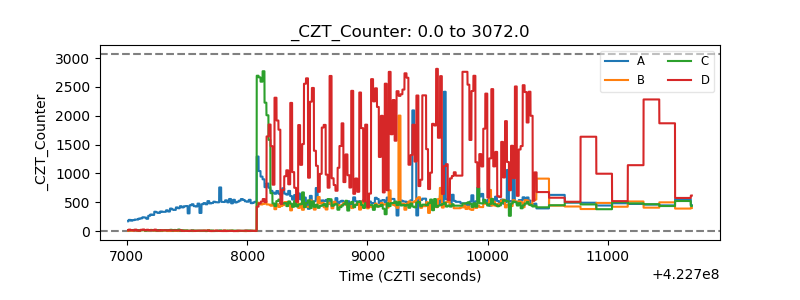 |
| +2.5 Volts monitor | 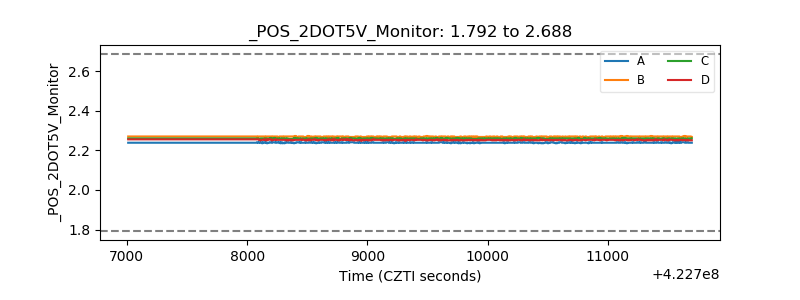 |
| +5 Volts monitor |  |
| _ROLL_ROT | 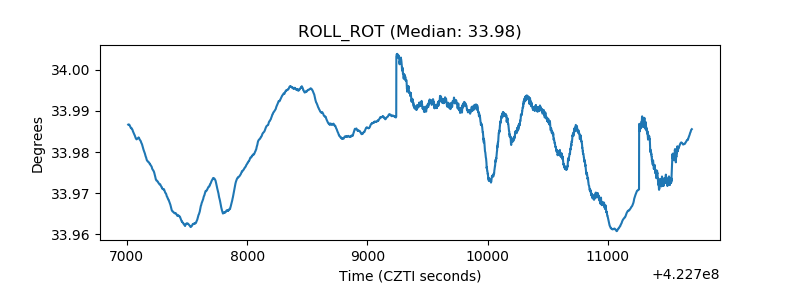 |
| _Roll_DEC | 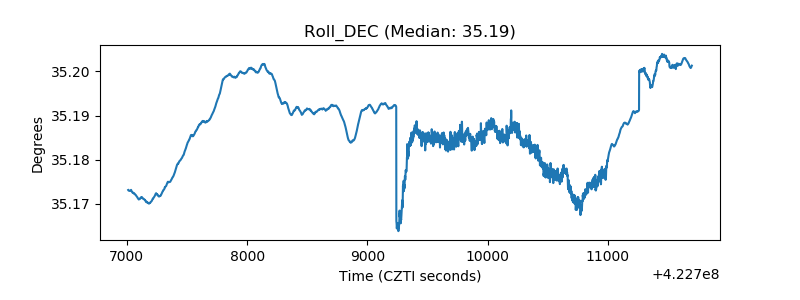 |
| _Roll_RA | 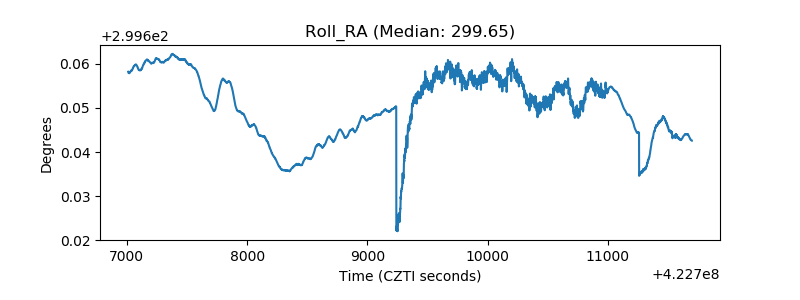 |
| Veto Counter | 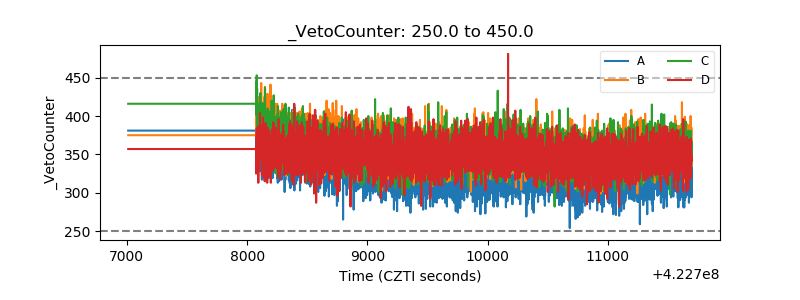 |