| Param | Original file | Final file |
|---|---|---|
| Filename | modeM0/AS1A12_035T01_9000005666_41400cztM0_level2.fits | modeM0/AS1A12_035T01_9000005666_41400cztM0_level2_quad_clean.evt |
| Size (bytes) | 183,591,360 | 48,335,040 |
| Size | 175.1 MB | 46.1 MB |
| Events in quadrant A | 1,569,659 | 330,316 |
| Events in quadrant B | 1,604,393 | 330,320 |
| Events in quadrant C | 1,655,719 | 306,502 |
| Events in quadrant D | 1,747,368 | 297,453 |
| Mode M0 | |||
|---|---|---|---|
| Quadrant | BADHDUFLAG | Total packets | Discarded packets |
| A | 0 | 6334 | 2 |
| B | 0 | 6555 | 1 |
| C | 0 | 6507 | 1 |
| D | 0 | 6975 | 1 |
| Mode SS | |||
|---|---|---|---|
| Quadrant | BADHDUFLAG | Total packets | Discarded packets |
| A | 0 | 58 | 0 |
| B | 0 | 58 | 0 |
| C | 0 | 58 | 0 |
| D | 0 | 58 | 0 |
| Mode M9 | |||
|---|---|---|---|
| Quadrant | BADHDUFLAG | Total packets | Discarded packets |
| A | 0 | 19 | 0 |
| B | 0 | 19 | 0 |
| C | 0 | 19 | 0 |
| D | 0 | 19 | 0 |
| Quadrant | Total seconds | Saturated seconds | Saturation percentage |
|---|---|---|---|
| A | 2787 | 11 | 0.394690% |
| B | 2787 | 102 | 3.659849% |
| C | 2787 | 128 | 4.592752% |
| D | 2787 | 24 | 0.861141% |
Noise dominated data is calculated using 1-second bins in cleaned event files. If a bin has >2000 counts, and if more than 50% of those come from <1% of pixels, then it is considered to be noise-dominated and hence unusable.
| Quadrant | # 1 sec bins | Bins with >0 counts | Bins with >2000 counts | High rate bins dominated by noise | Noise dominated (total time) | Noise dominated (detector-on time) | Marked lightcurve |
|---|---|---|---|---|---|---|---|
| A | 4669 | 2788 | 4 | 4 | 0.09% | 0.14% | 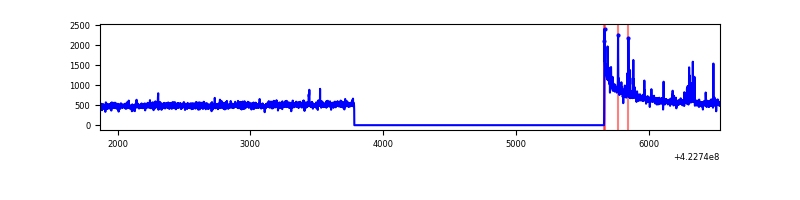 |
| B | 4669 | 2788 | 74 | 74 | 1.58% | 2.65% | 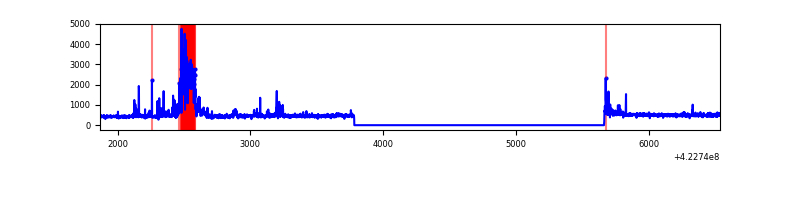 |
| C | 4669 | 2788 | 125 | 125 | 2.68% | 4.48% | 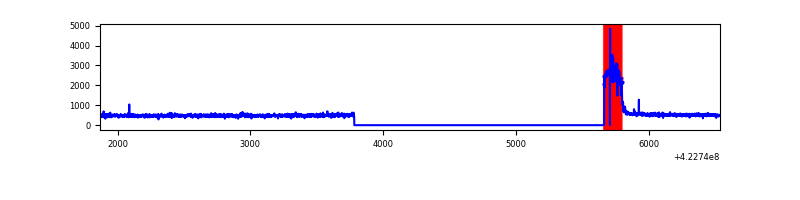 |
| D | 4669 | 2788 | 20 | 20 | 0.43% | 0.72% | 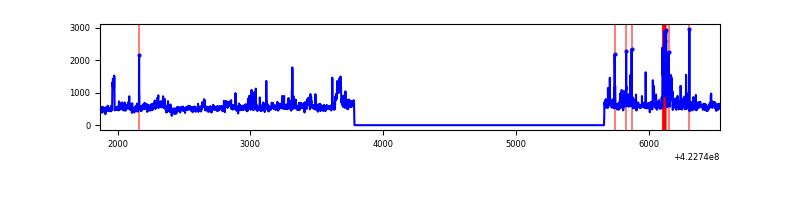 |
Top three noisy pixels from each quadrant. If the there are fewer than three noisy pixels in the level2.evt file, extra rows are filled as -1
| Pixel properties | Quadrant properties | ||||||
|---|---|---|---|---|---|---|---|
| Quadrant | DetID | PixID | Counts | Sigma | Mean | Median | Sigma |
| A | 10 | 83 | 253915 | 3751.01 | 322 | 316 | 67.6 |
| A | 13 | 248 | 49833 | 732.41 | 322 | 316 | 67.6 |
| A | 13 | 6 | 6935 | 97.9 | 322 | 316 | 67.6 |
| B | 5 | 255 | 331371 | 5357.08 | 315 | 307 | 61.8 |
| B | 0 | 190 | 16847 | 267.64 | 315 | 307 | 61.8 |
| B | 0 | 189 | 9435 | 147.7 | 315 | 307 | 61.8 |
| C | 0 | 10 | 336886 | 4621.28 | 307 | 309 | 72.8 |
| C | 15 | 214 | 115813 | 1585.9 | 307 | 309 | 72.8 |
| C | 12 | 249 | 2086 | 24.4 | 307 | 309 | 72.8 |
| D | 13 | 174 | 177822 | 2263.93 | 318 | 309 | 78.4 |
| D | 12 | 79 | 172375 | 2194.46 | 318 | 309 | 78.4 |
| D | 13 | 249 | 75239 | 955.63 | 318 | 309 | 78.4 |
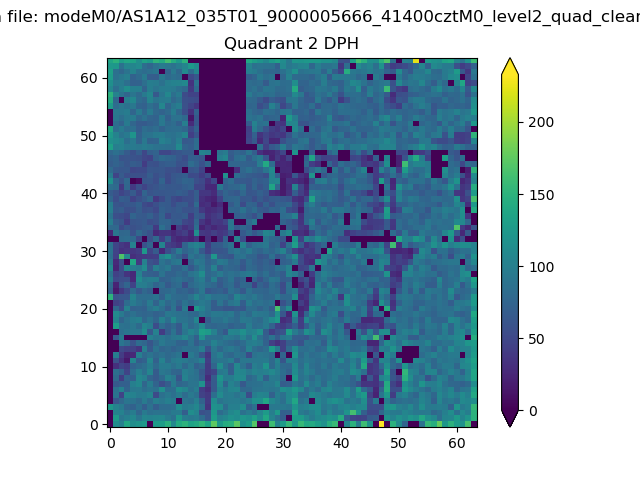
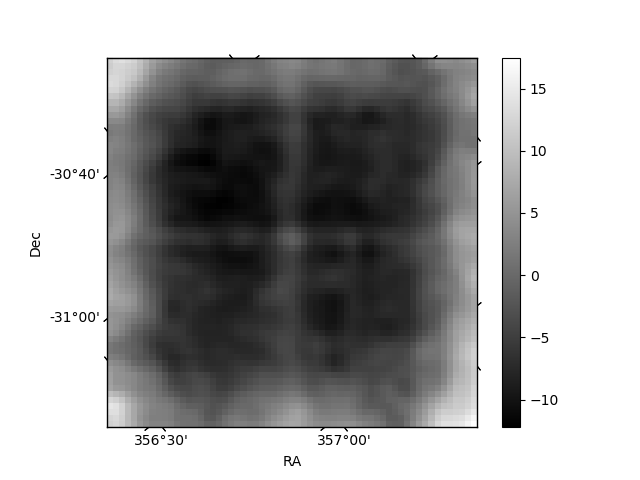
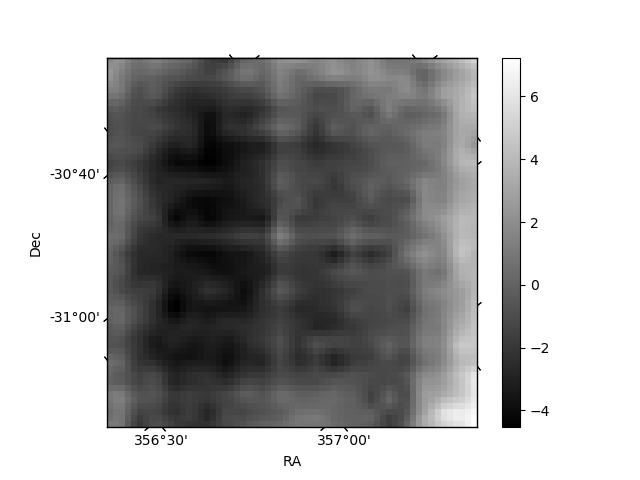
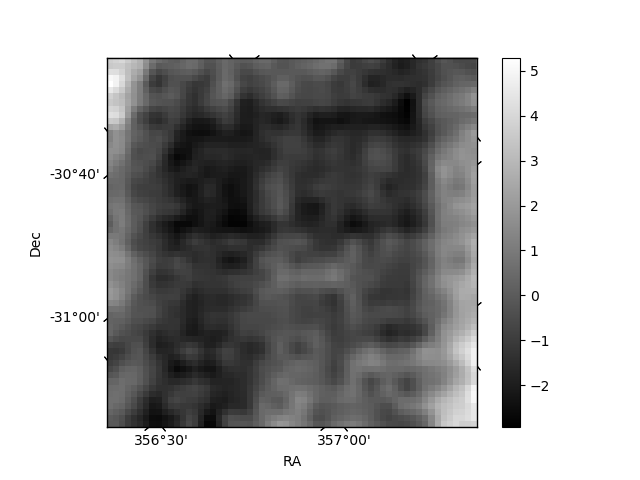
Histogram calculated using DETX and DETY for each event in the final _common_clean file
| Quadrant A | 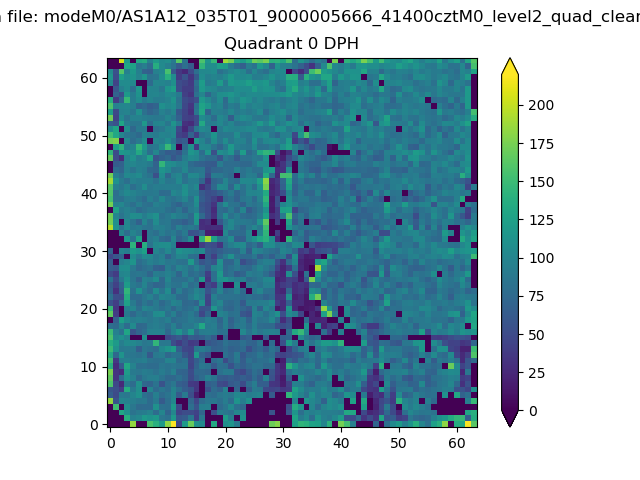 |
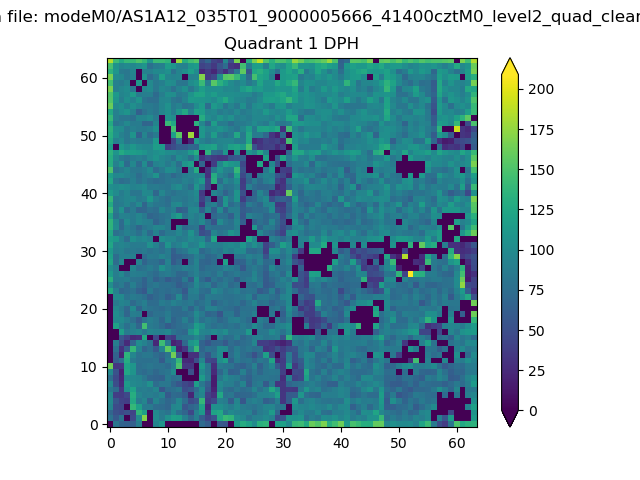 |
Quadrant B |
|---|---|---|---|
| Quadrant D | 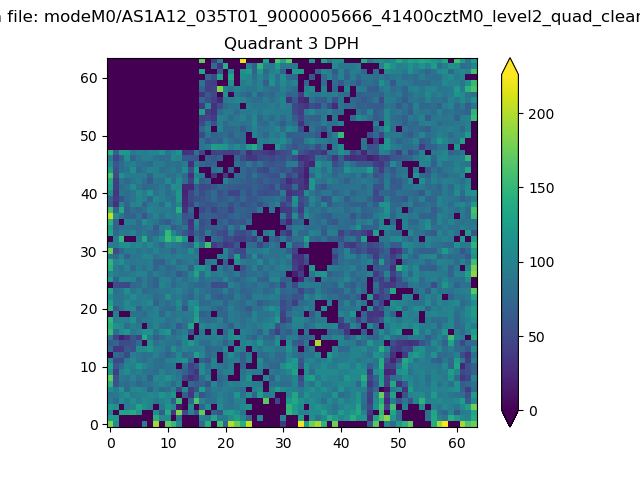 |
 |
Quadrant C |
| Plot type | Count rate plots | Images |
|---|---|---|
| Comparison with Poisson distribution Blue bars denote a histogram of data divided into 1 sec bins. Red curve is a Poisson curve with rate = median count rate of data. |
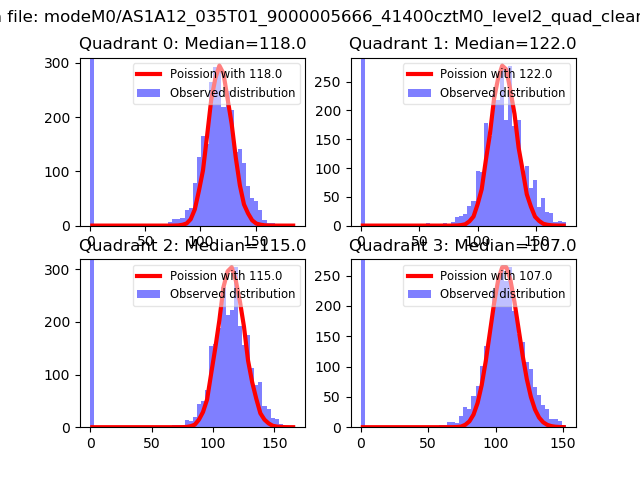 |
 |
| Quadrant-wise count rates Data is divided into 100 sec bins |
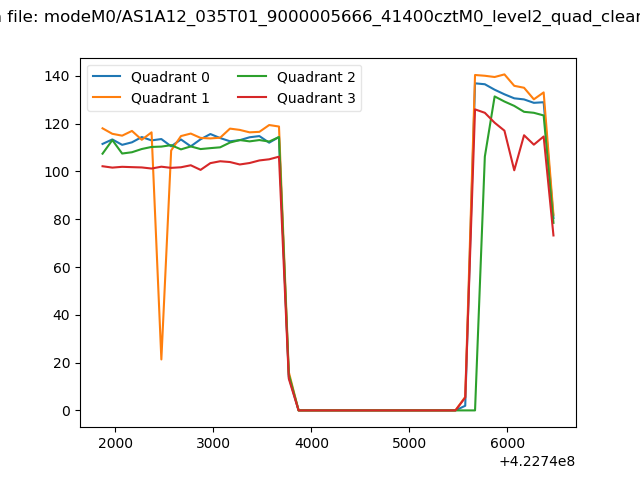 |
|
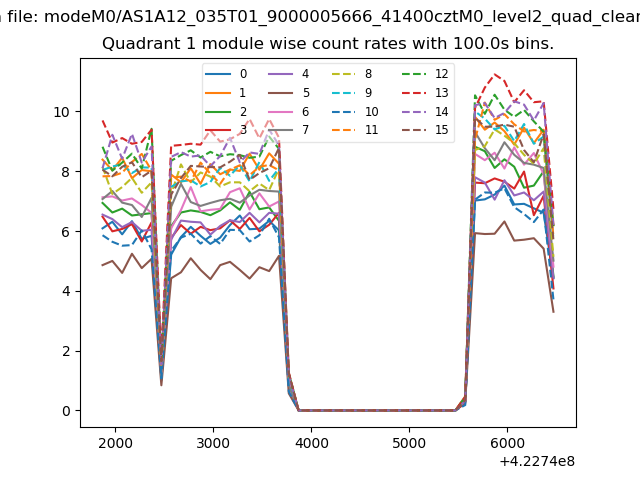
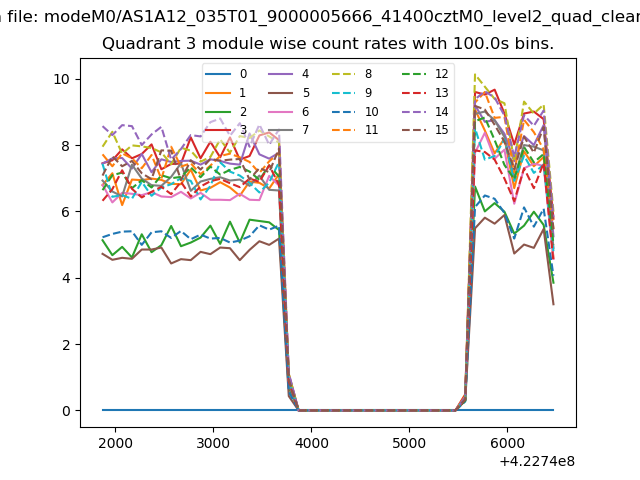
| Module-wise count rates for Quadrant A Data is divided into 100 sec bins |
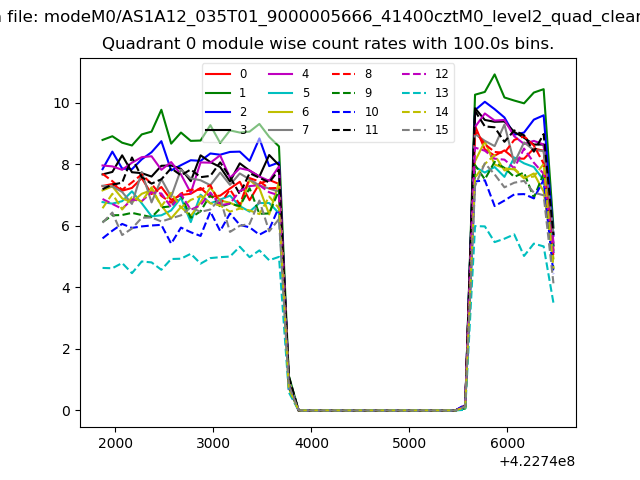 |
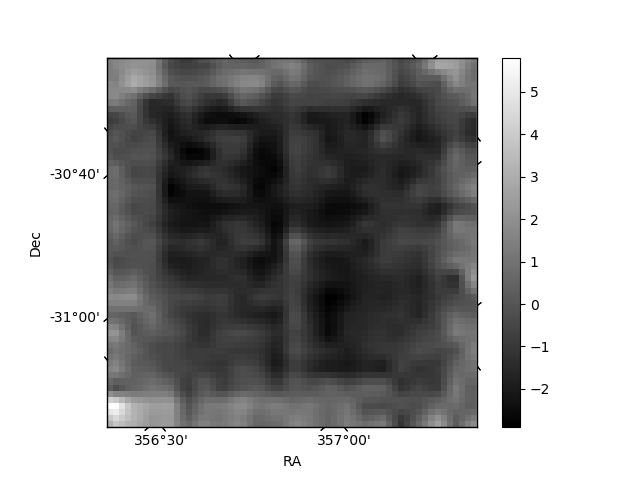 |
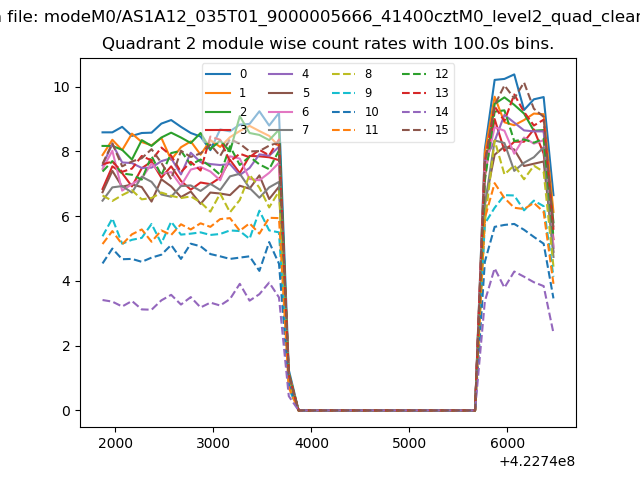
| Module-wise count rates for Quadrant B Data is divided into 100 sec bins |
 |
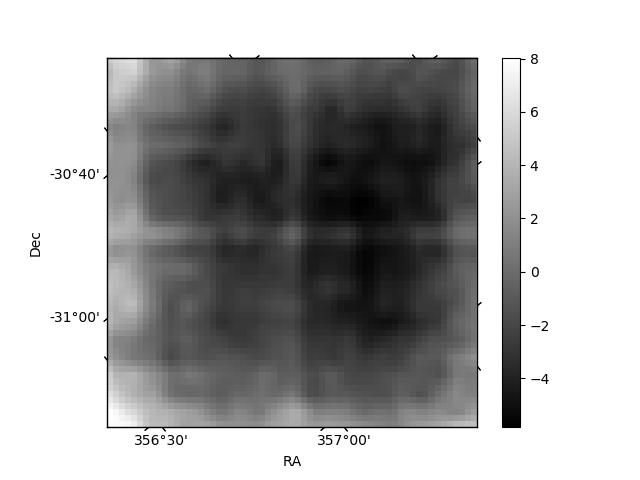 |
| Module-wise count rates for Quadrant C Data is divided into 100 sec bins |
 |
 |
| Module-wise count rates for Quadrant D Data is divided into 100 sec bins |
 |
 |
| Parameter | Plot |
|---|---|
| CZT HV Monitor | 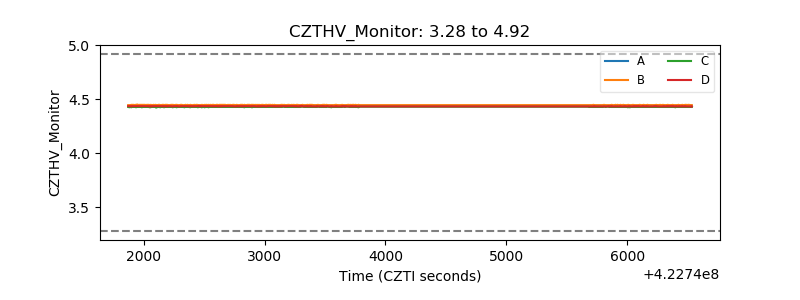 |
| D_VDD | 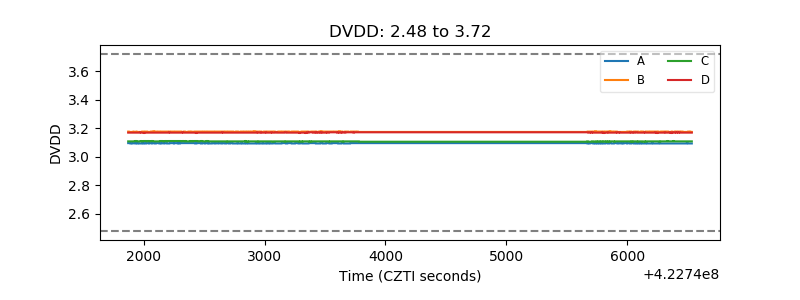 |
| Temperature 1 | 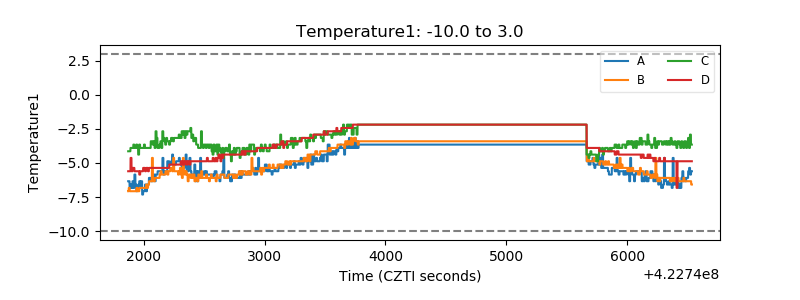 |
| Veto HV Monitor |  |
| Veto LLD | 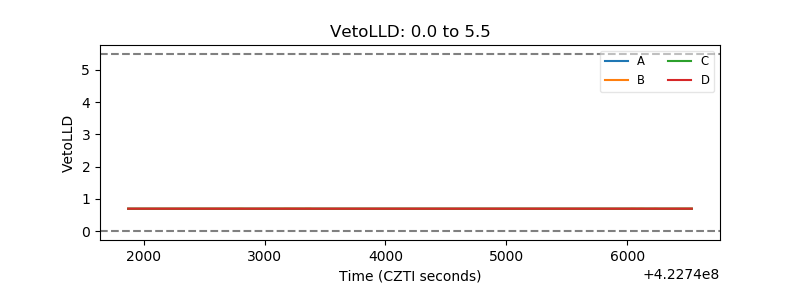 |
| Alpha Counter | 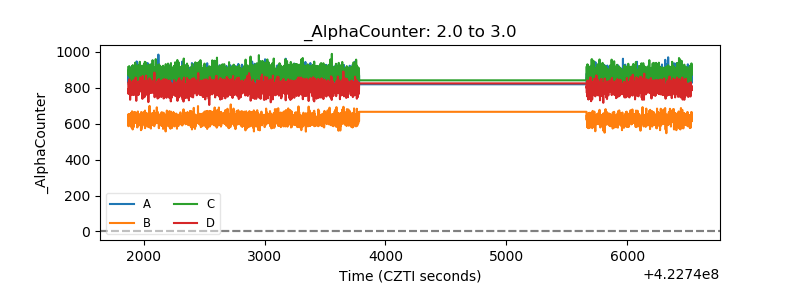 |
| _CPM_Rate | 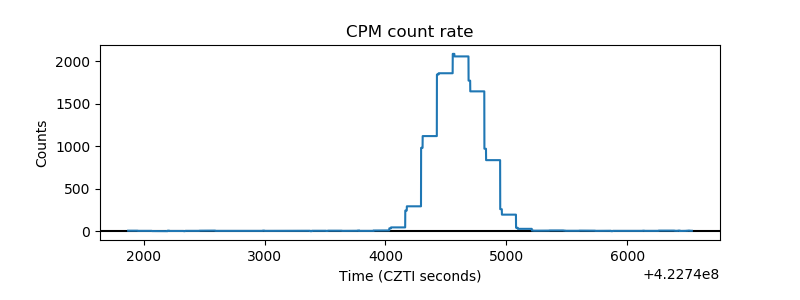 |
| CZT Counter | 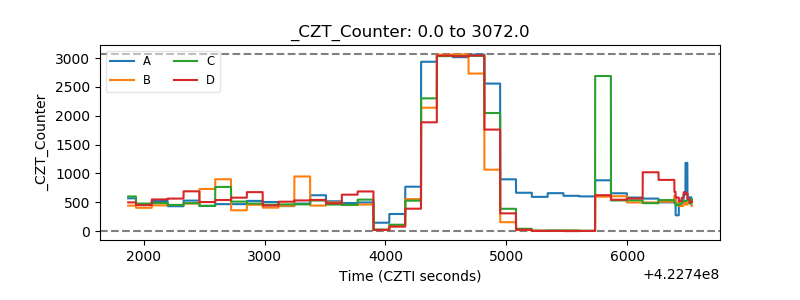 |
| +2.5 Volts monitor | 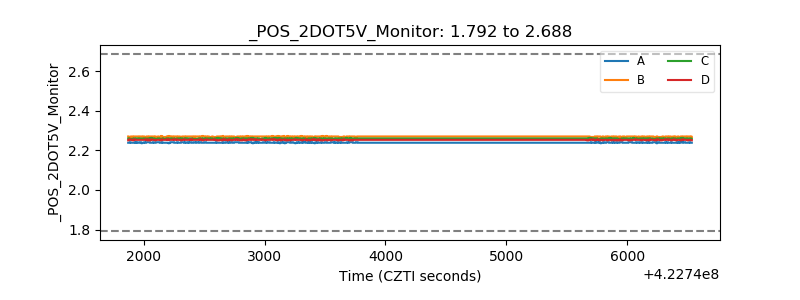 |
| +5 Volts monitor | 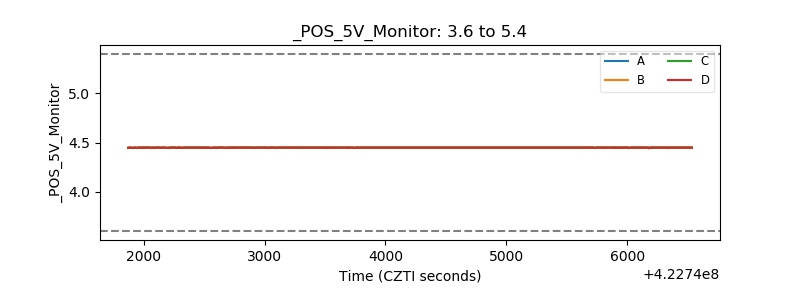 |
| _ROLL_ROT | 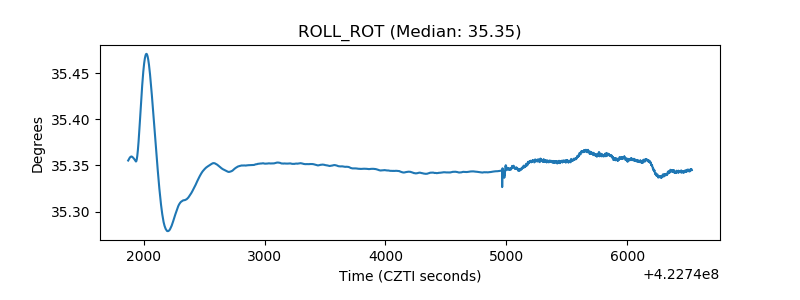 |
| _Roll_DEC | 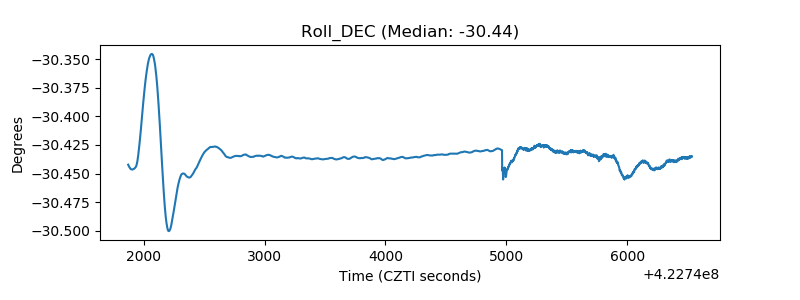 |
| _Roll_RA | 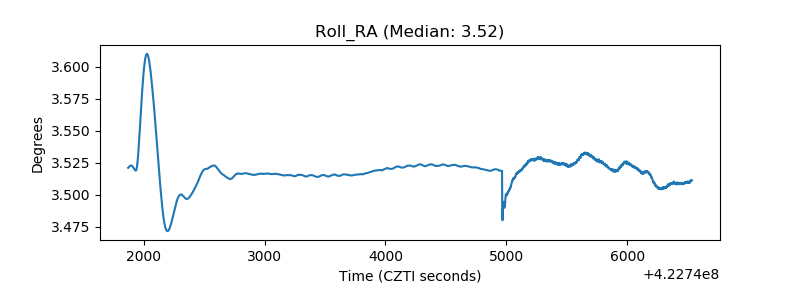 |
| Veto Counter | 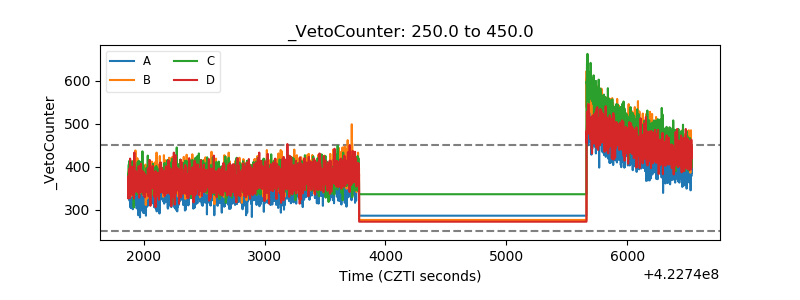 |