| Param | Original file | Final file |
|---|---|---|
| Filename | modeM0/AS1A12_035T01_9000005666_41401cztM0_level2.fits | modeM0/AS1A12_035T01_9000005666_41401cztM0_level2_quad_clean.evt |
| Size (bytes) | 362,983,680 | 91,460,160 |
| Size | 346.2 MB | 87.2 MB |
| Events in quadrant A | 3,137,954 | 628,892 |
| Events in quadrant B | 3,413,670 | 628,164 |
| Events in quadrant C | 3,193,780 | 584,618 |
| Events in quadrant D | 3,286,940 | 564,167 |
| Mode M0 | |||
|---|---|---|---|
| Quadrant | BADHDUFLAG | Total packets | Discarded packets |
| A | 0 | 12461 | 3 |
| B | 0 | 13435 | 2 |
| C | 0 | 12403 | 2 |
| D | 0 | 13131 | 2 |
| Mode SS | |||
|---|---|---|---|
| Quadrant | BADHDUFLAG | Total packets | Discarded packets |
| A | 0 | 108 | 0 |
| B | 0 | 108 | 0 |
| C | 0 | 108 | 0 |
| D | 0 | 108 | 0 |
| Mode M9 | |||
|---|---|---|---|
| Quadrant | BADHDUFLAG | Total packets | Discarded packets |
| A | 0 | 39 | 0 |
| B | 0 | 39 | 0 |
| C | 0 | 39 | 0 |
| D | 0 | 39 | 0 |
| Quadrant | Total seconds | Saturated seconds | Saturation percentage |
|---|---|---|---|
| A | 5192 | 54 | 1.040062% |
| B | 5192 | 272 | 5.238829% |
| C | 5192 | 261 | 5.026965% |
| D | 5192 | 70 | 1.348228% |
Noise dominated data is calculated using 1-second bins in cleaned event files. If a bin has >2000 counts, and if more than 50% of those come from <1% of pixels, then it is considered to be noise-dominated and hence unusable.
| Quadrant | # 1 sec bins | Bins with >0 counts | Bins with >2000 counts | High rate bins dominated by noise | Noise dominated (total time) | Noise dominated (detector-on time) | Marked lightcurve |
|---|---|---|---|---|---|---|---|
| A | 9077 | 5194 | 31 | 31 | 0.34% | 0.60% | 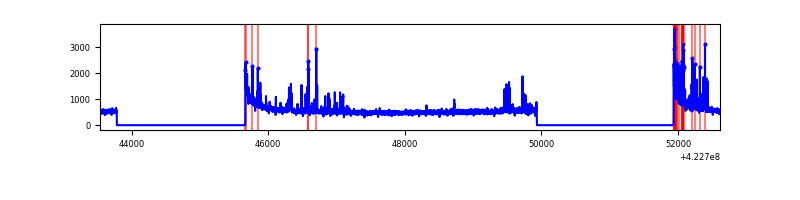 |
| B | 9077 | 5194 | 205 | 205 | 2.26% | 3.95% | 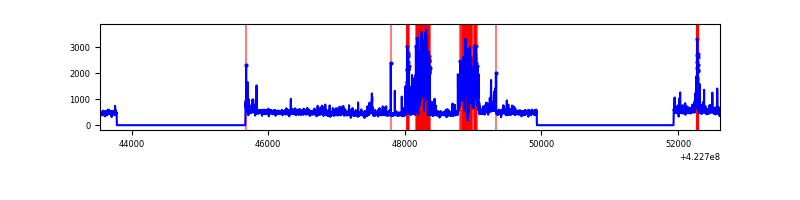 |
| C | 9077 | 5194 | 256 | 256 | 2.82% | 4.93% | 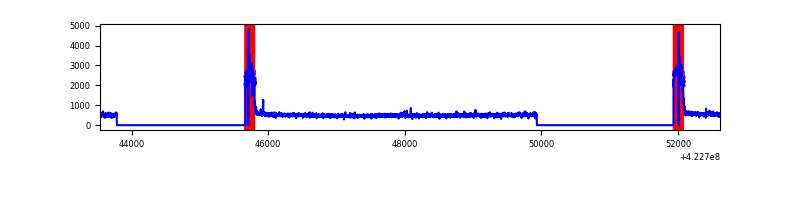 |
| D | 9077 | 5194 | 59 | 59 | 0.65% | 1.14% | 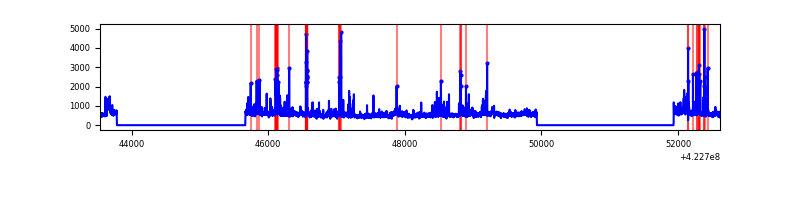 |
Top three noisy pixels from each quadrant. If the there are fewer than three noisy pixels in the level2.evt file, extra rows are filled as -1
| Pixel properties | Quadrant properties | ||||||
|---|---|---|---|---|---|---|---|
| Quadrant | DetID | PixID | Counts | Sigma | Mean | Median | Sigma |
| A | 10 | 83 | 485337 | 3901.16 | 605 | 592 | 124.3 |
| A | 13 | 248 | 287206 | 2306.63 | 605 | 592 | 124.3 |
| A | 12 | 189 | 12282 | 94.08 | 605 | 592 | 124.3 |
| B | 5 | 255 | 1025456 | 8999.59 | 594 | 579 | 113.9 |
| B | 0 | 190 | 28559 | 245.7 | 594 | 579 | 113.9 |
| B | 12 | 111 | 14362 | 121.03 | 594 | 579 | 113.9 |
| C | 0 | 10 | 724979 | 5387.93 | 577 | 579 | 134.4 |
| C | 15 | 214 | 213540 | 1583.96 | 577 | 579 | 134.4 |
| C | 13 | 61 | 3877 | 24.53 | 577 | 579 | 134.4 |
| D | 12 | 79 | 262698 | 1800.52 | 595 | 580 | 145.6 |
| D | 13 | 174 | 250318 | 1715.48 | 595 | 580 | 145.6 |
| D | 13 | 249 | 158425 | 1084.25 | 595 | 580 | 145.6 |
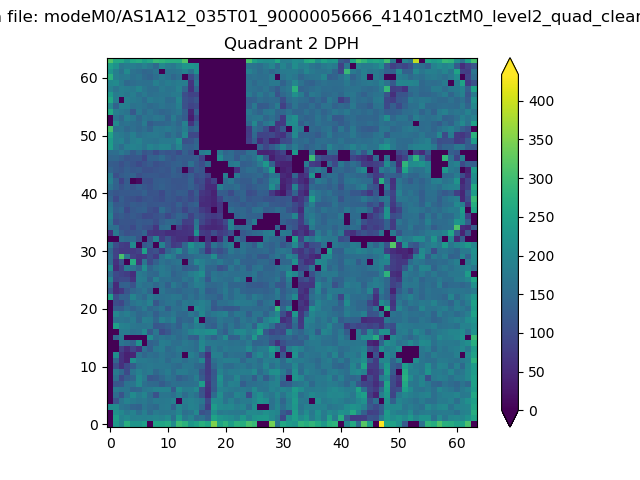
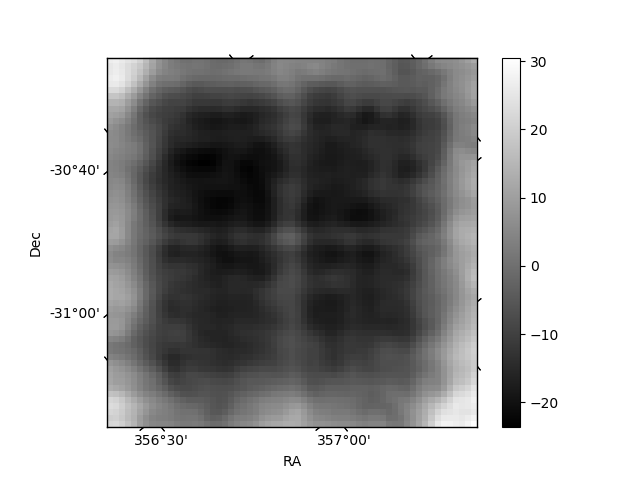
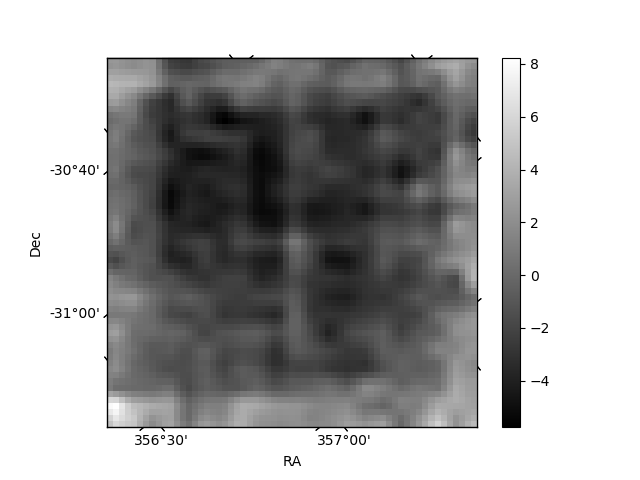
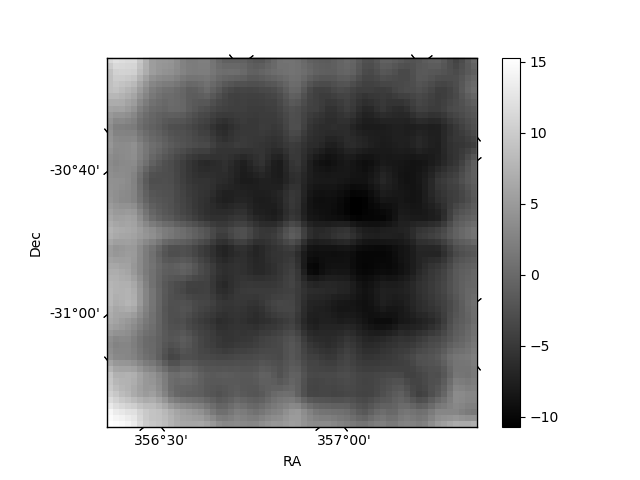
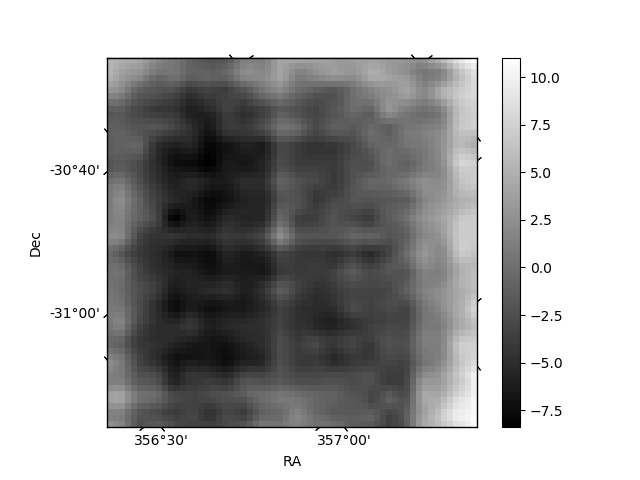
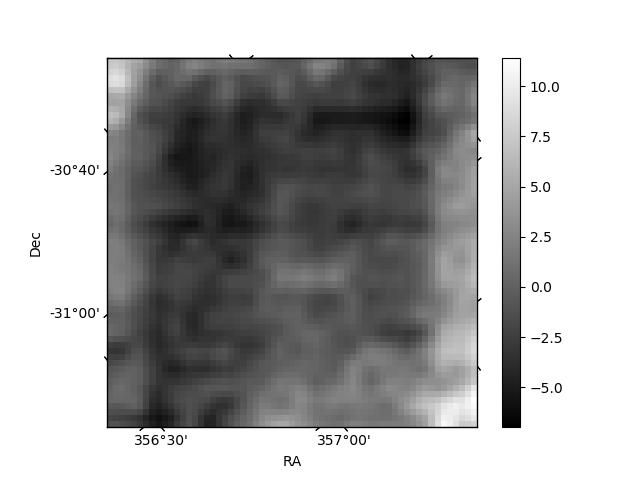
Histogram calculated using DETX and DETY for each event in the final _common_clean file
| Quadrant A | 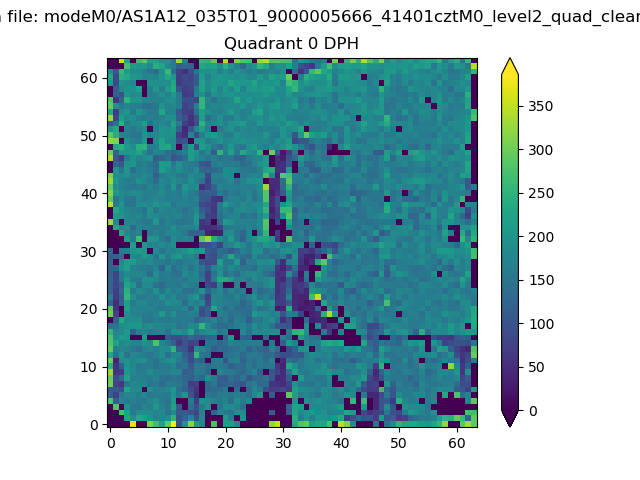 |
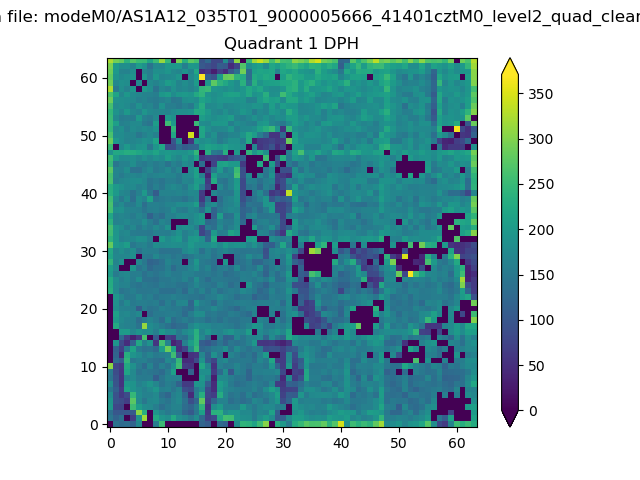 |
Quadrant B |
|---|---|---|---|
| Quadrant D | 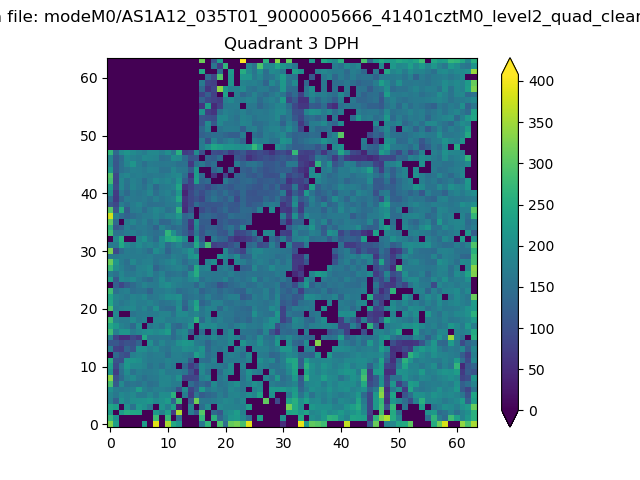 |
 |
Quadrant C |
| Plot type | Count rate plots | Images |
|---|---|---|
| Comparison with Poisson distribution Blue bars denote a histogram of data divided into 1 sec bins. Red curve is a Poisson curve with rate = median count rate of data. |
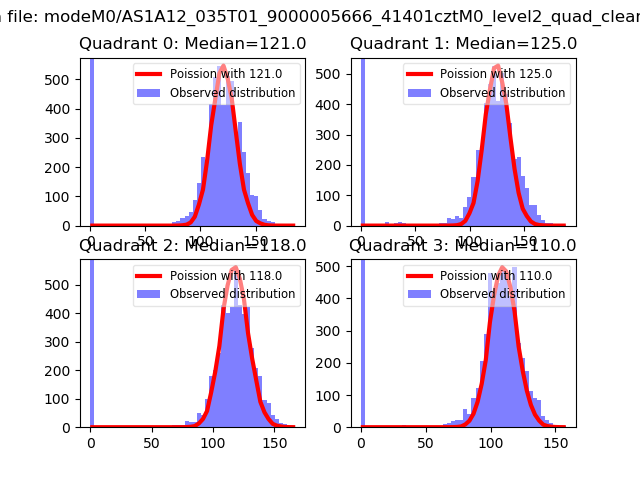 |
 |
| Quadrant-wise count rates Data is divided into 100 sec bins |
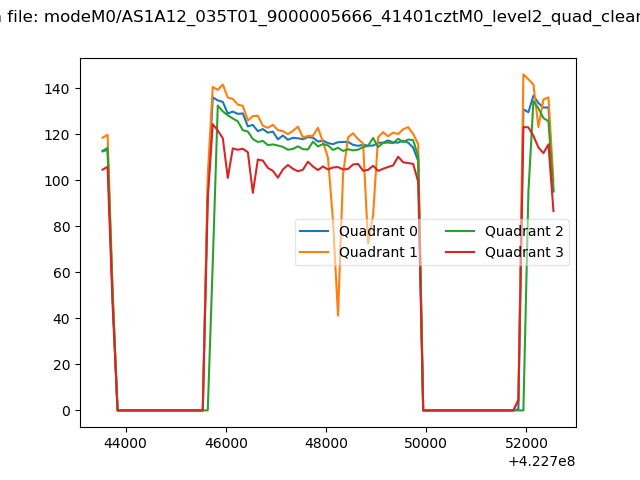 |
|
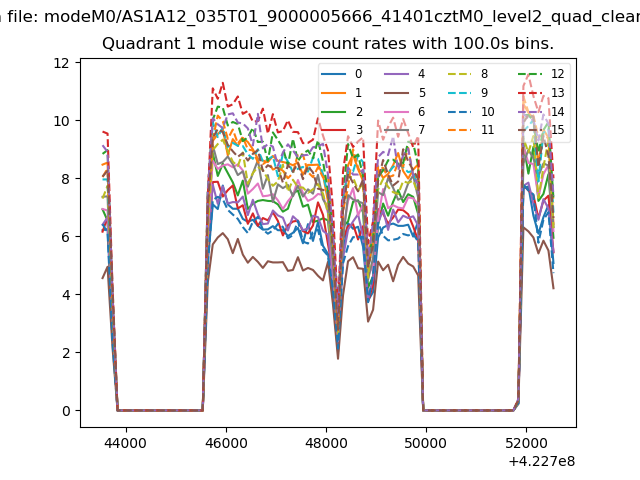
| Module-wise count rates for Quadrant A Data is divided into 100 sec bins |
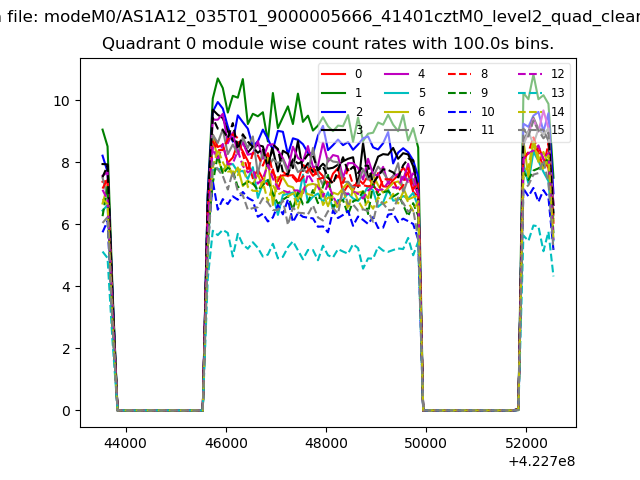 |
 |
| Module-wise count rates for Quadrant B Data is divided into 100 sec bins |
 |
 |
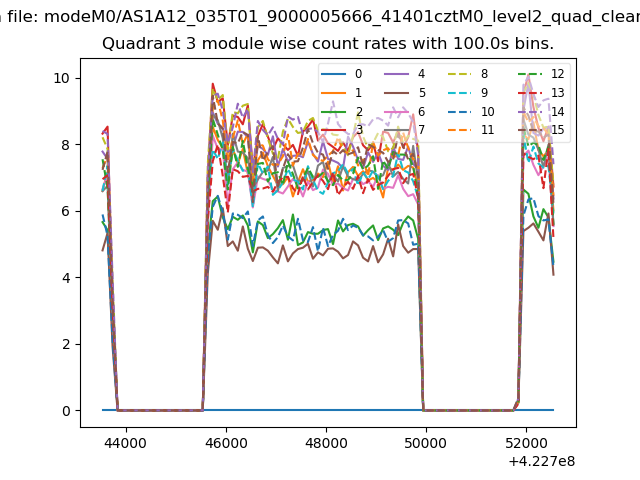
| Module-wise count rates for Quadrant C Data is divided into 100 sec bins |
 |
 |
| Module-wise count rates for Quadrant D Data is divided into 100 sec bins |
 |
 |
| Parameter | Plot |
|---|---|
| CZT HV Monitor | 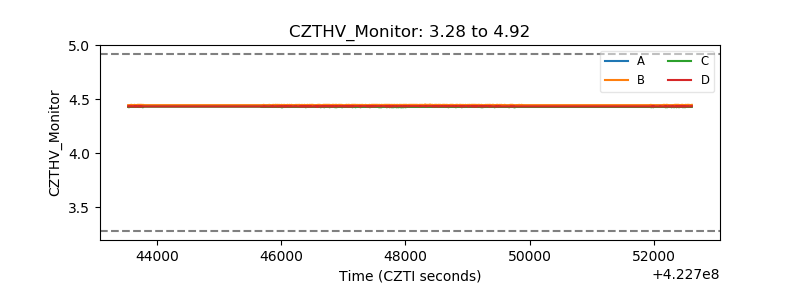 |
| D_VDD | 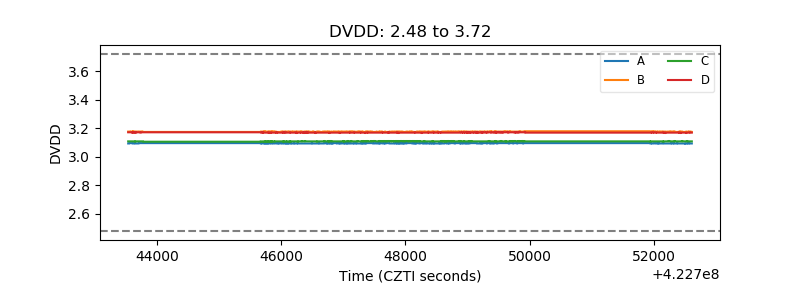 |
| Temperature 1 | 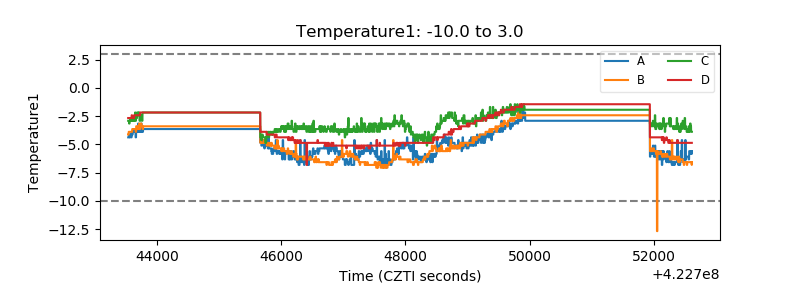 |
| Veto HV Monitor | 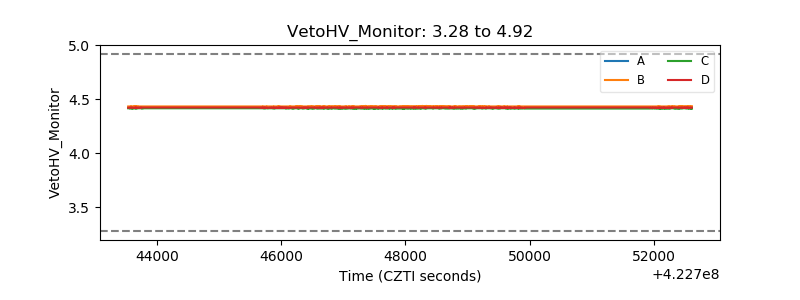 |
| Veto LLD | 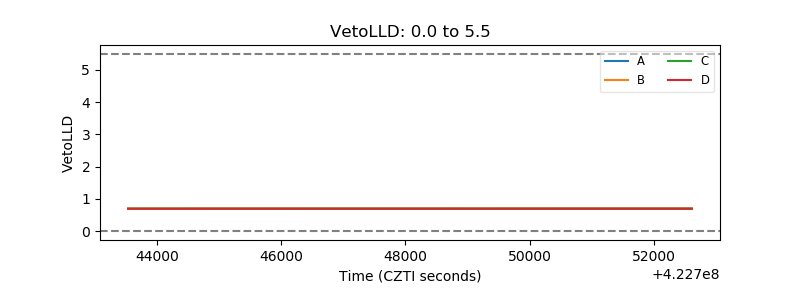 |
| Alpha Counter | 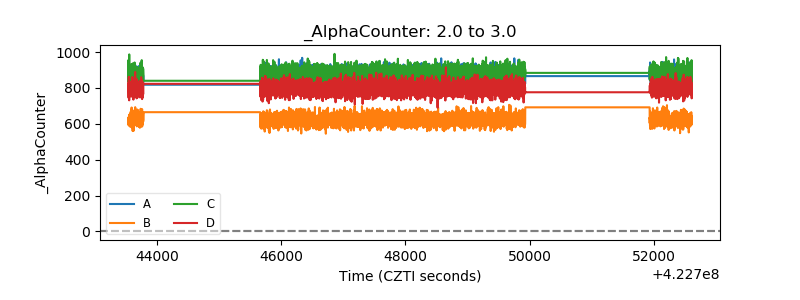 |
| _CPM_Rate | 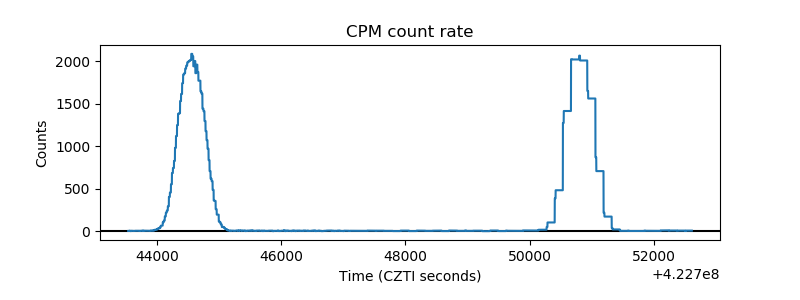 |
| CZT Counter | 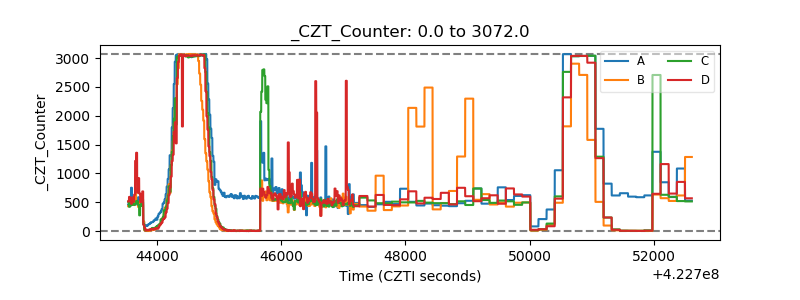 |
| +2.5 Volts monitor | 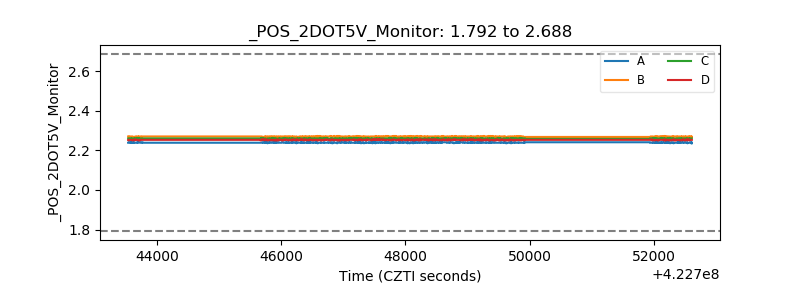 |
| +5 Volts monitor | 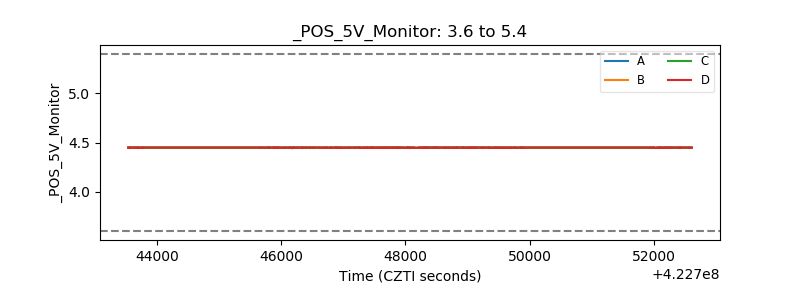 |
| _ROLL_ROT | 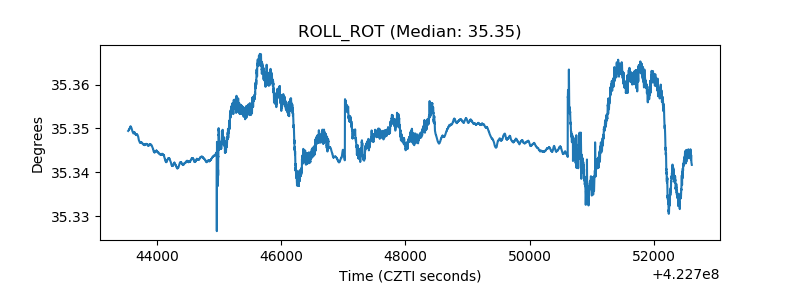 |
| _Roll_DEC | 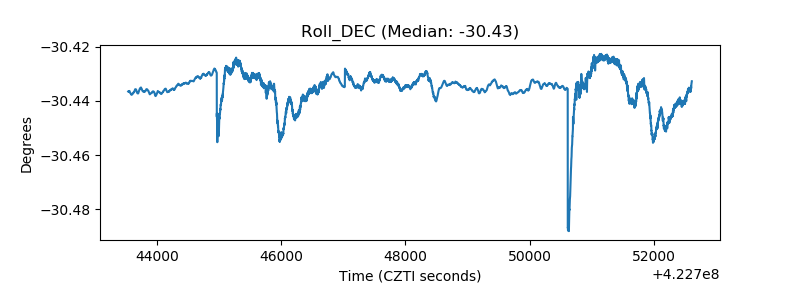 |
| _Roll_RA | 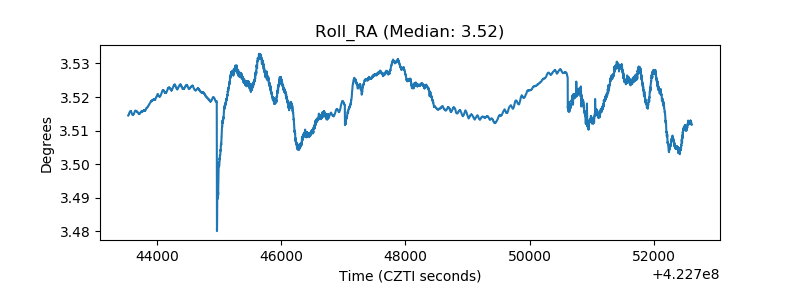 |
| Veto Counter | 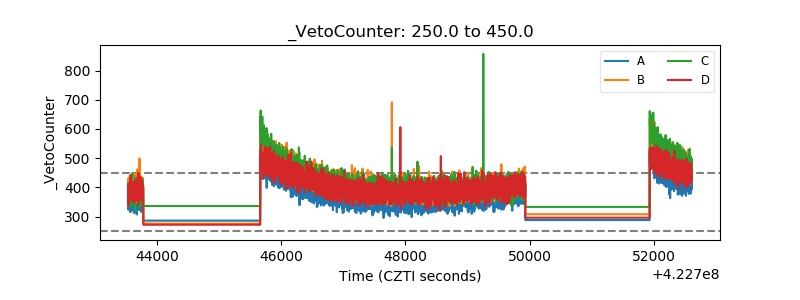 |