| Param | Original file | Final file |
|---|---|---|
| Filename | modeM0/AS1A12_035T01_9000005666_41402cztM0_level2.fits | modeM0/AS1A12_035T01_9000005666_41402cztM0_level2_quad_clean.evt |
| Size (bytes) | 365,446,080 | 88,516,800 |
| Size | 348.5 MB | 84.4 MB |
| Events in quadrant A | 3,074,943 | 606,458 |
| Events in quadrant B | 3,355,712 | 612,992 |
| Events in quadrant C | 3,141,838 | 567,946 |
| Events in quadrant D | 3,567,971 | 544,132 |
| Mode M0 | |||
|---|---|---|---|
| Quadrant | BADHDUFLAG | Total packets | Discarded packets |
| A | 0 | 12148 | 3 |
| B | 0 | 13133 | 2 |
| C | 0 | 12091 | 2 |
| D | 0 | 13887 | 2 |
| Mode SS | |||
|---|---|---|---|
| Quadrant | BADHDUFLAG | Total packets | Discarded packets |
| A | 0 | 102 | 0 |
| B | 0 | 102 | 0 |
| C | 0 | 102 | 0 |
| D | 0 | 102 | 0 |
| Mode M9 | |||
|---|---|---|---|
| Quadrant | BADHDUFLAG | Total packets | Discarded packets |
| A | 0 | 36 | 0 |
| B | 0 | 36 | 0 |
| C | 0 | 36 | 0 |
| D | 0 | 37 | 0 |
| Quadrant | Total seconds | Saturated seconds | Saturation percentage |
|---|---|---|---|
| A | 4977 | 59 | 1.185453% |
| B | 4977 | 203 | 4.078762% |
| C | 4977 | 267 | 5.364678% |
| D | 4977 | 137 | 2.752662% |
Noise dominated data is calculated using 1-second bins in cleaned event files. If a bin has >2000 counts, and if more than 50% of those come from <1% of pixels, then it is considered to be noise-dominated and hence unusable.
| Quadrant | # 1 sec bins | Bins with >0 counts | Bins with >2000 counts | High rate bins dominated by noise | Noise dominated (total time) | Noise dominated (detector-on time) | Marked lightcurve |
|---|---|---|---|---|---|---|---|
| A | 7039 | 4978 | 40 | 40 | 0.57% | 0.80% | 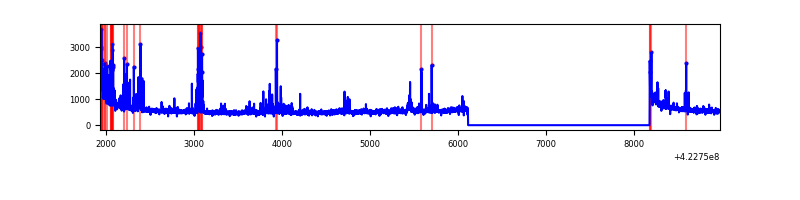 |
| B | 7039 | 4978 | 173 | 173 | 2.46% | 3.48% | 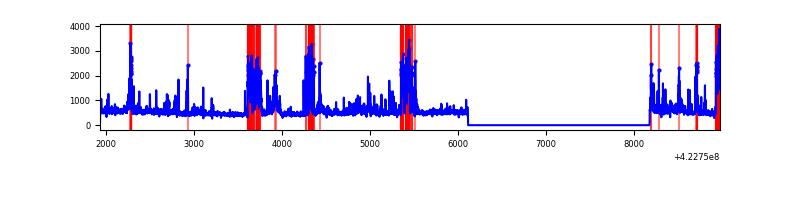 |
| C | 7039 | 4978 | 258 | 258 | 3.67% | 5.18% | 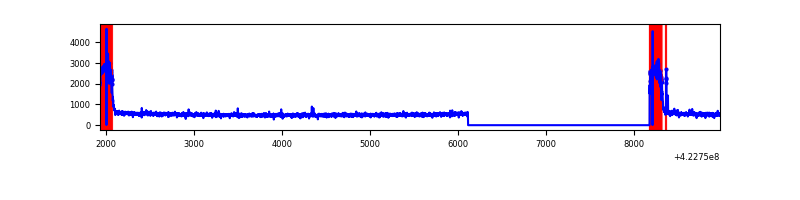 |
| D | 7039 | 4978 | 122 | 122 | 1.73% | 2.45% | 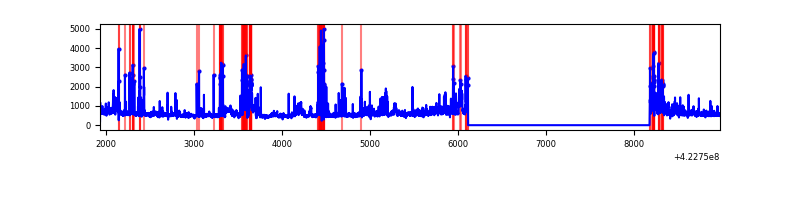 |
Top three noisy pixels from each quadrant. If the there are fewer than three noisy pixels in the level2.evt file, extra rows are filled as -1
| Pixel properties | Quadrant properties | ||||||
|---|---|---|---|---|---|---|---|
| Quadrant | DetID | PixID | Counts | Sigma | Mean | Median | Sigma |
| A | 10 | 83 | 478757 | 4058.69 | 577 | 566 | 117.8 |
| A | 13 | 248 | 343706 | 2912.44 | 577 | 566 | 117.8 |
| A | 12 | 189 | 12541 | 101.64 | 577 | 566 | 117.8 |
| B | 5 | 255 | 1071838 | 9661.84 | 572 | 557 | 110.9 |
| B | 0 | 229 | 18434 | 161.23 | 572 | 557 | 110.9 |
| B | 12 | 111 | 13674 | 118.3 | 572 | 557 | 110.9 |
| C | 0 | 10 | 742201 | 5744.54 | 555 | 559 | 129.1 |
| C | 15 | 214 | 219676 | 1697.21 | 555 | 559 | 129.1 |
| C | 0 | 15 | 14008 | 104.17 | 555 | 559 | 129.1 |
| D | 5 | 222 | 456369 | 3309.37 | 568 | 554 | 137.7 |
| D | 13 | 174 | 274570 | 1989.45 | 568 | 554 | 137.7 |
| D | 1 | 52 | 227347 | 1646.6 | 568 | 554 | 137.7 |
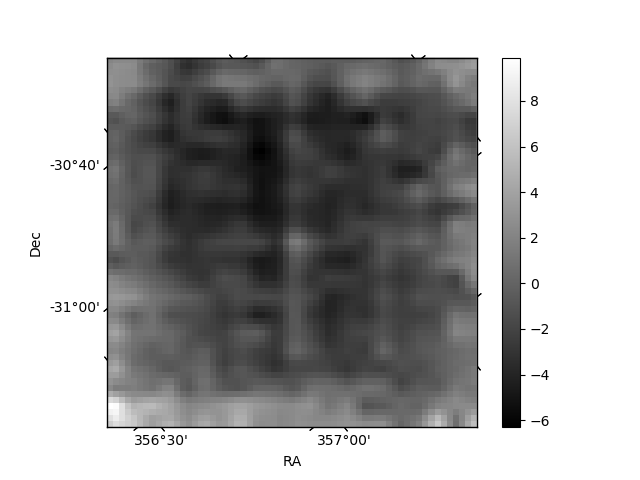
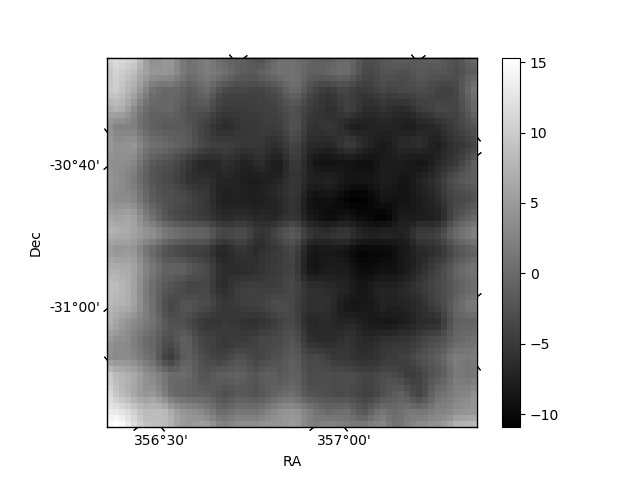
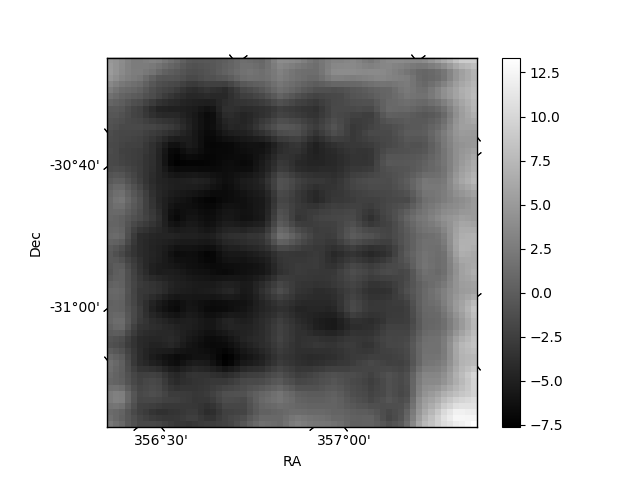
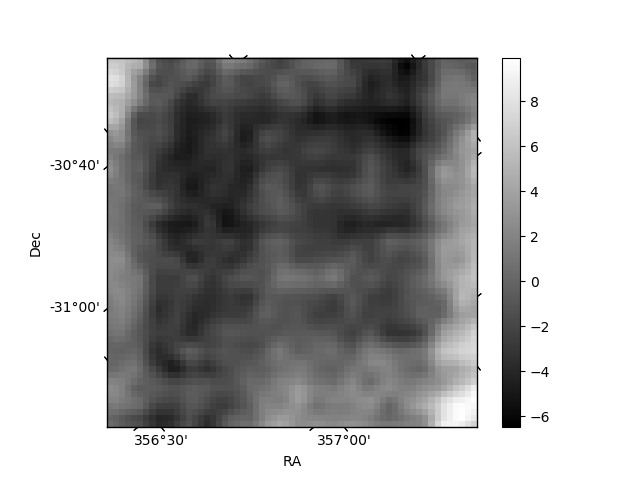
Histogram calculated using DETX and DETY for each event in the final _common_clean file
| Quadrant A | 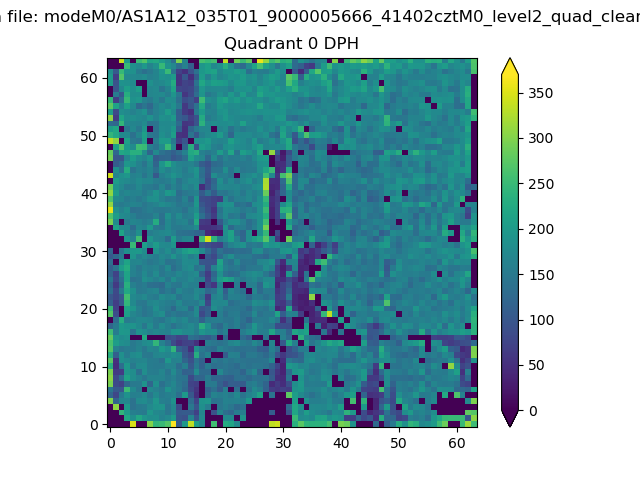 |
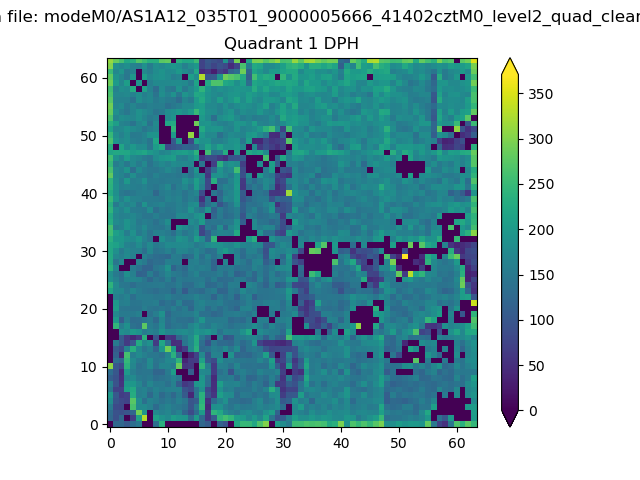 |
Quadrant B |
|---|---|---|---|
| Quadrant D | 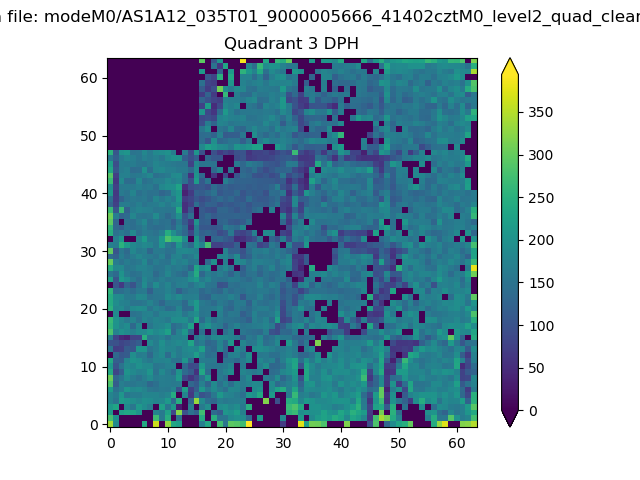 |
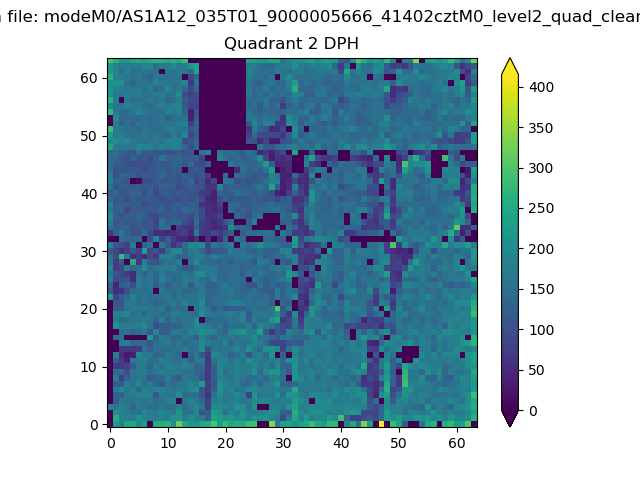 |
Quadrant C |
| Plot type | Count rate plots | Images |
|---|---|---|
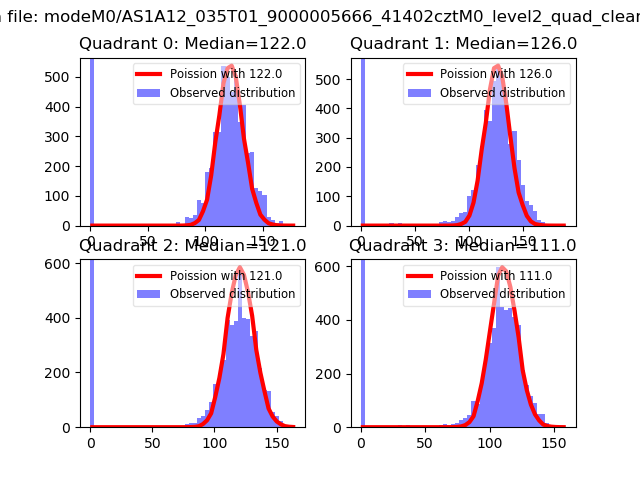
| Comparison with Poisson distribution Blue bars denote a histogram of data divided into 1 sec bins. Red curve is a Poisson curve with rate = median count rate of data. |
 |
 |
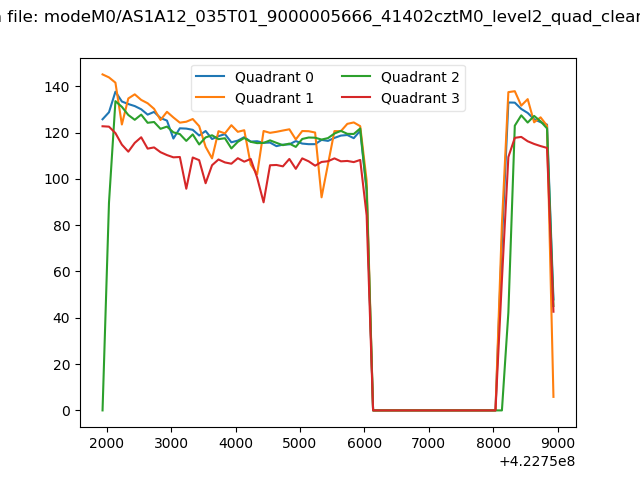
| Quadrant-wise count rates Data is divided into 100 sec bins |
 |
|
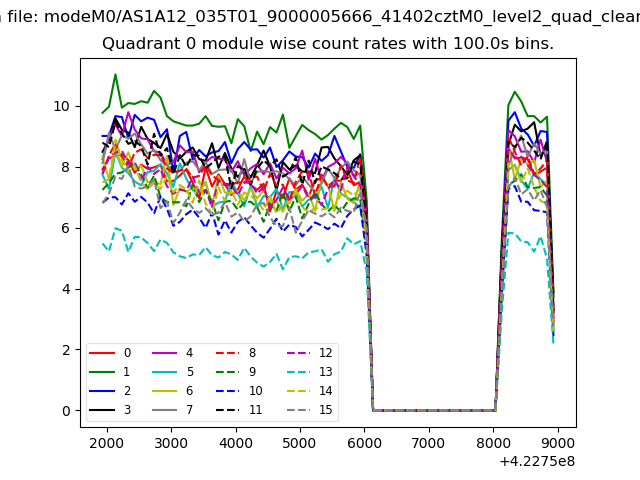
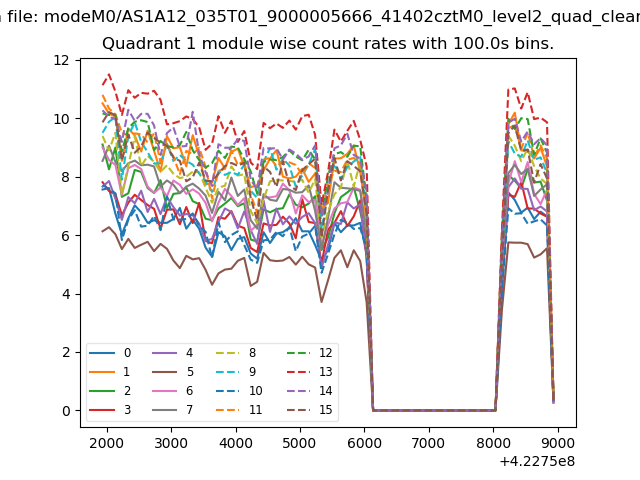
| Module-wise count rates for Quadrant A Data is divided into 100 sec bins |
 |
 |
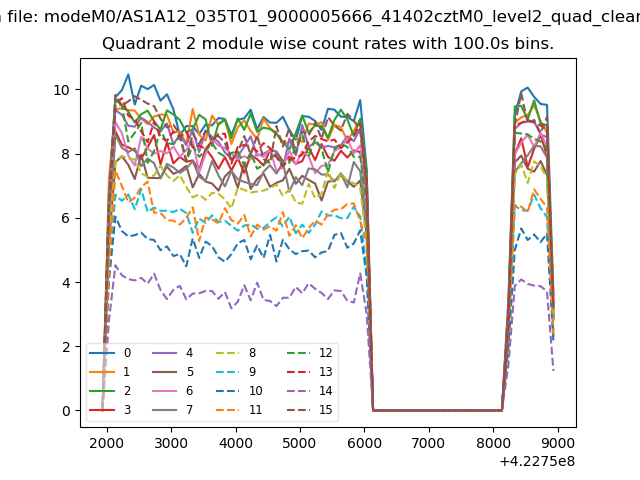
| Module-wise count rates for Quadrant B Data is divided into 100 sec bins |
 |
 |
| Module-wise count rates for Quadrant C Data is divided into 100 sec bins |
 |
 |
| Module-wise count rates for Quadrant D Data is divided into 100 sec bins |
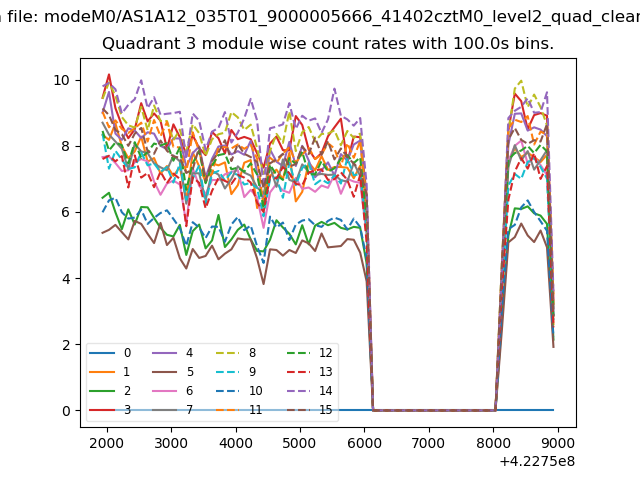 |
 |
| Parameter | Plot |
|---|---|
| CZT HV Monitor | 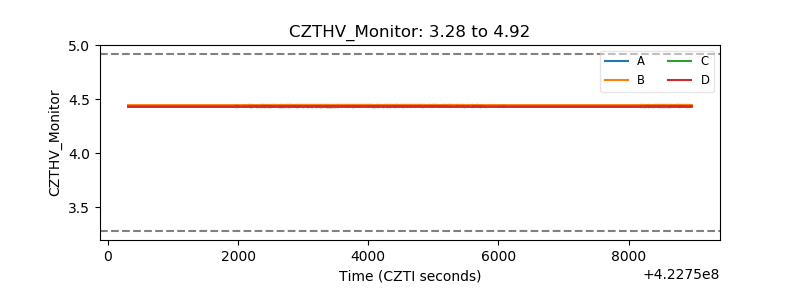 |
| D_VDD | 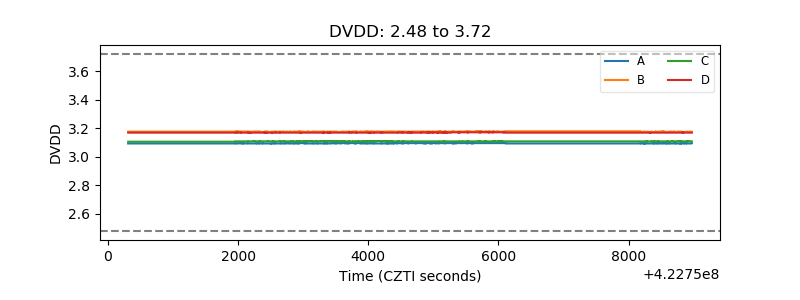 |
| Temperature 1 | 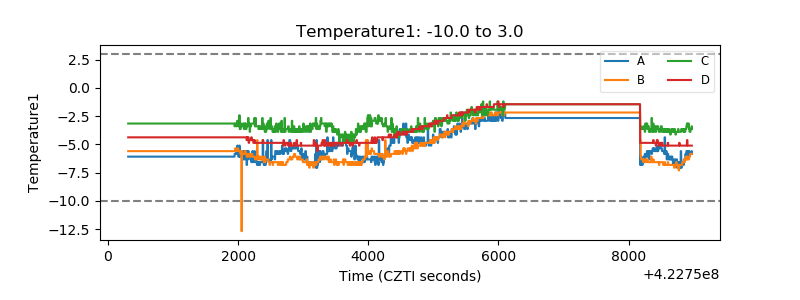 |
| Veto HV Monitor | 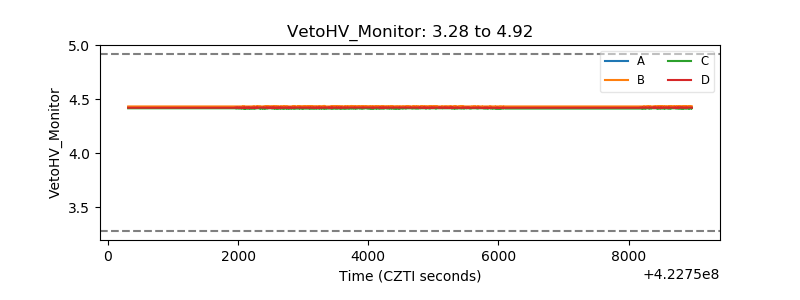 |
| Veto LLD | 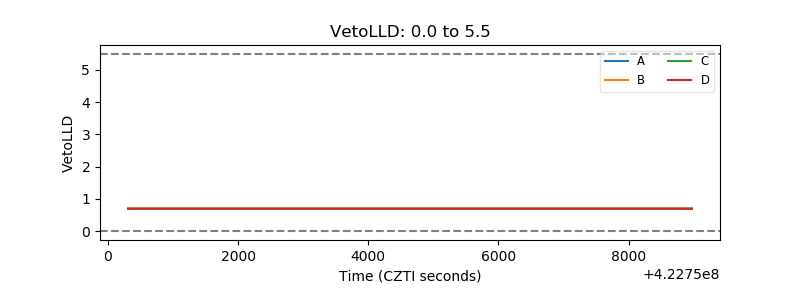 |
| Alpha Counter | 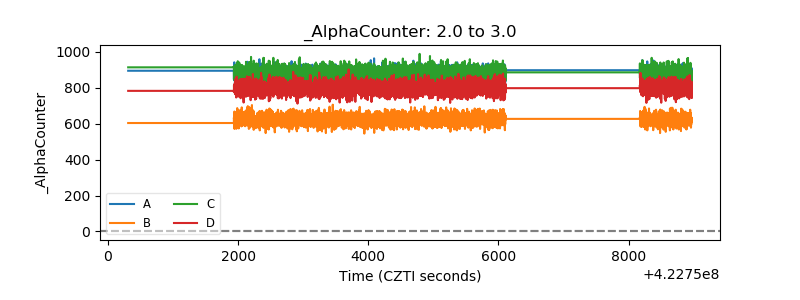 |
| _CPM_Rate | 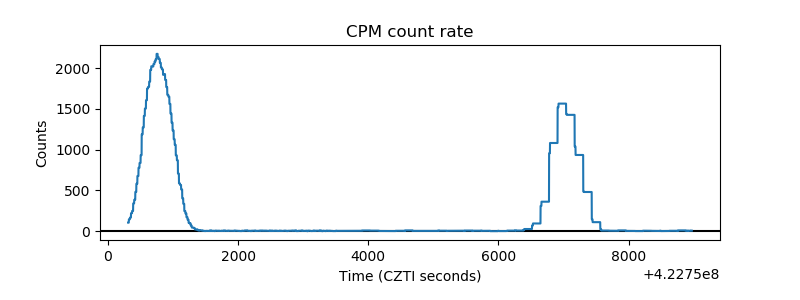 |
| CZT Counter | 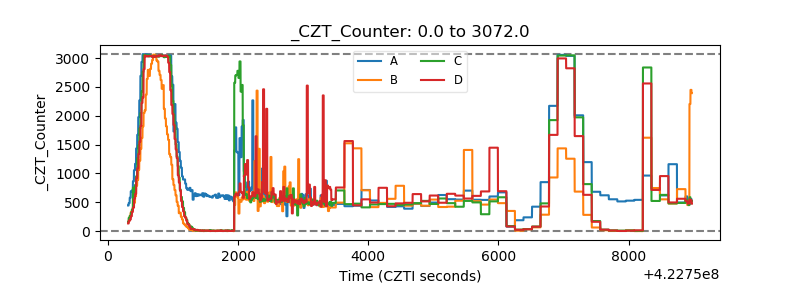 |
| +2.5 Volts monitor | 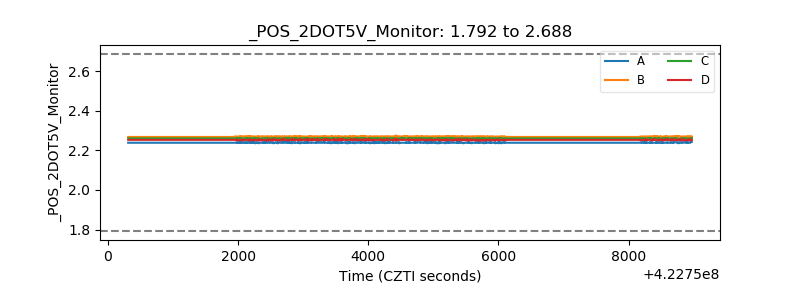 |
| +5 Volts monitor | 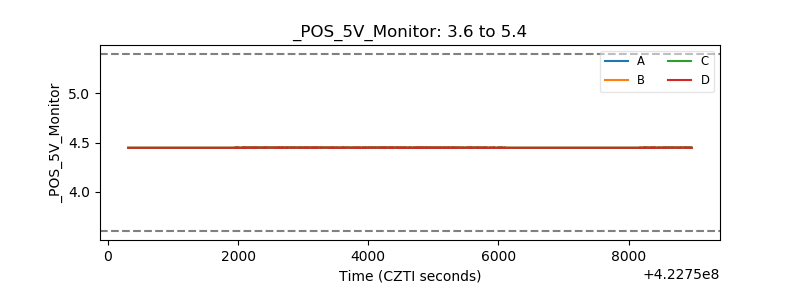 |
| _ROLL_ROT | 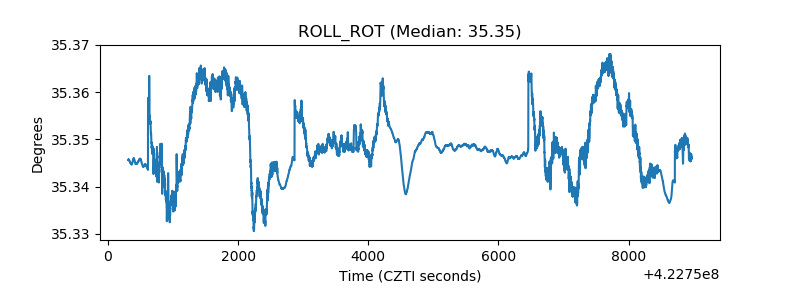 |
| _Roll_DEC |  |
| _Roll_RA | 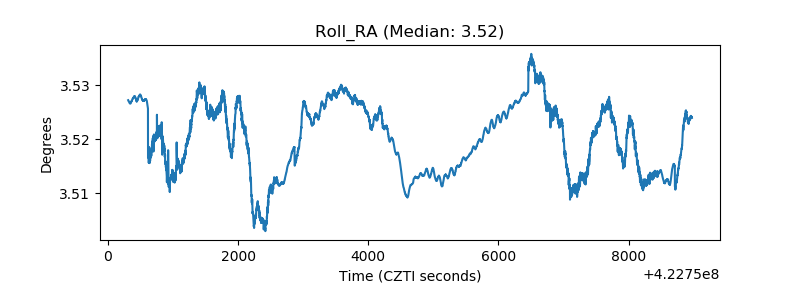 |
| Veto Counter | 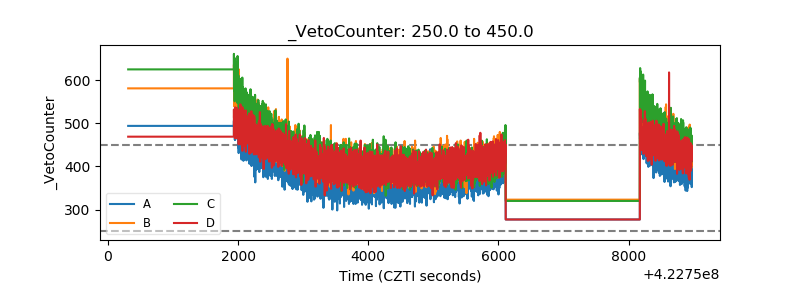 |