| Param | Original file | Final file |
|---|---|---|
| Filename | modeM0/AS1A12_035T01_9000005666_41403cztM0_level2.fits | modeM0/AS1A12_035T01_9000005666_41403cztM0_level2_quad_clean.evt |
| Size (bytes) | 336,608,640 | 85,870,080 |
| Size | 321.0 MB | 81.9 MB |
| Events in quadrant A | 3,205,350 | 579,816 |
| Events in quadrant B | 2,999,882 | 595,140 |
| Events in quadrant C | 3,063,613 | 547,550 |
| Events in quadrant D | 2,807,098 | 531,367 |
| Mode M0 | |||
|---|---|---|---|
| Quadrant | BADHDUFLAG | Total packets | Discarded packets |
| A | 0 | 12645 | 3 |
| B | 0 | 12042 | 2 |
| C | 0 | 11961 | 2 |
| D | 0 | 11505 | 2 |
| Mode SS | |||
|---|---|---|---|
| Quadrant | BADHDUFLAG | Total packets | Discarded packets |
| A | 0 | 102 | 0 |
| B | 0 | 102 | 0 |
| C | 0 | 102 | 0 |
| D | 0 | 102 | 0 |
| Mode M9 | |||
|---|---|---|---|
| Quadrant | BADHDUFLAG | Total packets | Discarded packets |
| A | 0 | 29 | 0 |
| B | 0 | 29 | 0 |
| C | 0 | 29 | 0 |
| D | 0 | 30 | 0 |
| Quadrant | Total seconds | Saturated seconds | Saturation percentage |
|---|---|---|---|
| A | 4935 | 63 | 1.276596% |
| B | 4935 | 112 | 2.269504% |
| C | 4935 | 263 | 5.329281% |
| D | 4935 | 57 | 1.155015% |
Noise dominated data is calculated using 1-second bins in cleaned event files. If a bin has >2000 counts, and if more than 50% of those come from <1% of pixels, then it is considered to be noise-dominated and hence unusable.
| Quadrant | # 1 sec bins | Bins with >0 counts | Bins with >2000 counts | High rate bins dominated by noise | Noise dominated (total time) | Noise dominated (detector-on time) | Marked lightcurve |
|---|---|---|---|---|---|---|---|
| A | 7058 | 4936 | 44 | 44 | 0.62% | 0.89% | 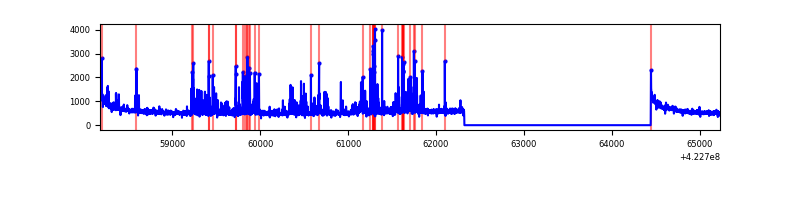 |
| B | 7058 | 4936 | 86 | 86 | 1.22% | 1.74% | 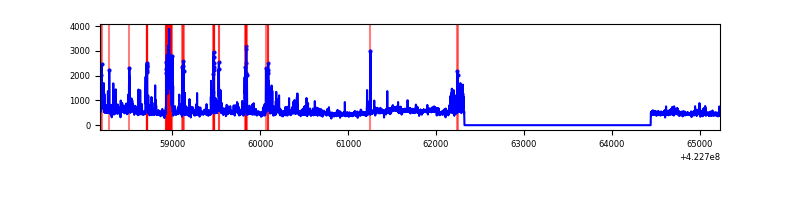 |
| C | 7058 | 4936 | 250 | 250 | 3.54% | 5.06% | 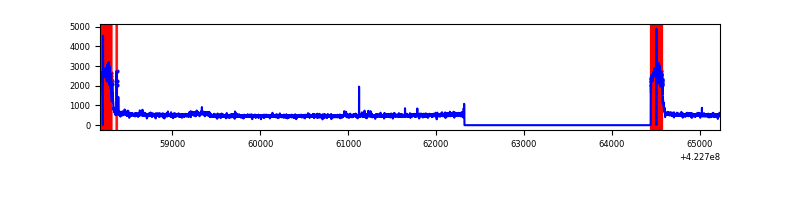 |
| D | 7058 | 4936 | 43 | 43 | 0.61% | 0.87% | 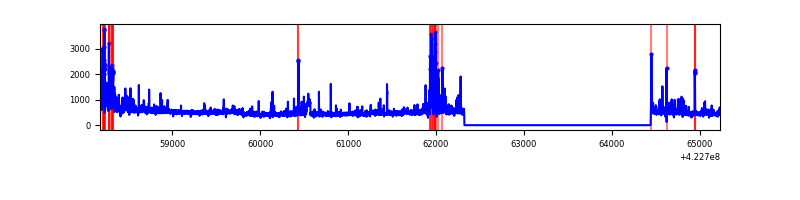 |
Top three noisy pixels from each quadrant. If the there are fewer than three noisy pixels in the level2.evt file, extra rows are filled as -1
| Pixel properties | Quadrant properties | ||||||
|---|---|---|---|---|---|---|---|
| Quadrant | DetID | PixID | Counts | Sigma | Mean | Median | Sigma |
| A | 13 | 248 | 502088 | 4387.26 | 559 | 548 | 114.3 |
| A | 10 | 83 | 478986 | 4185.18 | 559 | 548 | 114.3 |
| A | 12 | 189 | 50950 | 440.89 | 559 | 548 | 114.3 |
| B | 5 | 255 | 575542 | 5337.71 | 556 | 541 | 107.7 |
| B | 0 | 229 | 180171 | 1667.5 | 556 | 541 | 107.7 |
| B | 0 | 190 | 55483 | 510.02 | 556 | 541 | 107.7 |
| C | 0 | 10 | 693281 | 5518.05 | 539 | 542 | 125.5 |
| C | 15 | 214 | 218171 | 1733.53 | 539 | 542 | 125.5 |
| C | 0 | 15 | 44616 | 351.07 | 539 | 542 | 125.5 |
| D | 1 | 52 | 210866 | 1558.13 | 555 | 541 | 135.0 |
| D | 13 | 249 | 131984 | 973.75 | 555 | 541 | 135.0 |
| D | 13 | 174 | 131429 | 969.64 | 555 | 541 | 135.0 |
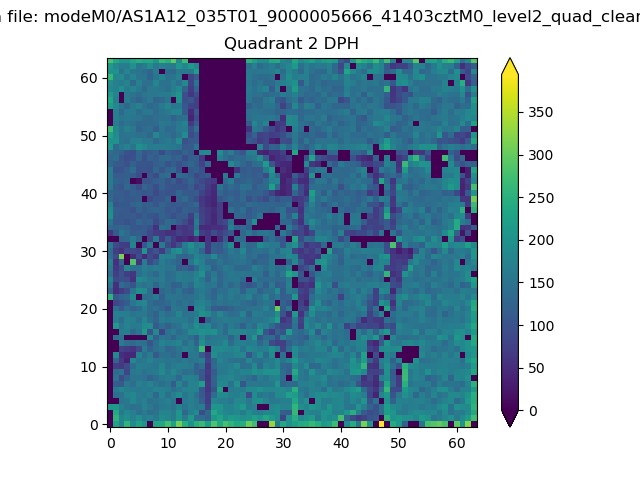
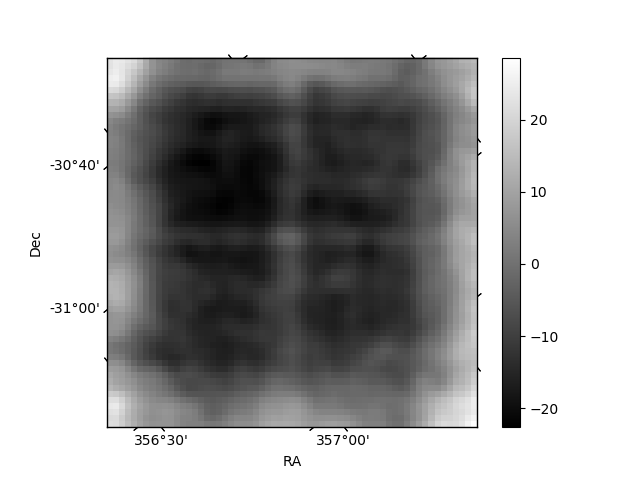
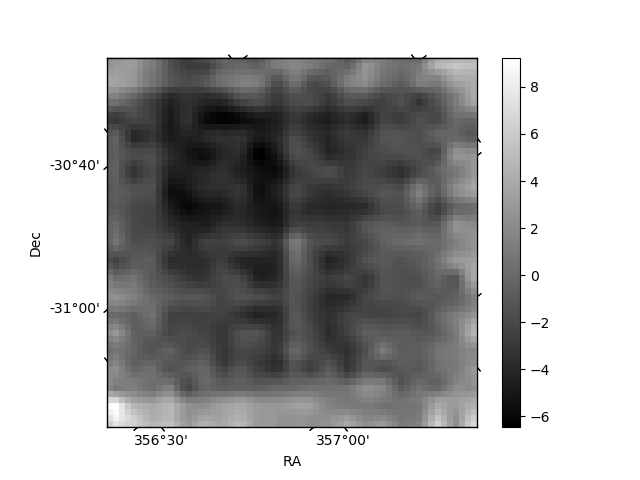
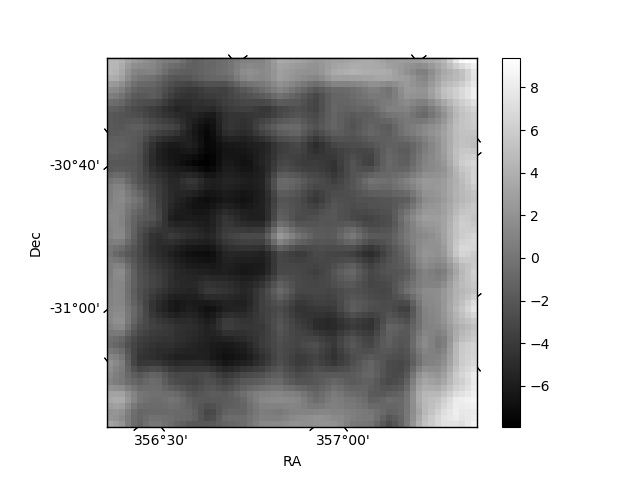
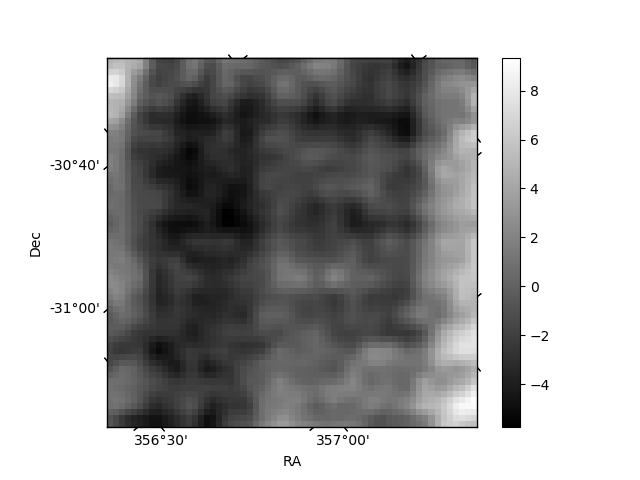
Histogram calculated using DETX and DETY for each event in the final _common_clean file
| Quadrant A | 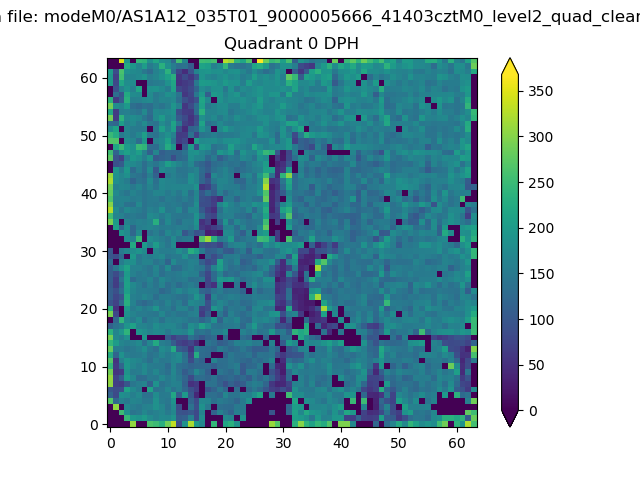 |
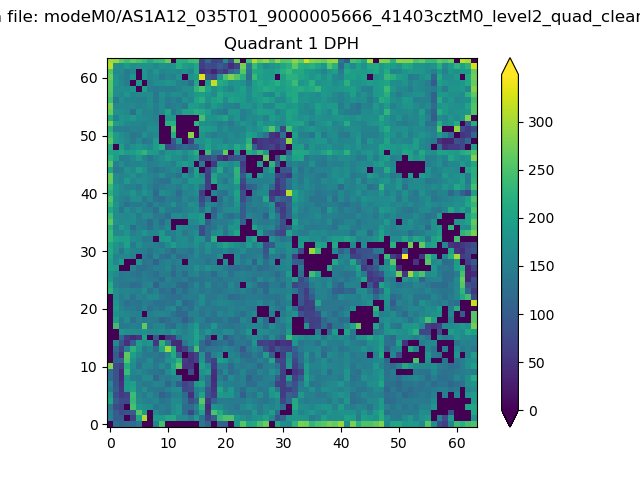 |
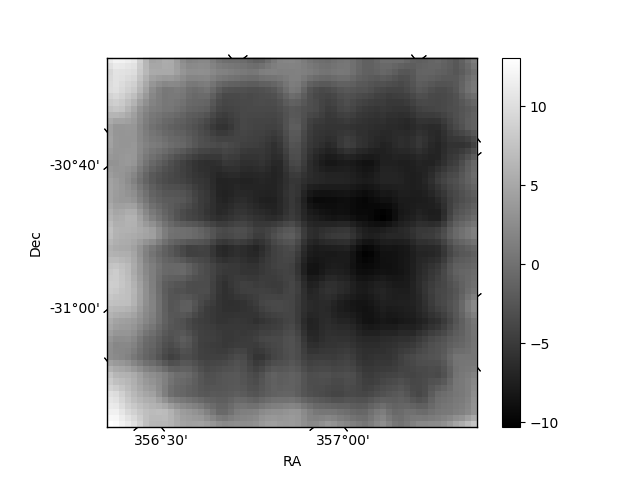
Quadrant B |
|---|---|---|---|
| Quadrant D | 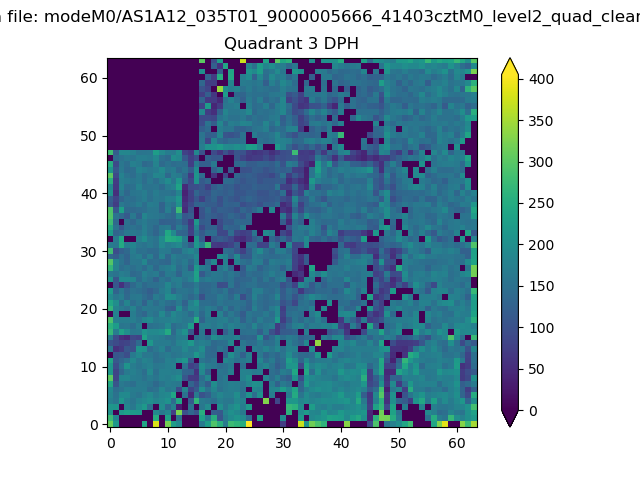 |
 |
Quadrant C |
| Plot type | Count rate plots | Images |
|---|---|---|
| Comparison with Poisson distribution Blue bars denote a histogram of data divided into 1 sec bins. Red curve is a Poisson curve with rate = median count rate of data. |
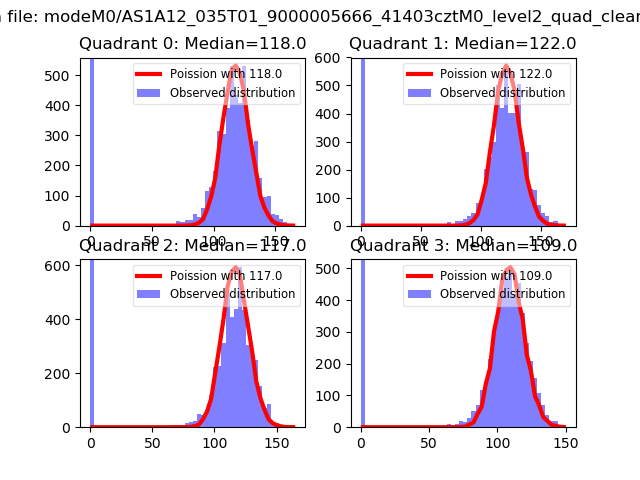 |
 |
| Quadrant-wise count rates Data is divided into 100 sec bins |
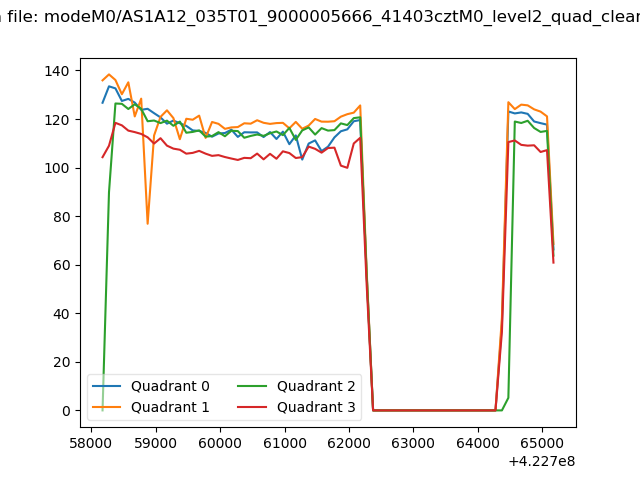 |
|
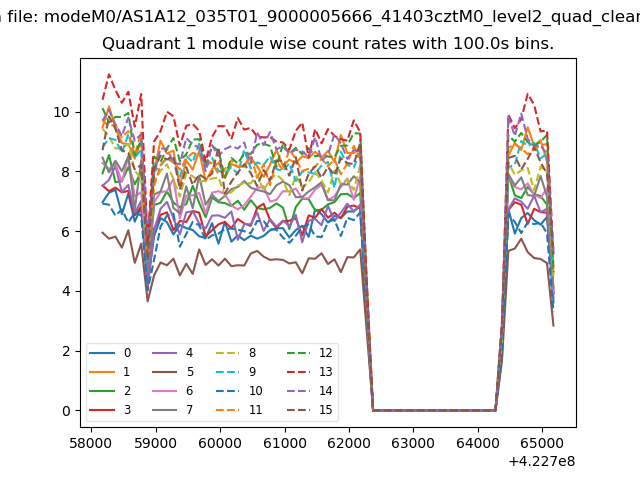
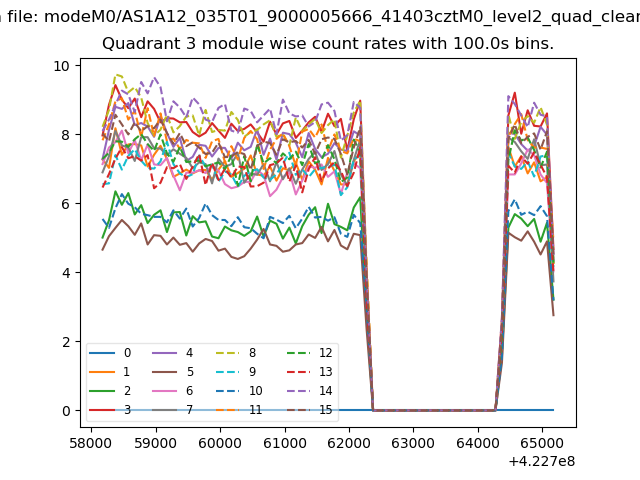
| Module-wise count rates for Quadrant A Data is divided into 100 sec bins |
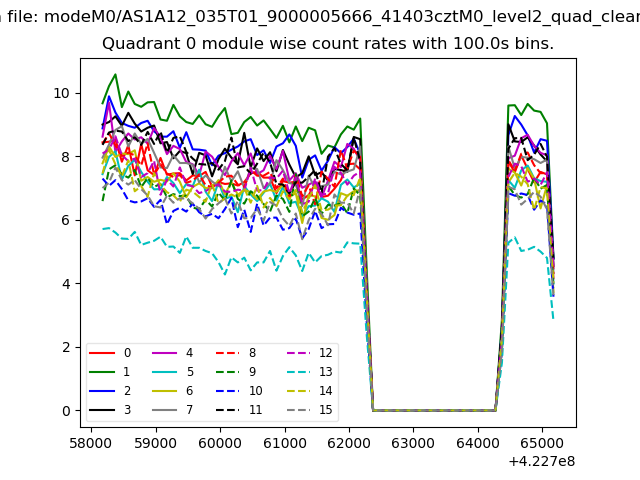 |
 |
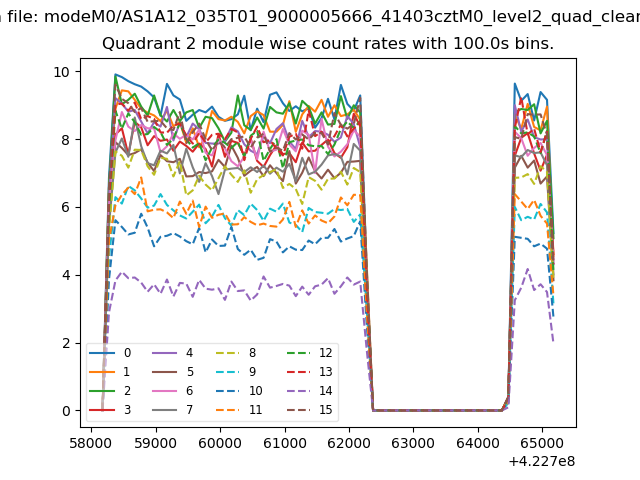
| Module-wise count rates for Quadrant B Data is divided into 100 sec bins |
 |
 |
| Module-wise count rates for Quadrant C Data is divided into 100 sec bins |
 |
 |
| Module-wise count rates for Quadrant D Data is divided into 100 sec bins |
 |
 |
| Parameter | Plot |
|---|---|
| CZT HV Monitor | 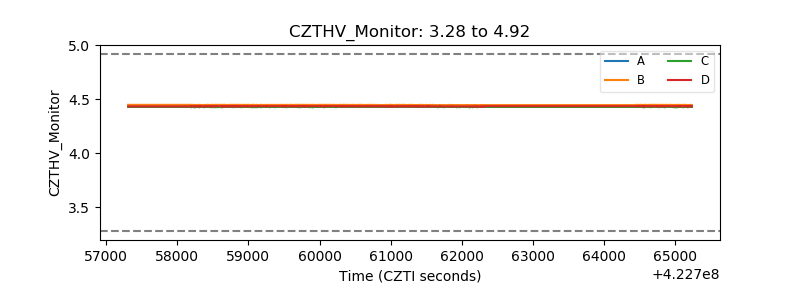 |
| D_VDD | 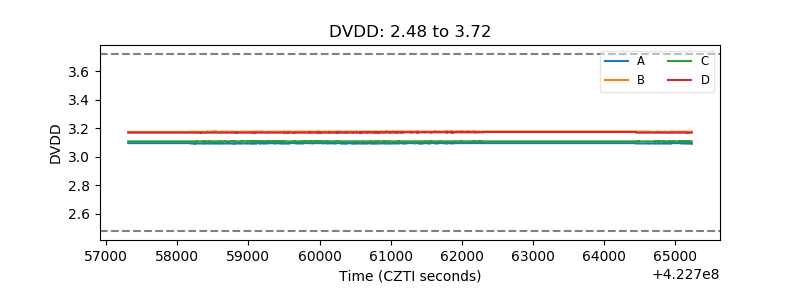 |
| Temperature 1 | 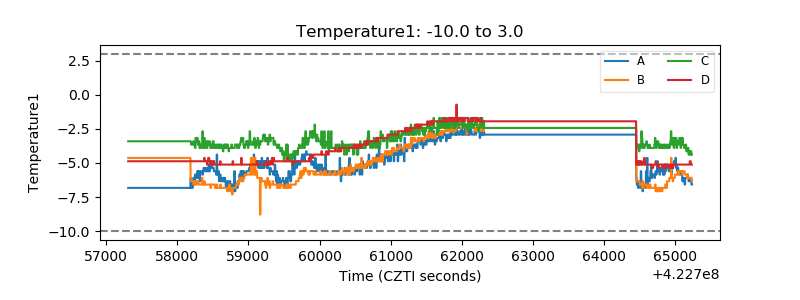 |
| Veto HV Monitor | 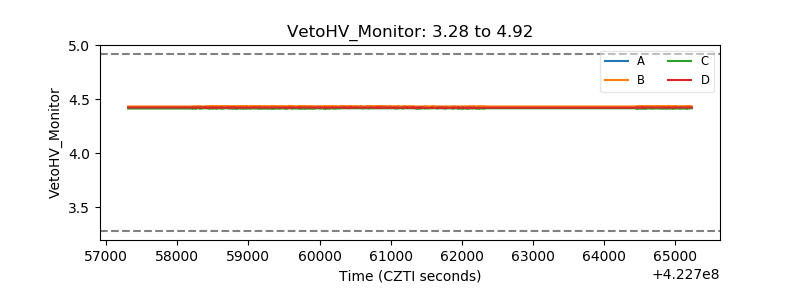 |
| Veto LLD | 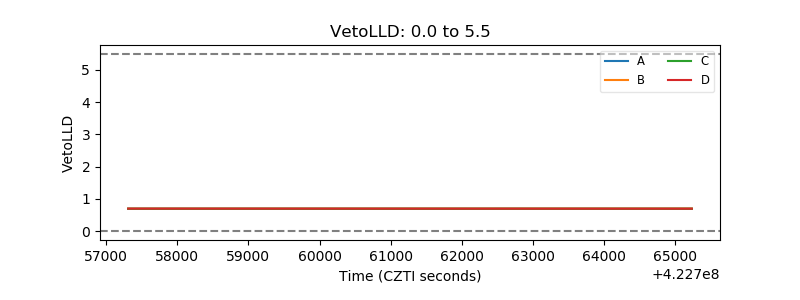 |
| Alpha Counter | 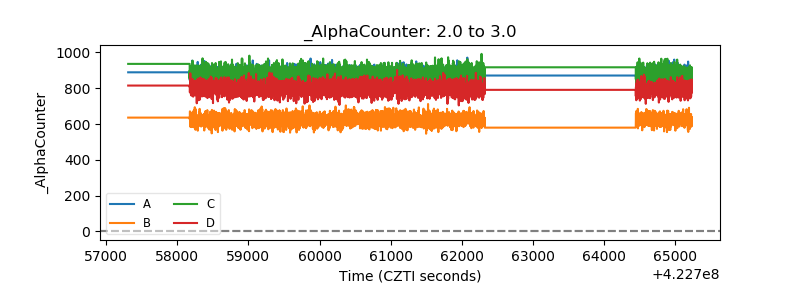 |
| _CPM_Rate | 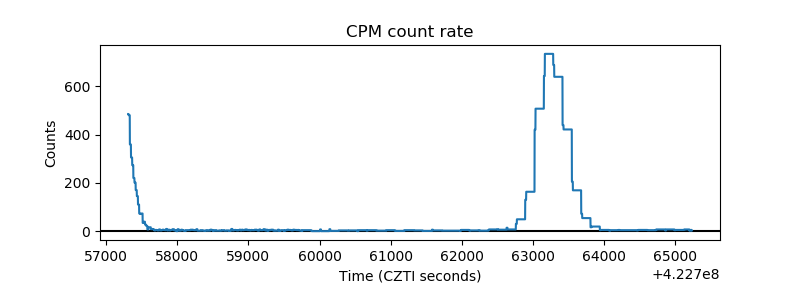 |
| CZT Counter | 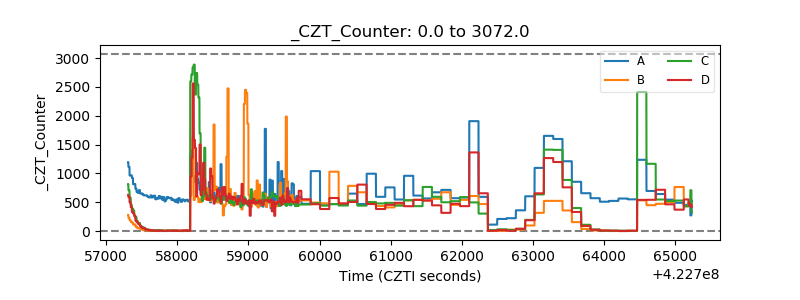 |
| +2.5 Volts monitor | 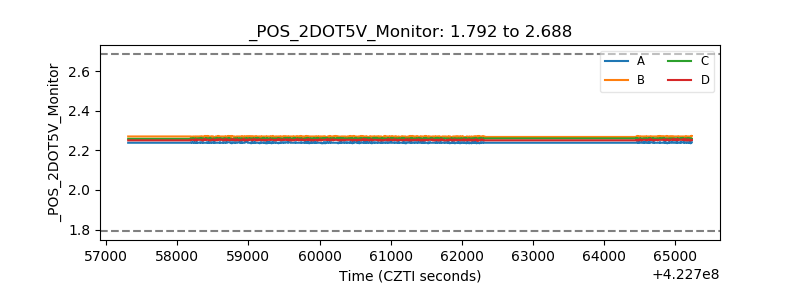 |
| +5 Volts monitor | 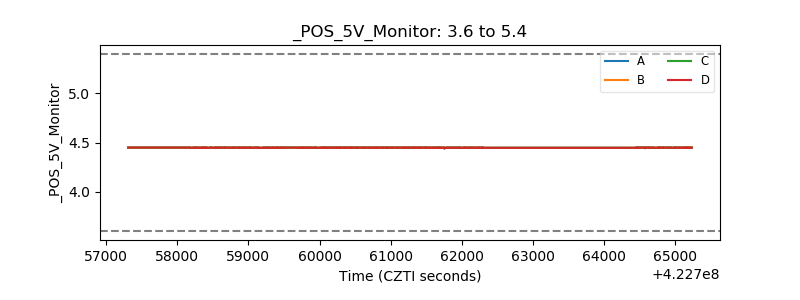 |
| _ROLL_ROT | 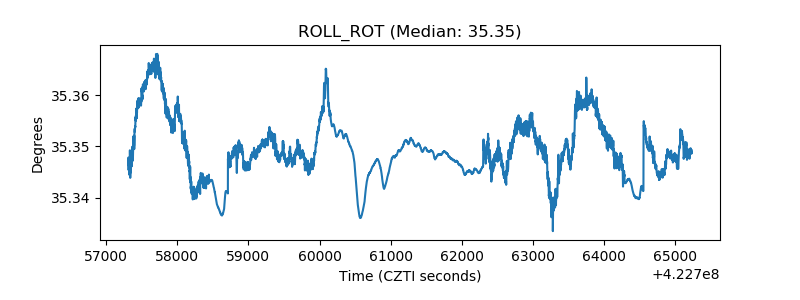 |
| _Roll_DEC | 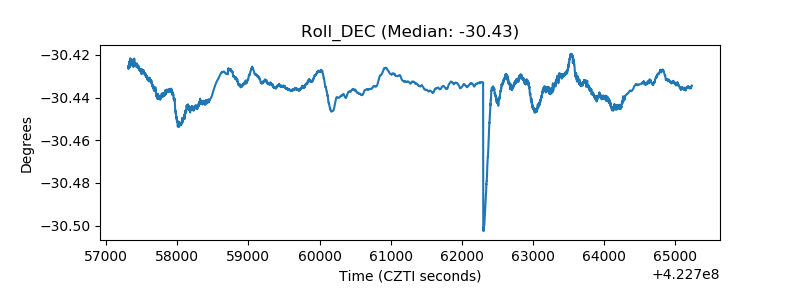 |
| _Roll_RA | 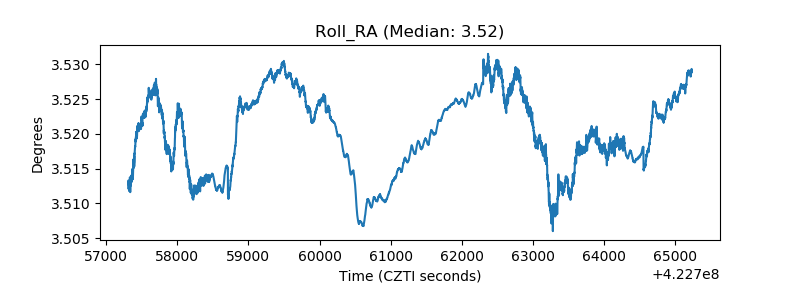 |
| Veto Counter | 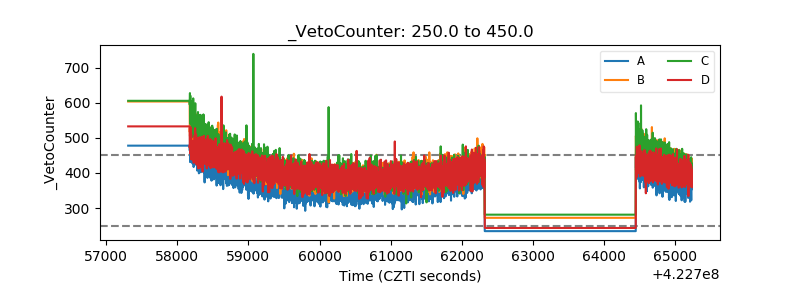 |