| Param | Original file | Final file |
|---|---|---|
| Filename | modeM0/AS1A12_035T01_9000005666_41404cztM0_level2.fits | modeM0/AS1A12_035T01_9000005666_41404cztM0_level2_quad_clean.evt |
| Size (bytes) | 311,993,280 | 84,188,160 |
| Size | 297.5 MB | 80.3 MB |
| Events in quadrant A | 2,811,406 | 568,528 |
| Events in quadrant B | 2,740,828 | 573,827 |
| Events in quadrant C | 2,992,530 | 536,758 |
| Events in quadrant D | 2,613,768 | 518,599 |
| Mode M0 | |||
|---|---|---|---|
| Quadrant | BADHDUFLAG | Total packets | Discarded packets |
| A | 0 | 11459 | 3 |
| B | 0 | 11633 | 2 |
| C | 0 | 11859 | 2 |
| D | 0 | 11227 | 2 |
| Mode SS | |||
|---|---|---|---|
| Quadrant | BADHDUFLAG | Total packets | Discarded packets |
| A | 0 | 106 | 0 |
| B | 0 | 106 | 0 |
| C | 0 | 106 | 0 |
| D | 0 | 106 | 0 |
| Mode M9 | |||
|---|---|---|---|
| Quadrant | BADHDUFLAG | Total packets | Discarded packets |
| A | 0 | 42 | 0 |
| B | 0 | 42 | 0 |
| C | 0 | 42 | 0 |
| D | 0 | 42 | 0 |
| Quadrant | Total seconds | Saturated seconds | Saturation percentage |
|---|---|---|---|
| A | 5008 | 14 | 0.279553% |
| B | 5008 | 127 | 2.535942% |
| C | 5008 | 254 | 5.071885% |
| D | 5008 | 52 | 1.038339% |
Noise dominated data is calculated using 1-second bins in cleaned event files. If a bin has >2000 counts, and if more than 50% of those come from <1% of pixels, then it is considered to be noise-dominated and hence unusable.
| Quadrant | # 1 sec bins | Bins with >0 counts | Bins with >2000 counts | High rate bins dominated by noise | Noise dominated (total time) | Noise dominated (detector-on time) | Marked lightcurve |
|---|---|---|---|---|---|---|---|
| A | 9223 | 5010 | 7 | 7 | 0.08% | 0.14% | 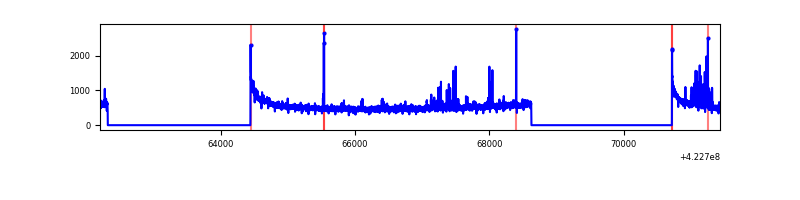 |
| B | 9223 | 5010 | 82 | 82 | 0.89% | 1.64% | 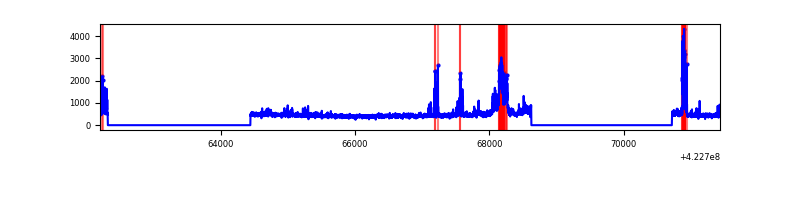 |
| C | 9223 | 5010 | 244 | 244 | 2.65% | 4.87% | 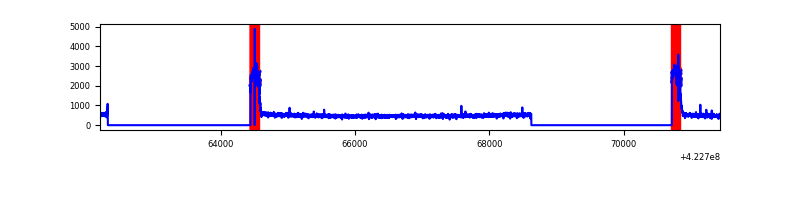 |
| D | 9223 | 5010 | 35 | 35 | 0.38% | 0.70% | 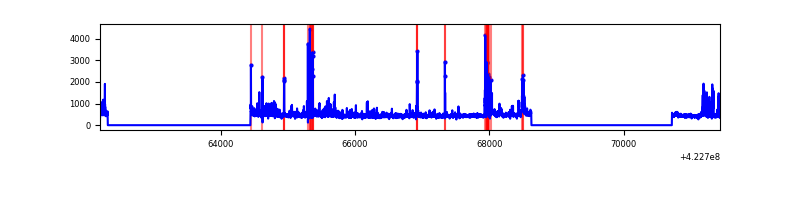 |
Top three noisy pixels from each quadrant. If the there are fewer than three noisy pixels in the level2.evt file, extra rows are filled as -1
| Pixel properties | Quadrant properties | ||||||
|---|---|---|---|---|---|---|---|
| Quadrant | DetID | PixID | Counts | Sigma | Mean | Median | Sigma |
| A | 10 | 83 | 490521 | 4283.78 | 557 | 546 | 114.4 |
| A | 13 | 248 | 122657 | 1067.6 | 557 | 546 | 114.4 |
| A | 12 | 189 | 31644 | 271.89 | 557 | 546 | 114.4 |
| B | 5 | 255 | 501826 | 4710.14 | 549 | 535 | 106.4 |
| B | 0 | 190 | 55448 | 515.96 | 549 | 535 | 106.4 |
| B | 0 | 229 | 20706 | 189.53 | 549 | 535 | 106.4 |
| C | 0 | 10 | 681492 | 5443.74 | 534 | 537 | 125.1 |
| C | 15 | 214 | 222431 | 1773.88 | 534 | 537 | 125.1 |
| C | 13 | 61 | 3537 | 23.98 | 534 | 537 | 125.1 |
| D | 1 | 52 | 279505 | 2069.56 | 551 | 537 | 134.8 |
| D | 13 | 249 | 157656 | 1165.61 | 551 | 537 | 134.8 |
| D | 12 | 79 | 41125 | 301.11 | 551 | 537 | 134.8 |
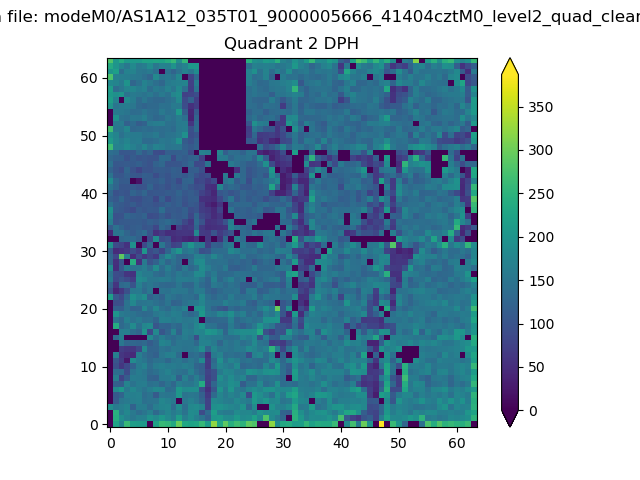
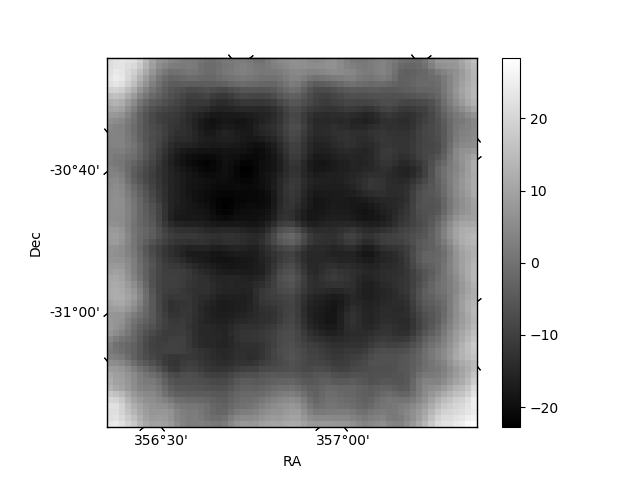
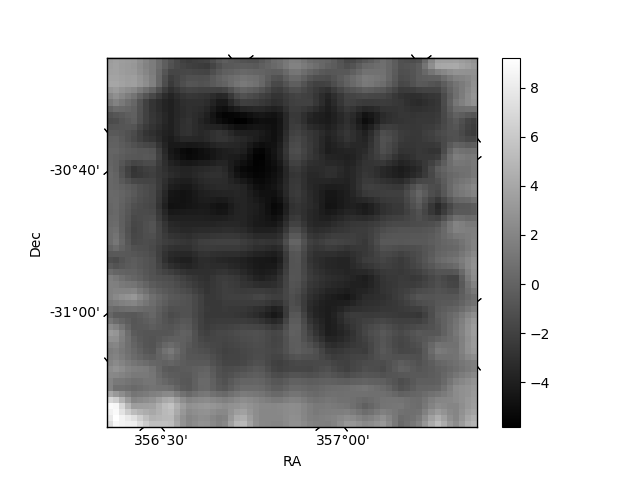
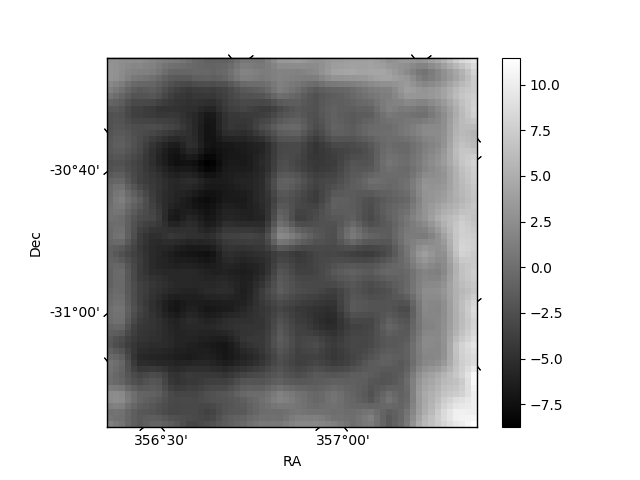
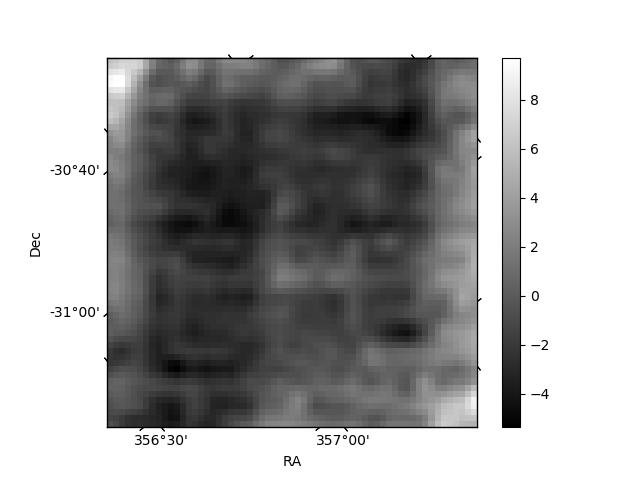
Histogram calculated using DETX and DETY for each event in the final _common_clean file
| Quadrant A | 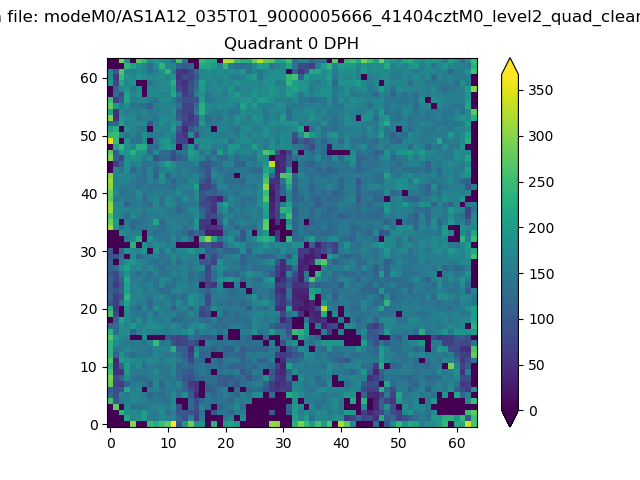 |
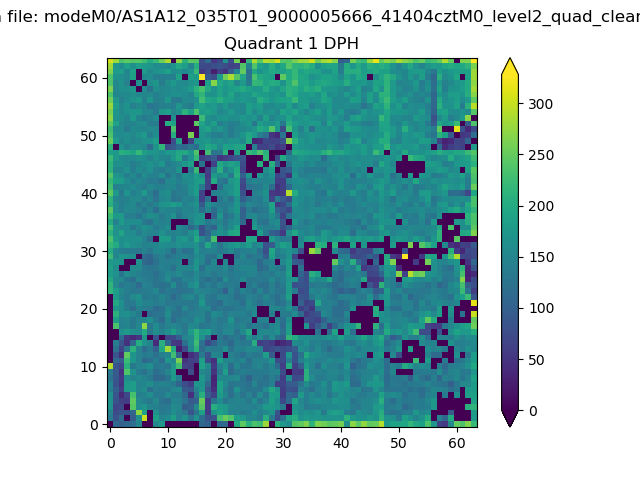 |
Quadrant B |
|---|---|---|---|
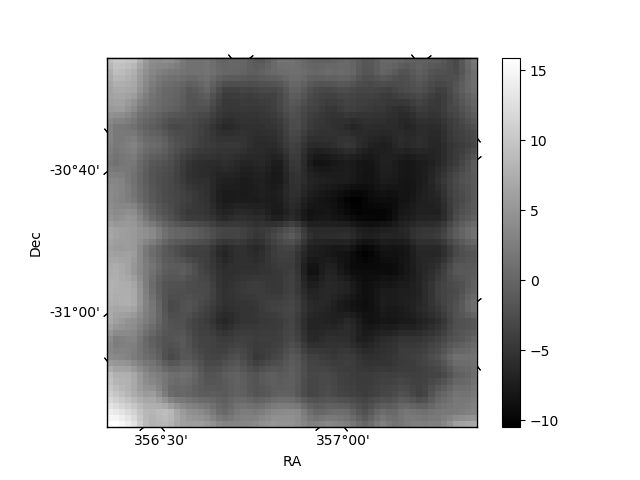
| Quadrant D | 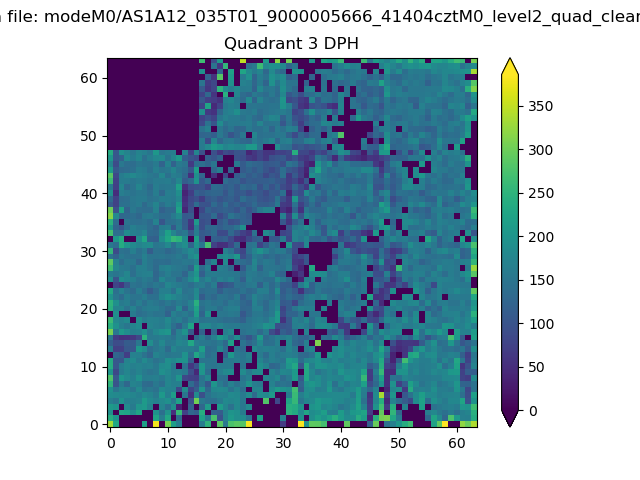 |
 |
Quadrant C |
| Plot type | Count rate plots | Images |
|---|---|---|
| Comparison with Poisson distribution Blue bars denote a histogram of data divided into 1 sec bins. Red curve is a Poisson curve with rate = median count rate of data. |
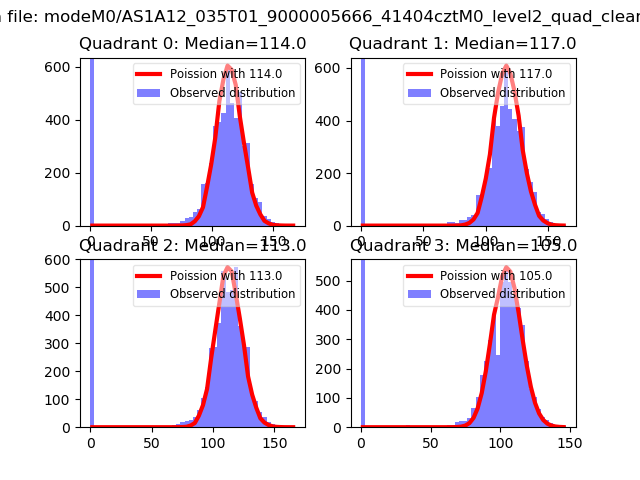 |
 |
| Quadrant-wise count rates Data is divided into 100 sec bins |
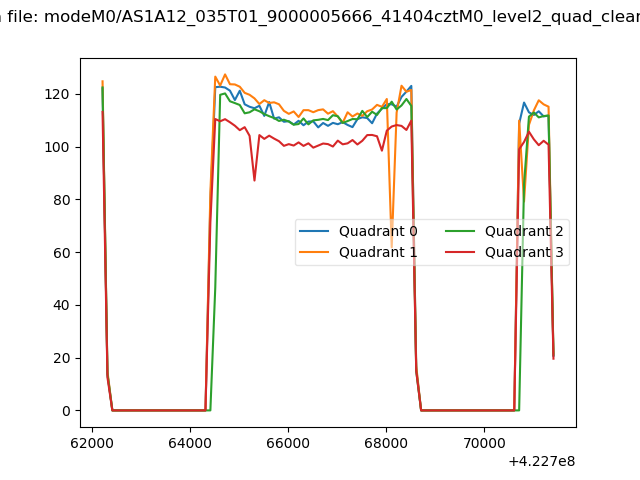 |
|
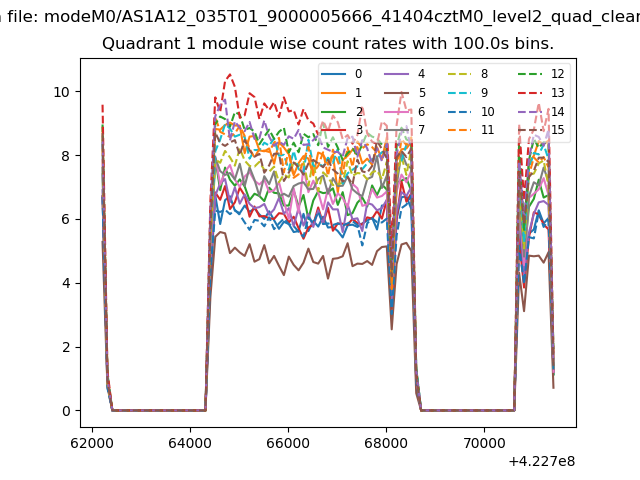
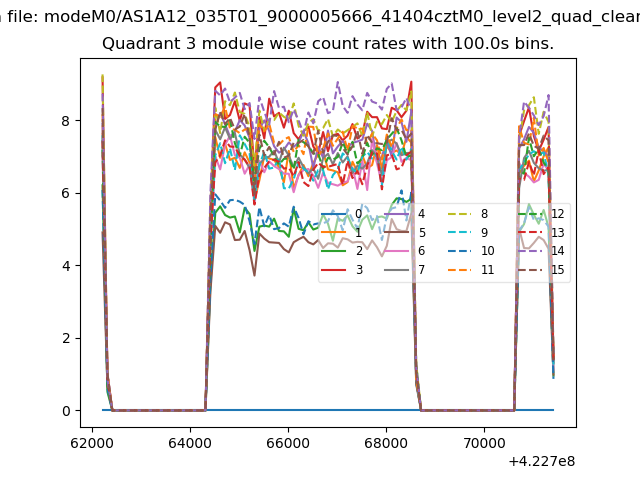
| Module-wise count rates for Quadrant A Data is divided into 100 sec bins |
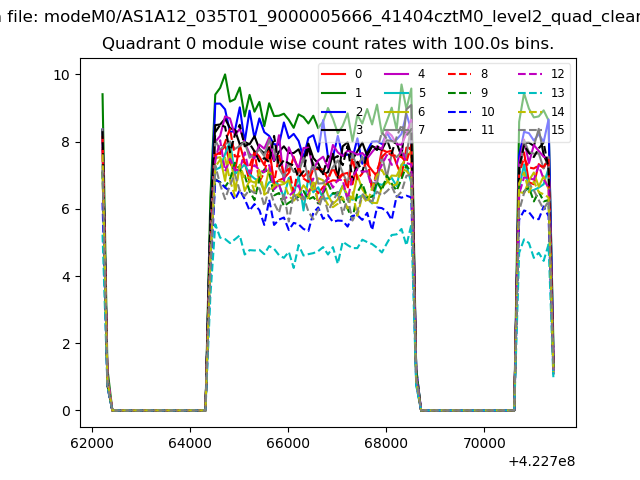 |
 |
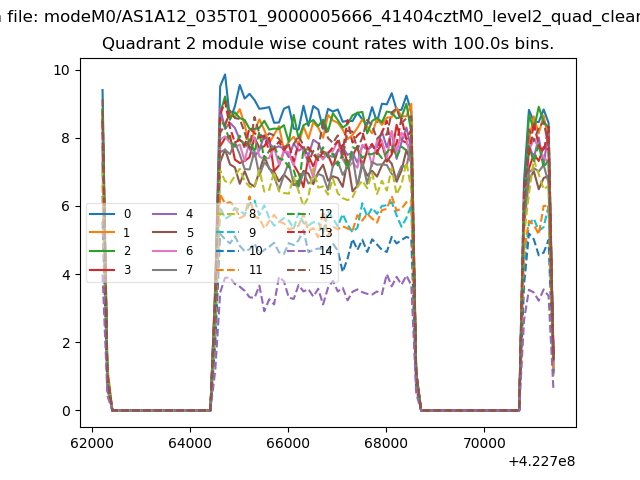
| Module-wise count rates for Quadrant B Data is divided into 100 sec bins |
 |
 |
| Module-wise count rates for Quadrant C Data is divided into 100 sec bins |
 |
 |
| Module-wise count rates for Quadrant D Data is divided into 100 sec bins |
 |
 |
| Parameter | Plot |
|---|---|
| CZT HV Monitor | 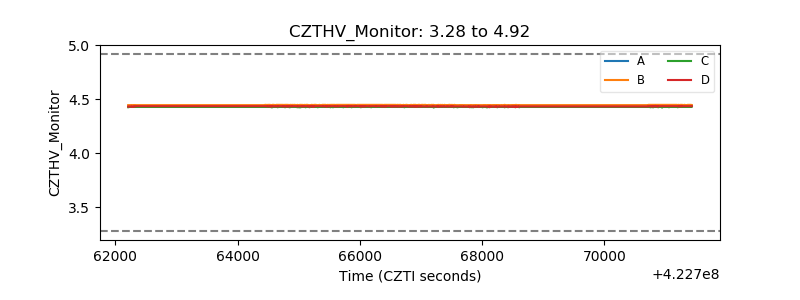 |
| D_VDD | 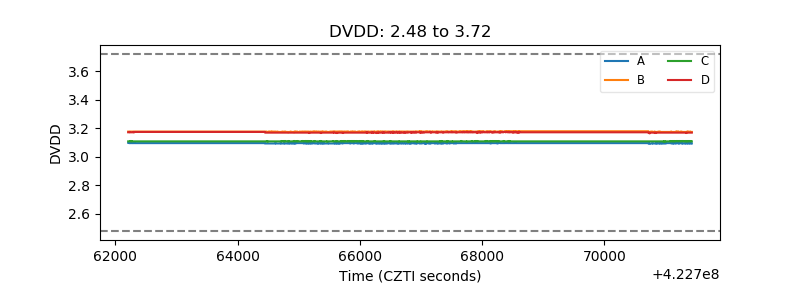 |
| Temperature 1 | 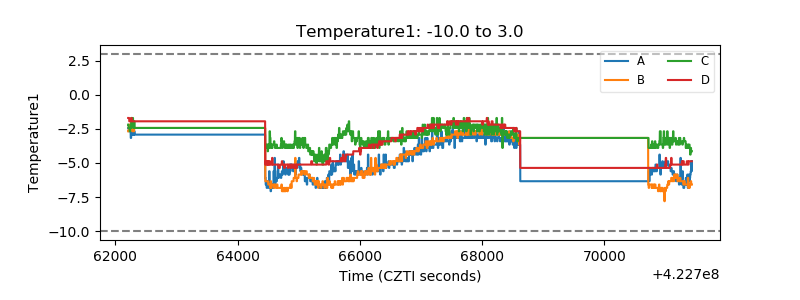 |
| Veto HV Monitor | 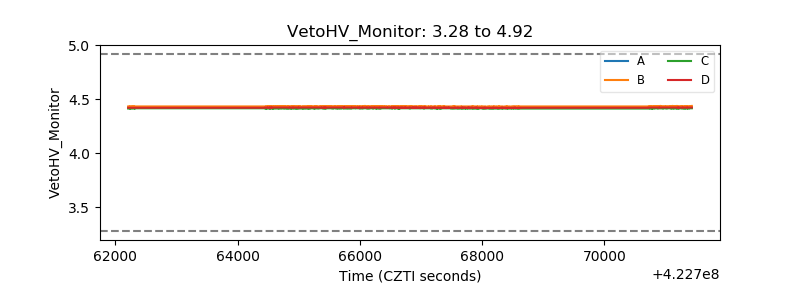 |
| Veto LLD | 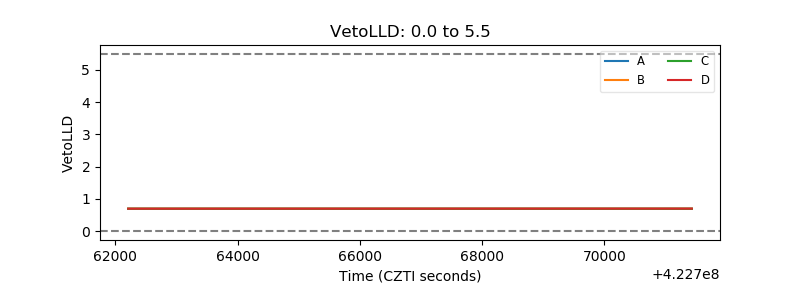 |
| Alpha Counter | 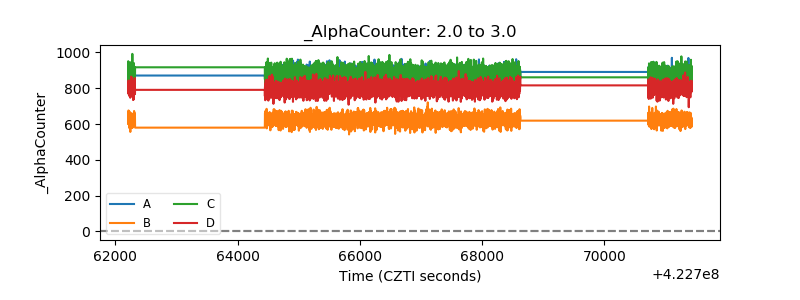 |
| _CPM_Rate | 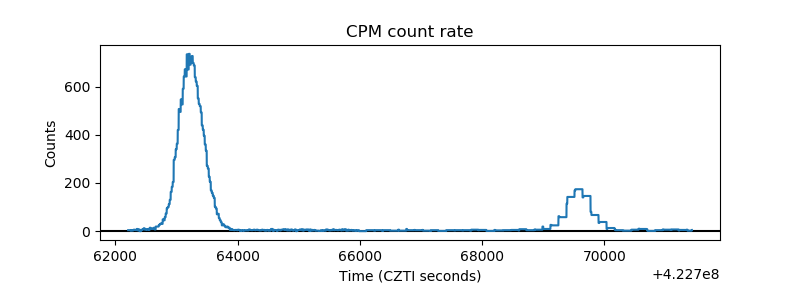 |
| CZT Counter | 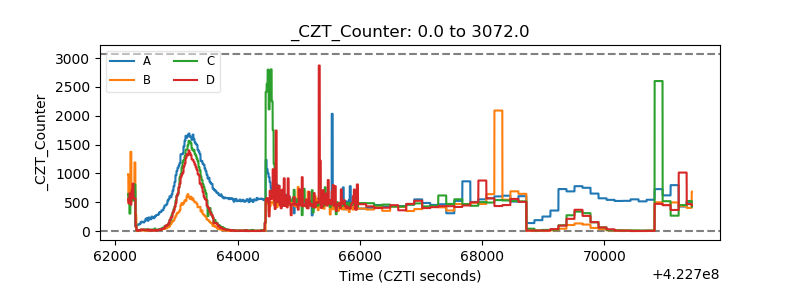 |
| +2.5 Volts monitor | 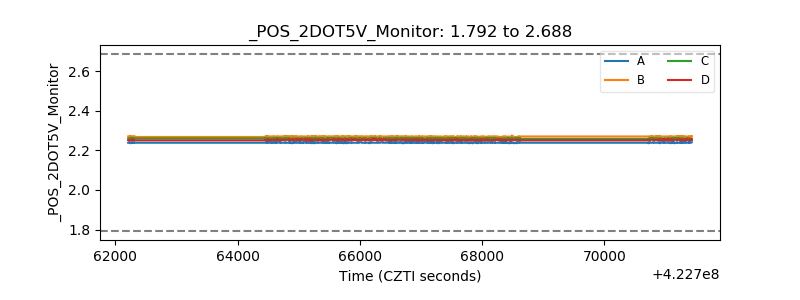 |
| +5 Volts monitor | 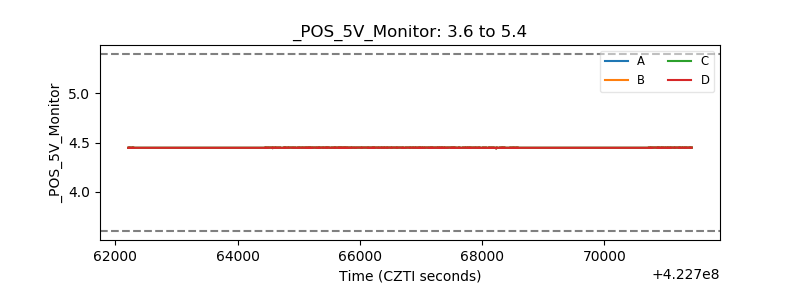 |
| _ROLL_ROT | 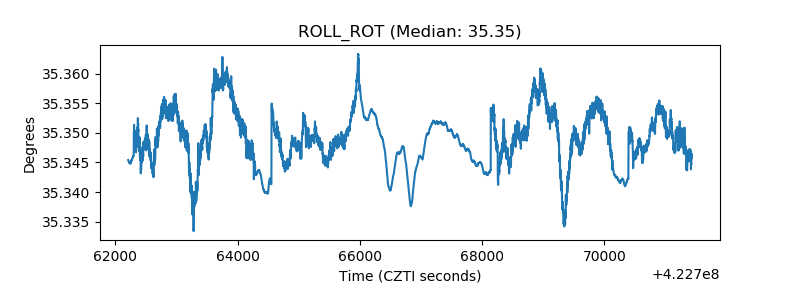 |
| _Roll_DEC | 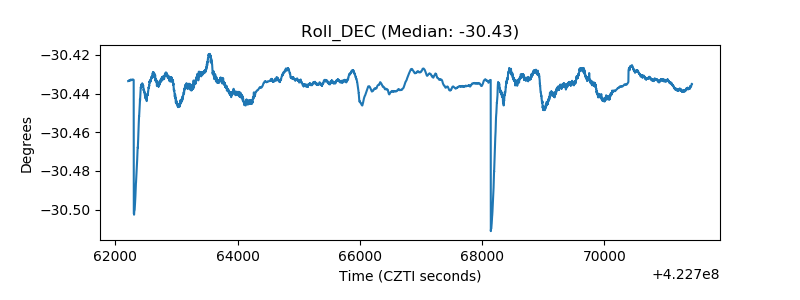 |
| _Roll_RA | 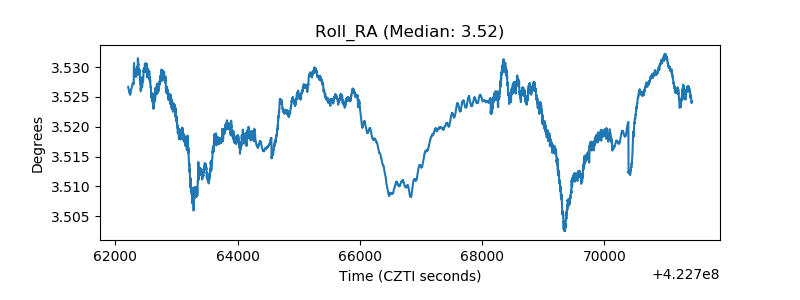 |
| Veto Counter | 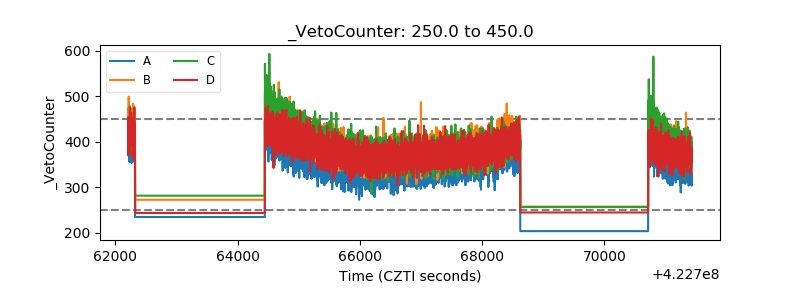 |