| Param | Original file | Final file |
|---|---|---|
| Filename | modeM0/AS1A12_035T01_9000005666_41405cztM0_level2.fits | modeM0/AS1A12_035T01_9000005666_41405cztM0_level2_quad_clean.evt |
| Size (bytes) | 317,756,160 | 83,698,560 |
| Size | 303.0 MB | 79.8 MB |
| Events in quadrant A | 3,125,755 | 558,863 |
| Events in quadrant B | 2,577,250 | 571,463 |
| Events in quadrant C | 2,989,618 | 531,321 |
| Events in quadrant D | 2,670,339 | 513,602 |
| Mode M0 | |||
|---|---|---|---|
| Quadrant | BADHDUFLAG | Total packets | Discarded packets |
| A | 0 | 12400 | 3 |
| B | 0 | 11102 | 2 |
| C | 0 | 12086 | 2 |
| D | 0 | 11483 | 2 |
| Mode SS | |||
|---|---|---|---|
| Quadrant | BADHDUFLAG | Total packets | Discarded packets |
| A | 0 | 104 | 0 |
| B | 0 | 104 | 0 |
| C | 0 | 104 | 0 |
| D | 0 | 104 | 0 |
| Mode M9 | |||
|---|---|---|---|
| Quadrant | BADHDUFLAG | Total packets | Discarded packets |
| A | 0 | 29 | 0 |
| B | 0 | 29 | 0 |
| C | 0 | 29 | 0 |
| D | 0 | 30 | 0 |
| Quadrant | Total seconds | Saturated seconds | Saturation percentage |
|---|---|---|---|
| A | 5124 | 41 | 0.800156% |
| B | 5124 | 51 | 0.995316% |
| C | 5124 | 254 | 4.957065% |
| D | 5124 | 33 | 0.644028% |
Noise dominated data is calculated using 1-second bins in cleaned event files. If a bin has >2000 counts, and if more than 50% of those come from <1% of pixels, then it is considered to be noise-dominated and hence unusable.
| Quadrant | # 1 sec bins | Bins with >0 counts | Bins with >2000 counts | High rate bins dominated by noise | Noise dominated (total time) | Noise dominated (detector-on time) | Marked lightcurve |
|---|---|---|---|---|---|---|---|
| A | 7006 | 5125 | 37 | 37 | 0.53% | 0.72% | 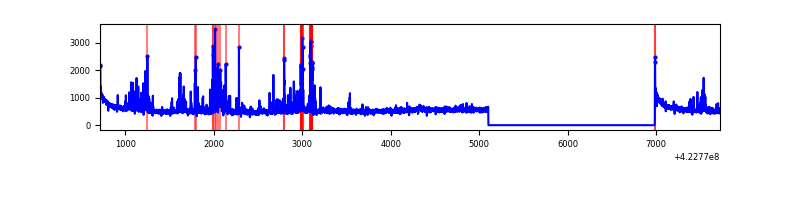 |
| B | 7006 | 5125 | 30 | 30 | 0.43% | 0.59% | 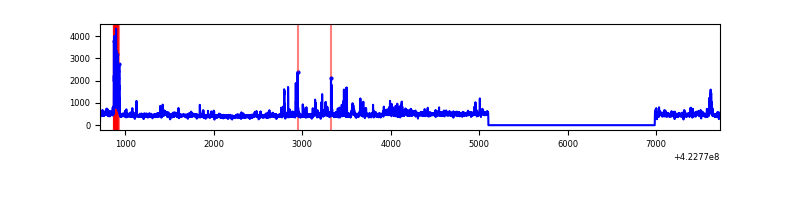 |
| C | 7006 | 5125 | 241 | 241 | 3.44% | 4.70% | 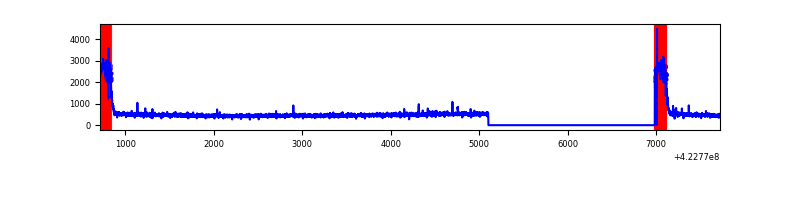 |
| D | 7006 | 5125 | 26 | 26 | 0.37% | 0.51% | 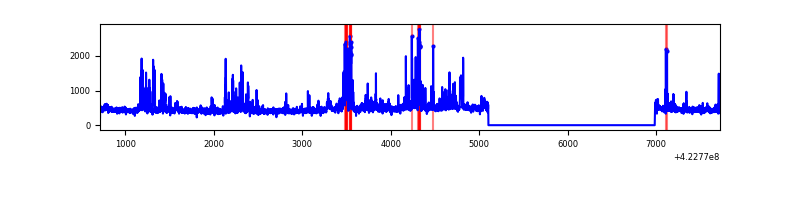 |
Top three noisy pixels from each quadrant. If the there are fewer than three noisy pixels in the level2.evt file, extra rows are filled as -1
| Pixel properties | Quadrant properties | ||||||
|---|---|---|---|---|---|---|---|
| Quadrant | DetID | PixID | Counts | Sigma | Mean | Median | Sigma |
| A | 10 | 83 | 511274 | 4474.58 | 560 | 549 | 114.1 |
| A | 13 | 248 | 364199 | 3186.02 | 560 | 549 | 114.1 |
| A | 12 | 189 | 50099 | 434.12 | 560 | 549 | 114.1 |
| B | 5 | 255 | 277777 | 2543.26 | 554 | 539 | 109.0 |
| B | 0 | 190 | 63018 | 573.15 | 554 | 539 | 109.0 |
| B | 0 | 229 | 44269 | 401.16 | 554 | 539 | 109.0 |
| C | 0 | 10 | 670529 | 5340.45 | 533 | 536 | 125.5 |
| C | 15 | 214 | 226368 | 1800.09 | 533 | 536 | 125.5 |
| C | 0 | 15 | 9274 | 69.65 | 533 | 536 | 125.5 |
| D | 2 | 120 | 138481 | 1010.52 | 553 | 536 | 136.5 |
| D | 13 | 249 | 126110 | 919.89 | 553 | 536 | 136.5 |
| D | 2 | 249 | 112264 | 818.46 | 553 | 536 | 136.5 |
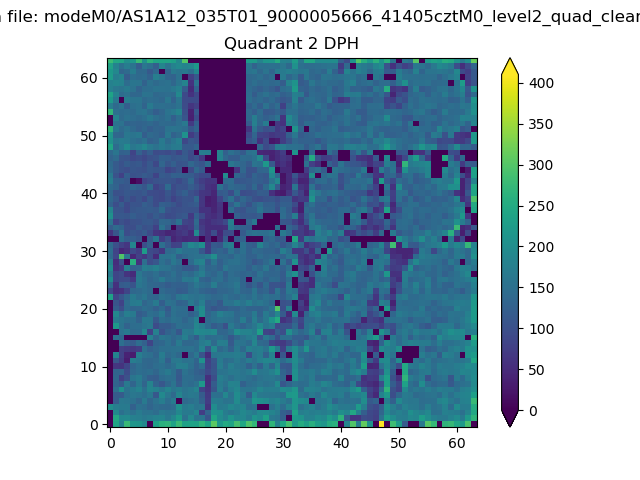
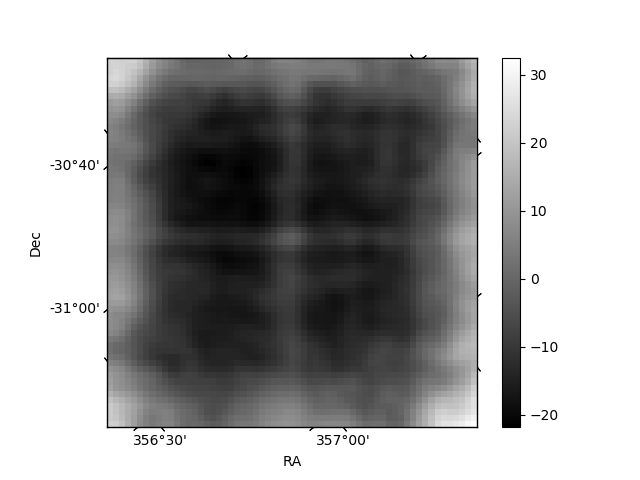
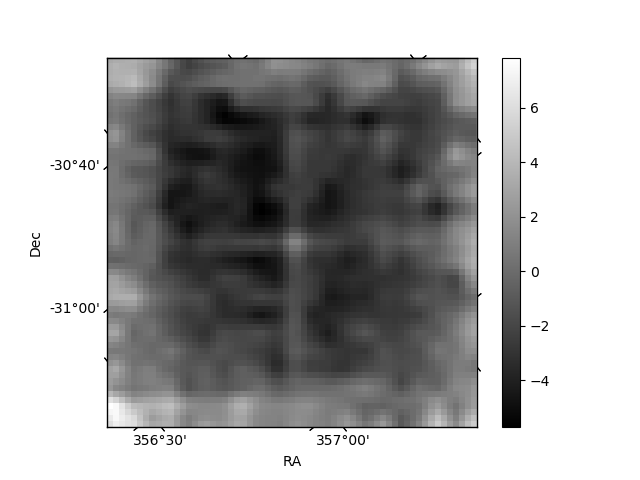
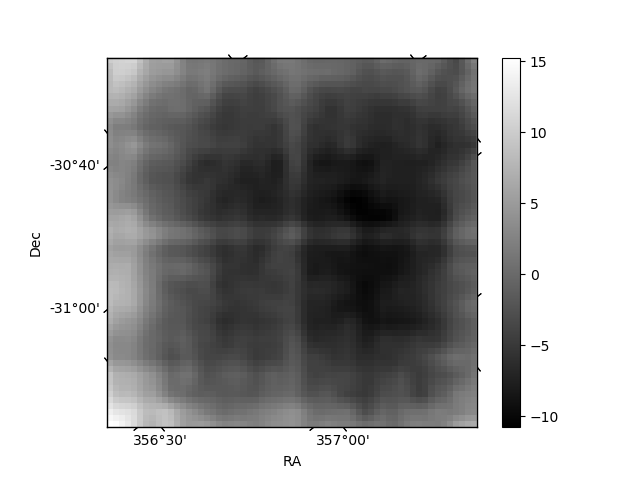
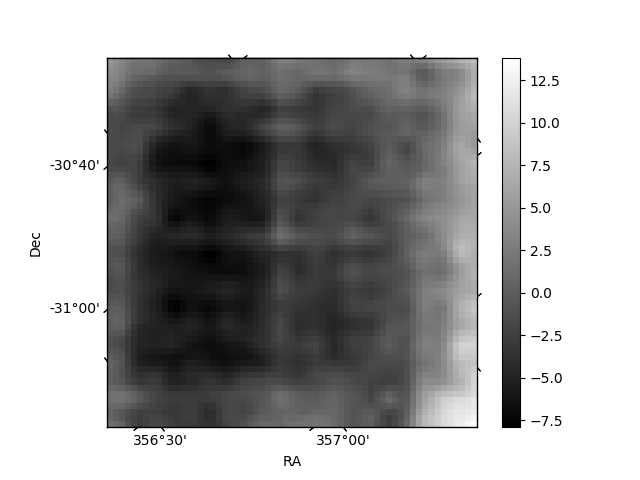
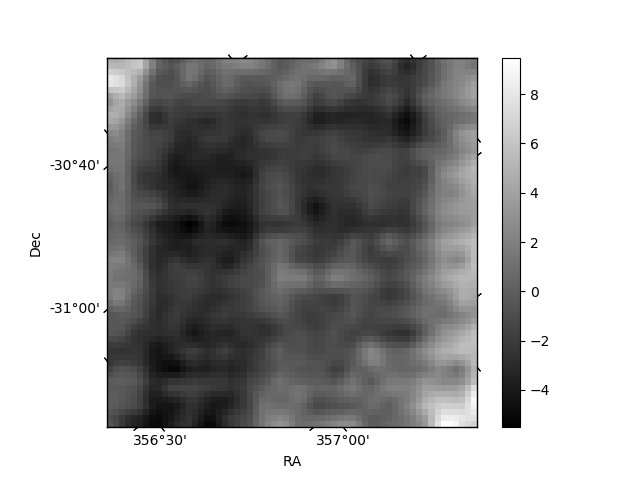
Histogram calculated using DETX and DETY for each event in the final _common_clean file
| Quadrant A | 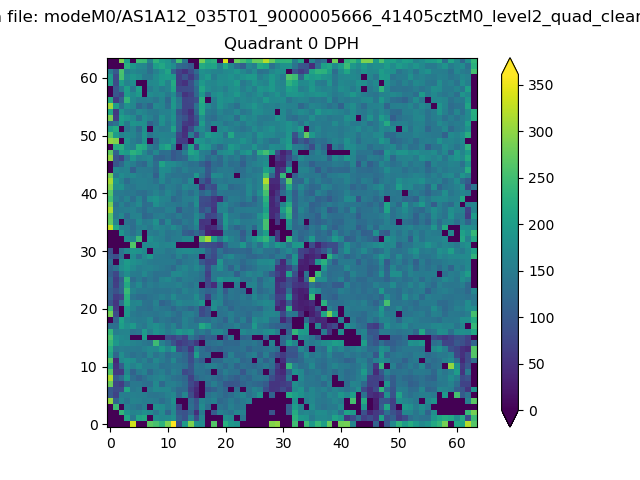 |
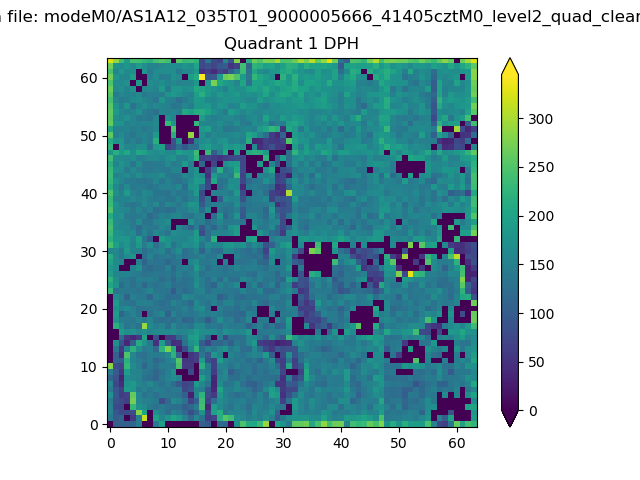 |
Quadrant B |
|---|---|---|---|
| Quadrant D | 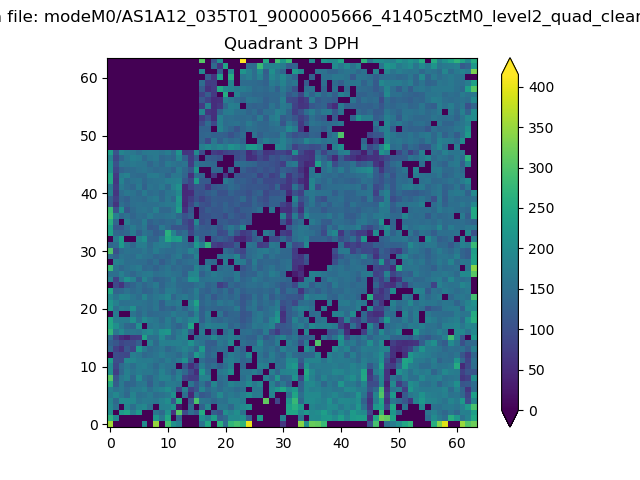 |
 |
Quadrant C |
| Plot type | Count rate plots | Images |
|---|---|---|
| Comparison with Poisson distribution Blue bars denote a histogram of data divided into 1 sec bins. Red curve is a Poisson curve with rate = median count rate of data. |
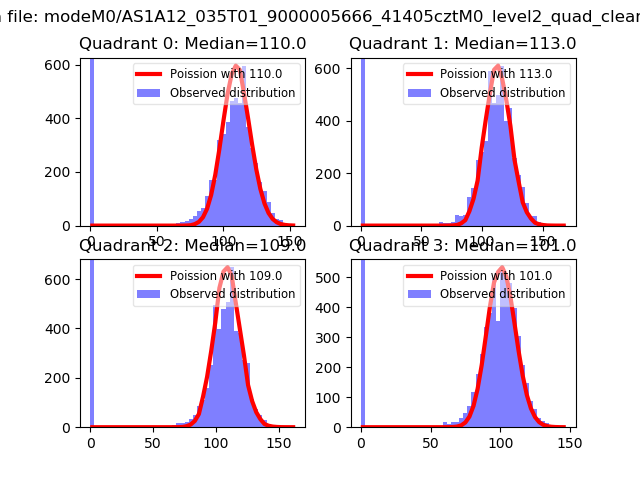 |
 |
| Quadrant-wise count rates Data is divided into 100 sec bins |
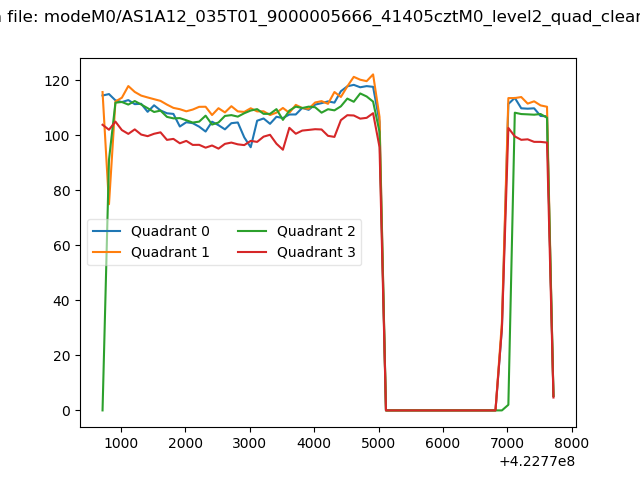 |
|
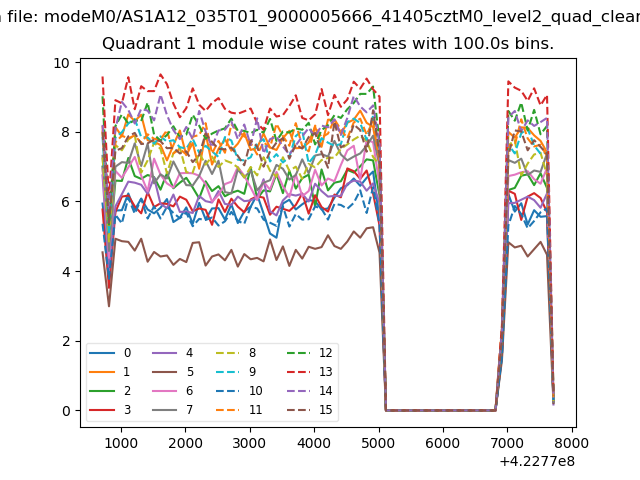
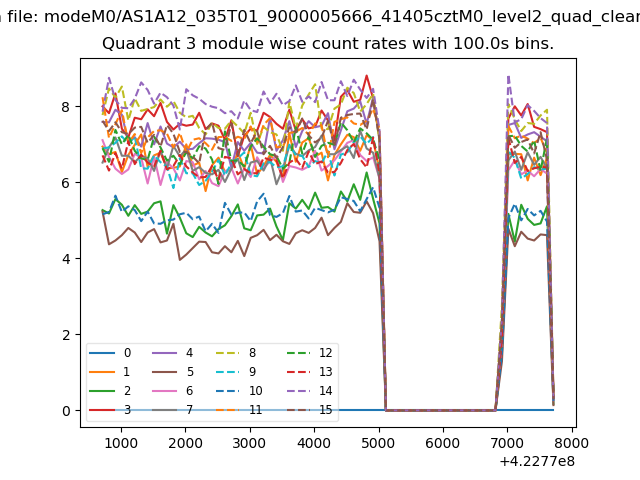
| Module-wise count rates for Quadrant A Data is divided into 100 sec bins |
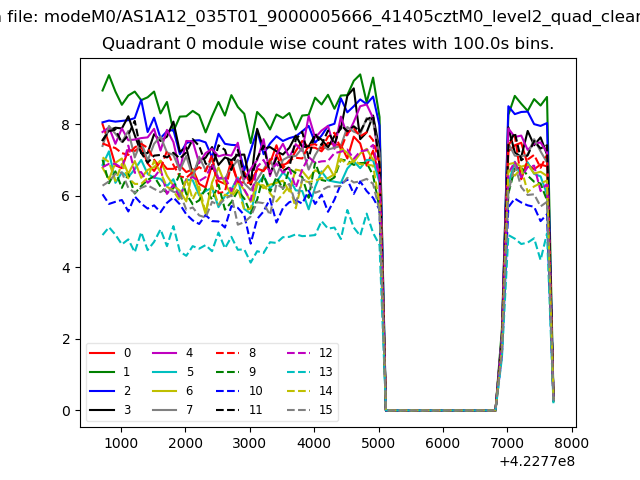 |
 |
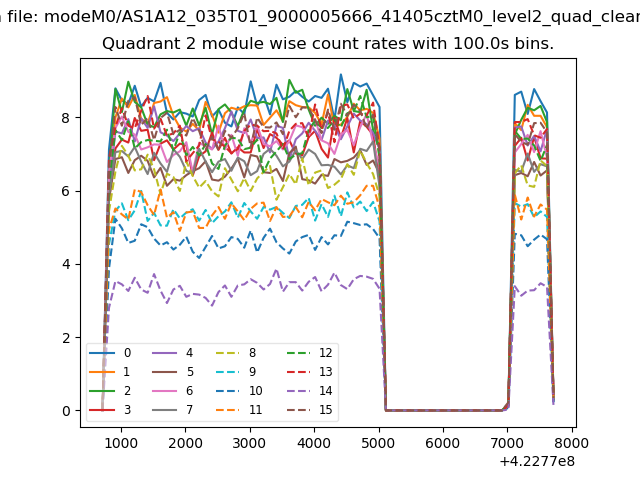
| Module-wise count rates for Quadrant B Data is divided into 100 sec bins |
 |
 |
| Module-wise count rates for Quadrant C Data is divided into 100 sec bins |
 |
 |
| Module-wise count rates for Quadrant D Data is divided into 100 sec bins |
 |
 |
| Parameter | Plot |
|---|---|
| CZT HV Monitor | 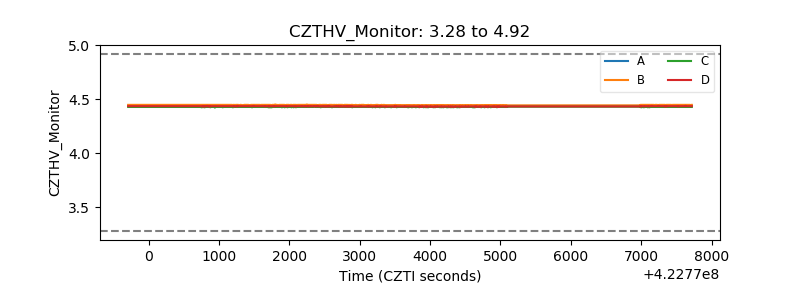 |
| D_VDD | 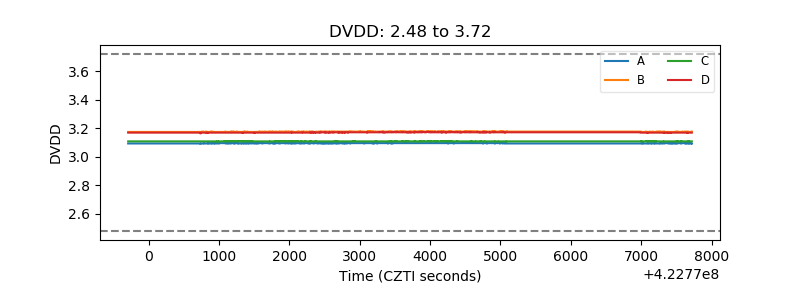 |
| Temperature 1 | 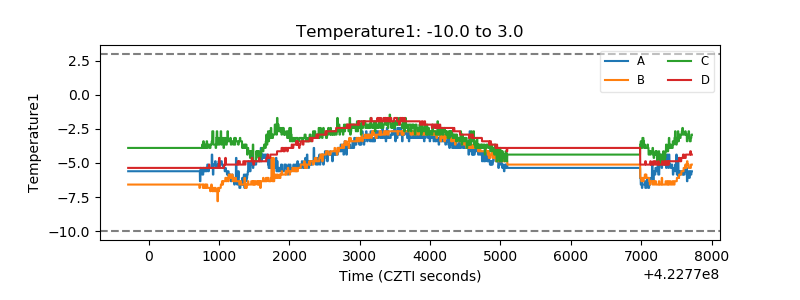 |
| Veto HV Monitor | 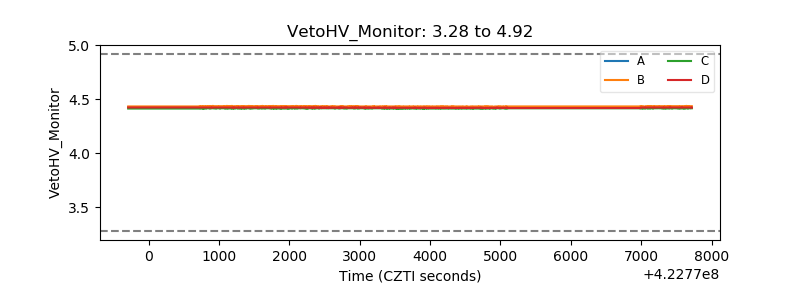 |
| Veto LLD | 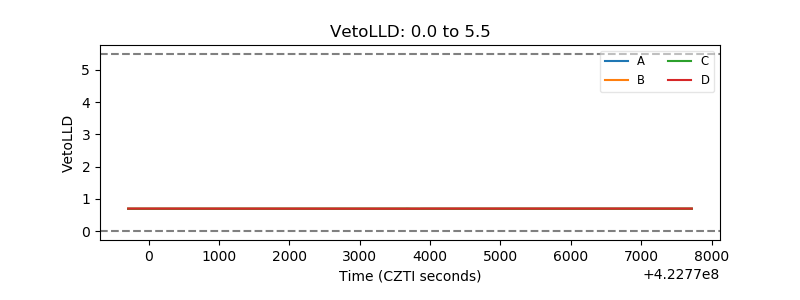 |
| Alpha Counter |  |
| _CPM_Rate | 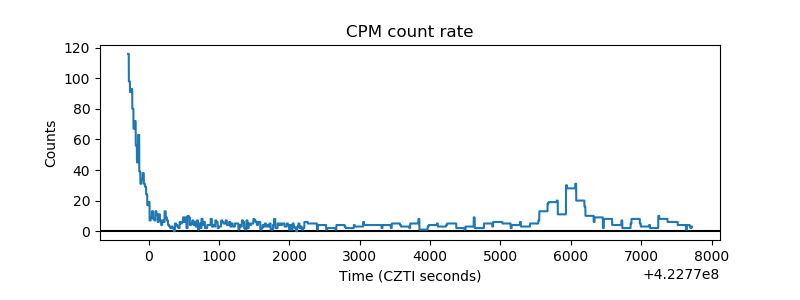 |
| CZT Counter | 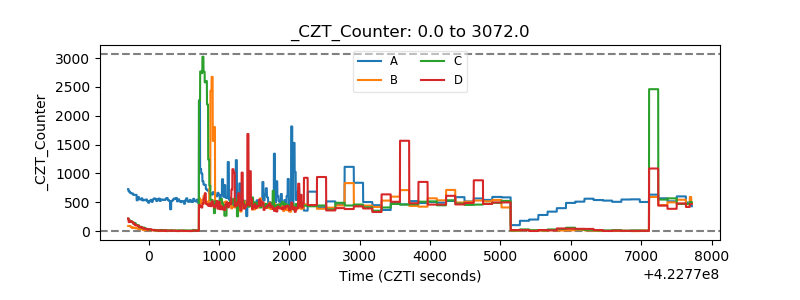 |
| +2.5 Volts monitor | 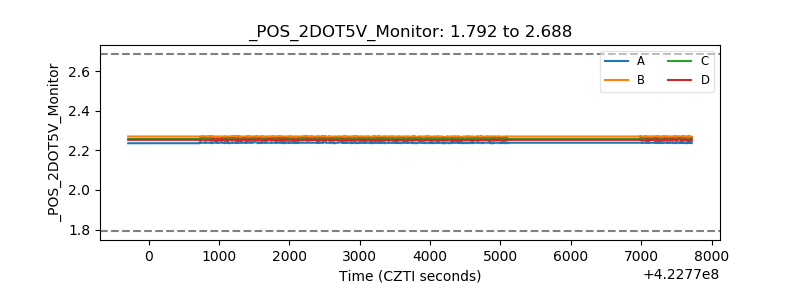 |
| +5 Volts monitor |  |
| _ROLL_ROT | 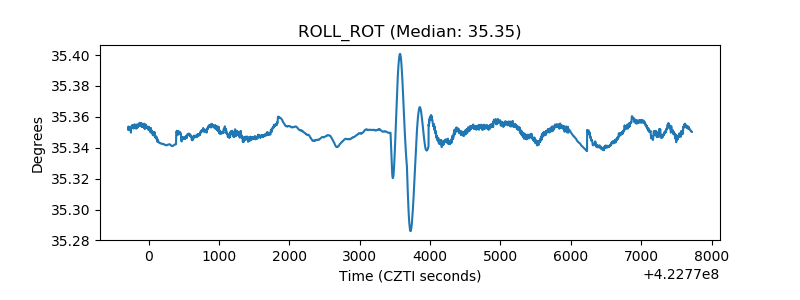 |
| _Roll_DEC | 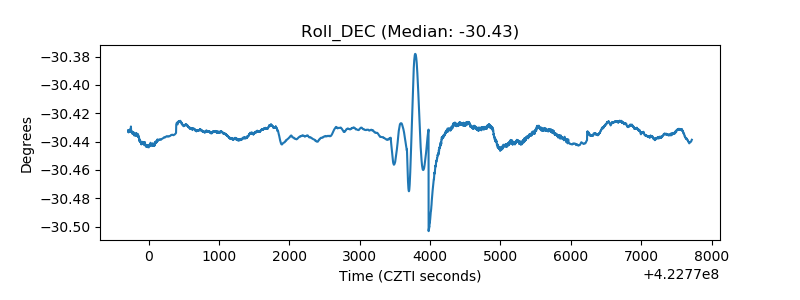 |
| _Roll_RA | 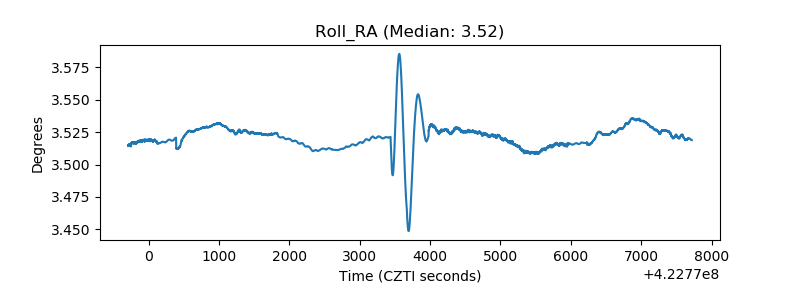 |
| Veto Counter | 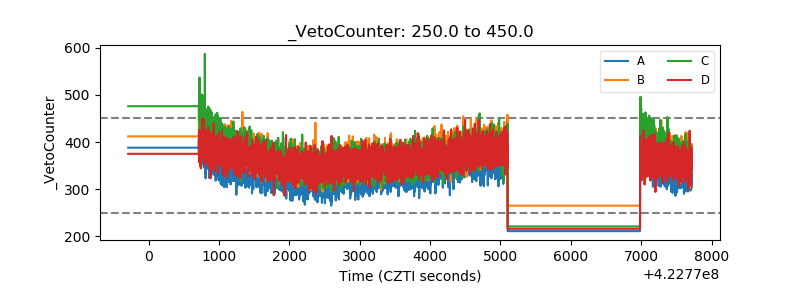 |