| Param | Original file | Final file |
|---|---|---|
| Filename | modeM0/AS1A12_035T01_9000005666_41406cztM0_level2.fits | modeM0/AS1A12_035T01_9000005666_41406cztM0_level2_quad_clean.evt |
| Size (bytes) | 631,506,240 | 151,099,200 |
| Size | 602.3 MB | 144.1 MB |
| Events in quadrant A | 5,400,551 | 1,030,546 |
| Events in quadrant B | 7,298,222 | 928,247 |
| Events in quadrant C | 5,019,665 | 1,004,870 |
| Events in quadrant D | 4,915,288 | 948,532 |
| Mode M0 | |||
|---|---|---|---|
| Quadrant | BADHDUFLAG | Total packets | Discarded packets |
| A | 0 | 21660 | 3 |
| B | 0 | 28051 | 2 |
| C | 0 | 20953 | 2 |
| D | 0 | 21262 | 2 |
| Mode SS | |||
|---|---|---|---|
| Quadrant | BADHDUFLAG | Total packets | Discarded packets |
| A | 0 | 194 | 0 |
| B | 0 | 194 | 0 |
| C | 0 | 194 | 0 |
| D | 0 | 194 | 0 |
| Mode M9 | |||
|---|---|---|---|
| Quadrant | BADHDUFLAG | Total packets | Discarded packets |
| A | 0 | 35 | 0 |
| B | 0 | 35 | 0 |
| C | 0 | 35 | 0 |
| D | 0 | 35 | 0 |
| Quadrant | Total seconds | Saturated seconds | Saturation percentage |
|---|---|---|---|
| A | 9565 | 47 | 0.491375% |
| B | 9565 | 1263 | 13.204391% |
| C | 9565 | 238 | 2.488238% |
| D | 9565 | 52 | 0.543649% |
Noise dominated data is calculated using 1-second bins in cleaned event files. If a bin has >2000 counts, and if more than 50% of those come from <1% of pixels, then it is considered to be noise-dominated and hence unusable.
| Quadrant | # 1 sec bins | Bins with >0 counts | Bins with >2000 counts | High rate bins dominated by noise | Noise dominated (total time) | Noise dominated (detector-on time) | Marked lightcurve |
|---|---|---|---|---|---|---|---|
| A | 12999 | 9567 | 43 | 43 | 0.33% | 0.45% | 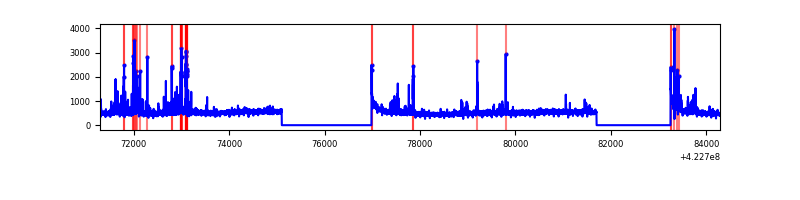 |
| B | 12999 | 9567 | 992 | 992 | 7.63% | 10.37% | 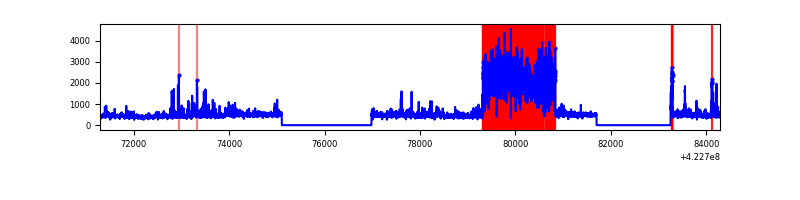 |
| C | 12999 | 9567 | 224 | 224 | 1.72% | 2.34% | 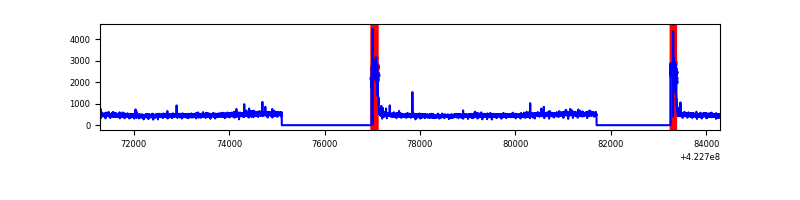 |
| D | 12999 | 9567 | 39 | 39 | 0.30% | 0.41% | 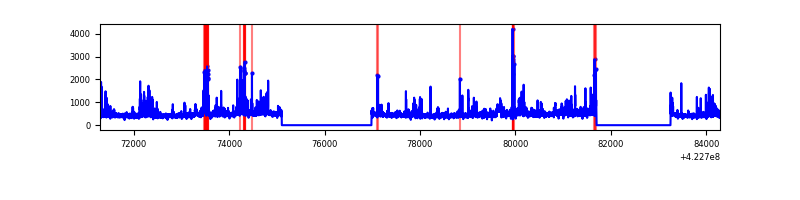 |
Top three noisy pixels from each quadrant. If the there are fewer than three noisy pixels in the level2.evt file, extra rows are filled as -1
| Pixel properties | Quadrant properties | ||||||
|---|---|---|---|---|---|---|---|
| Quadrant | DetID | PixID | Counts | Sigma | Mean | Median | Sigma |
| A | 10 | 83 | 792506 | 3739.95 | 1046 | 1023 | 211.6 |
| A | 13 | 248 | 435958 | 2055.18 | 1046 | 1023 | 211.6 |
| A | 12 | 189 | 64127 | 298.18 | 1046 | 1023 | 211.6 |
| B | 5 | 255 | 3210748 | 16771.84 | 982 | 954 | 191.4 |
| B | 0 | 190 | 161830 | 840.61 | 982 | 954 | 191.4 |
| B | 0 | 229 | 49855 | 255.52 | 982 | 954 | 191.4 |
| C | 0 | 10 | 647633 | 2744.81 | 1008 | 1012 | 235.6 |
| C | 15 | 214 | 414611 | 1755.67 | 1008 | 1012 | 235.6 |
| C | 0 | 15 | 25164 | 102.52 | 1008 | 1012 | 235.6 |
| D | 2 | 120 | 257436 | 1008.04 | 1031 | 1000 | 254.4 |
| D | 13 | 249 | 181680 | 710.24 | 1031 | 1000 | 254.4 |
| D | 2 | 249 | 179096 | 700.09 | 1031 | 1000 | 254.4 |
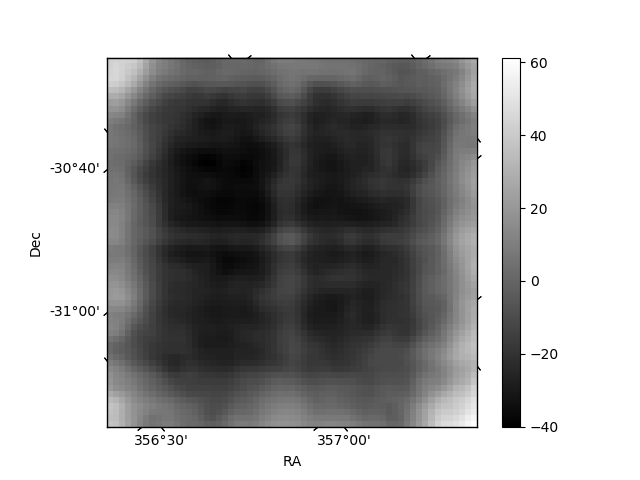
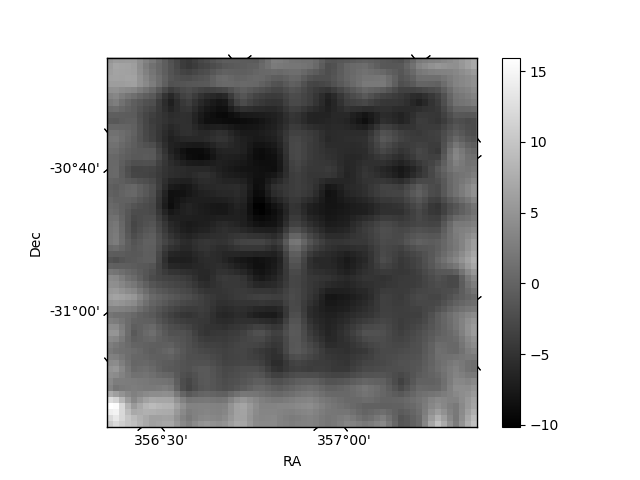
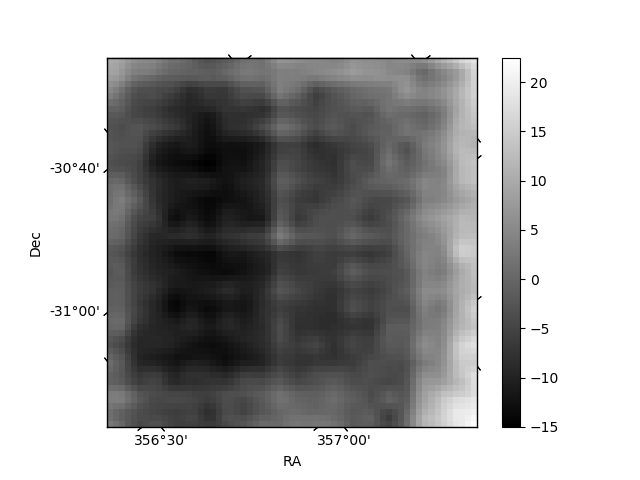
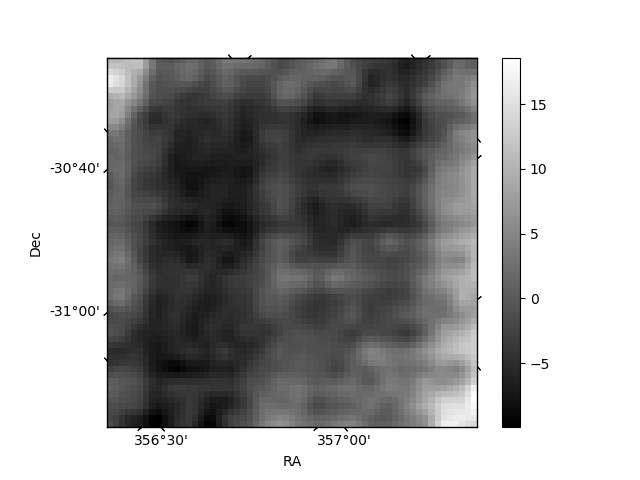
Histogram calculated using DETX and DETY for each event in the final _common_clean file
| Quadrant A | 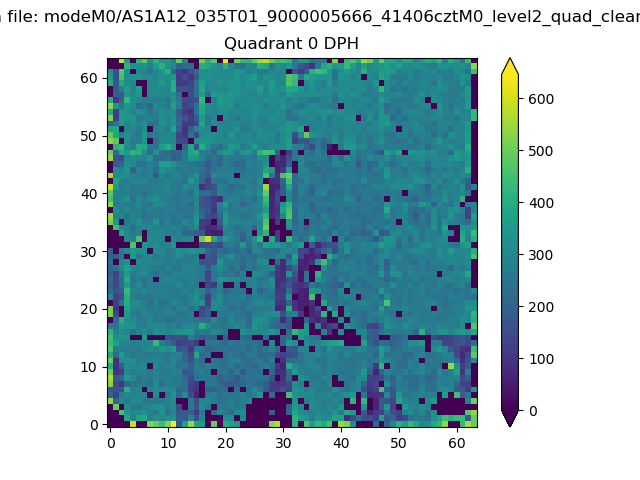 |
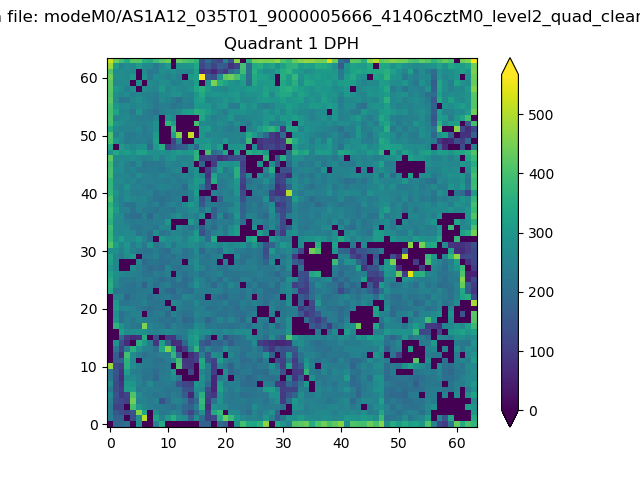 |
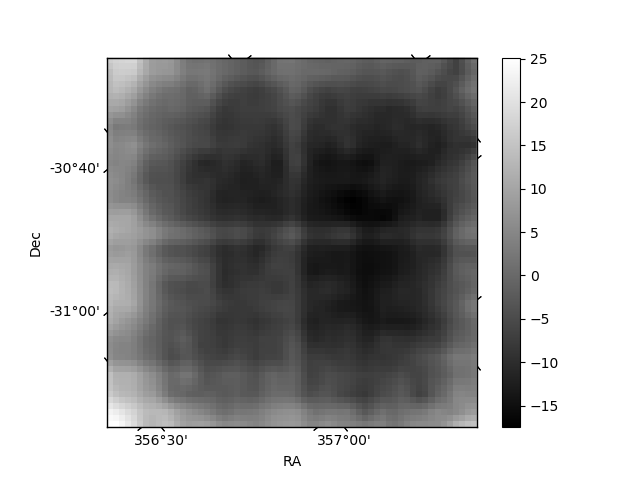
Quadrant B |
|---|---|---|---|
| Quadrant D | 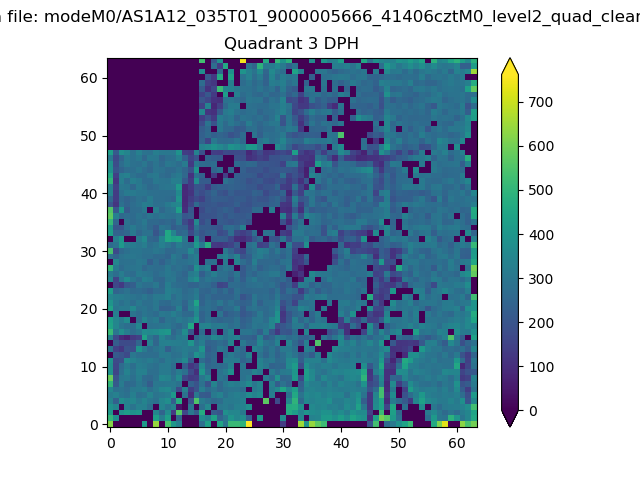 |
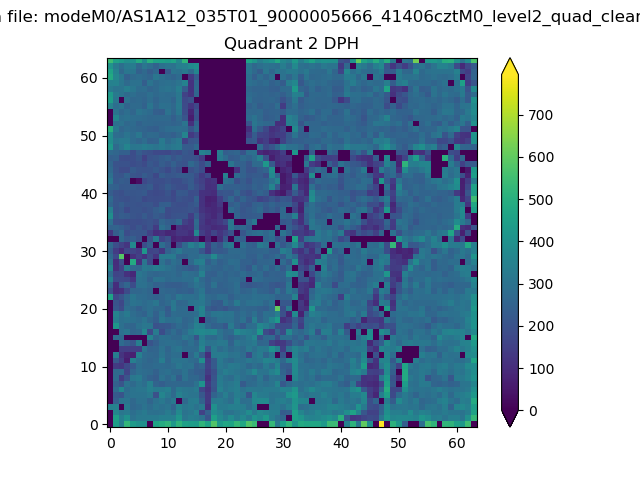 |
Quadrant C |
| Plot type | Count rate plots | Images |
|---|---|---|
| Comparison with Poisson distribution Blue bars denote a histogram of data divided into 1 sec bins. Red curve is a Poisson curve with rate = median count rate of data. |
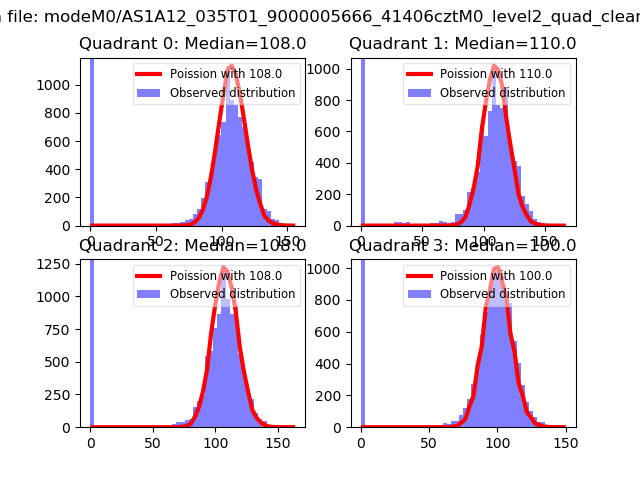 |
 |
| Quadrant-wise count rates Data is divided into 100 sec bins |
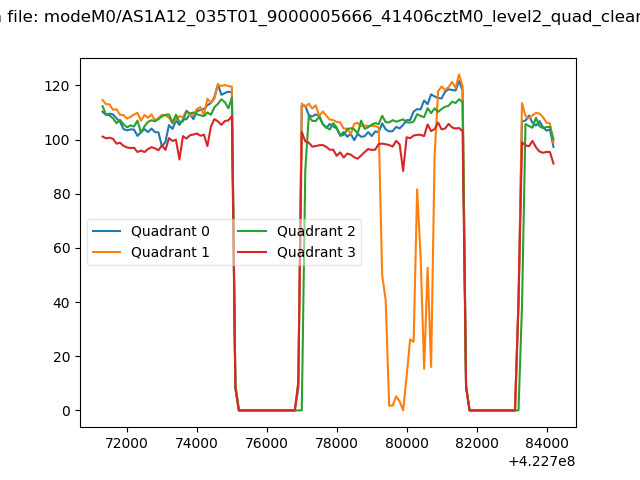 |
|
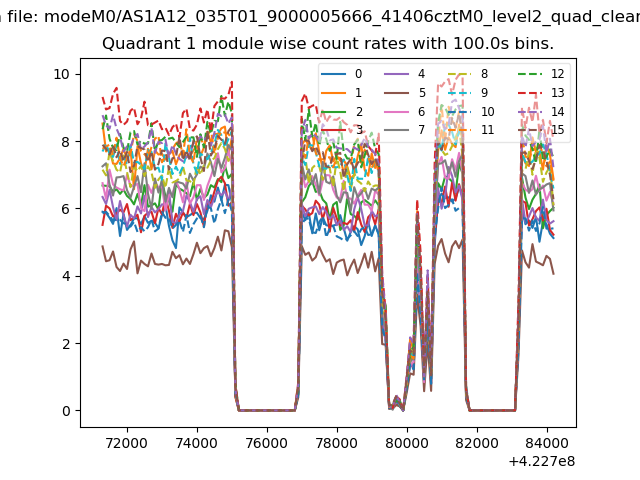
| Module-wise count rates for Quadrant A Data is divided into 100 sec bins |
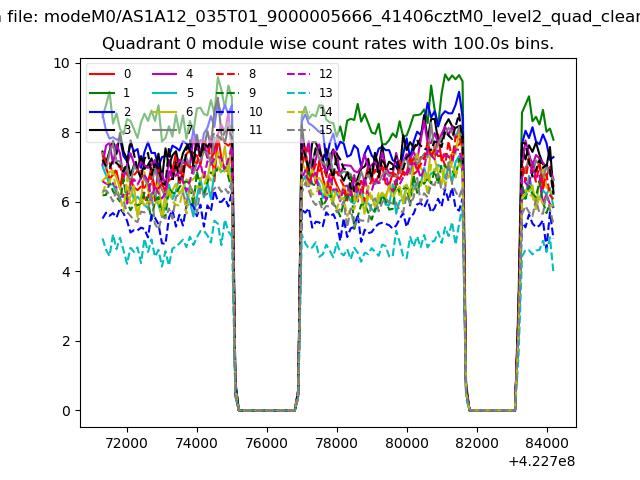 |
 |
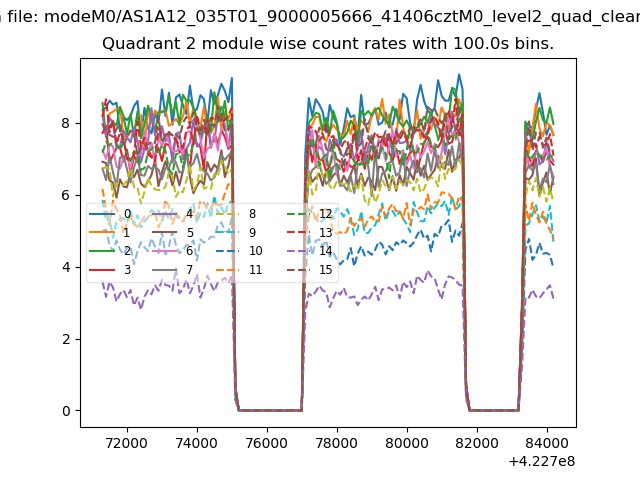
| Module-wise count rates for Quadrant B Data is divided into 100 sec bins |
 |
 |
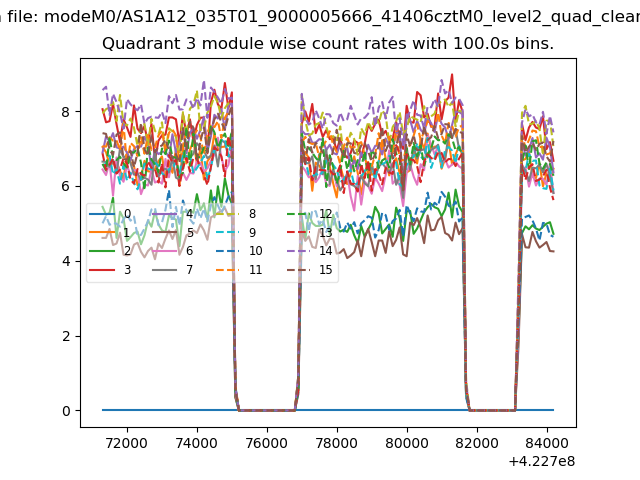
| Module-wise count rates for Quadrant C Data is divided into 100 sec bins |
 |
 |
| Module-wise count rates for Quadrant D Data is divided into 100 sec bins |
 |
 |
| Parameter | Plot |
|---|---|
| CZT HV Monitor | 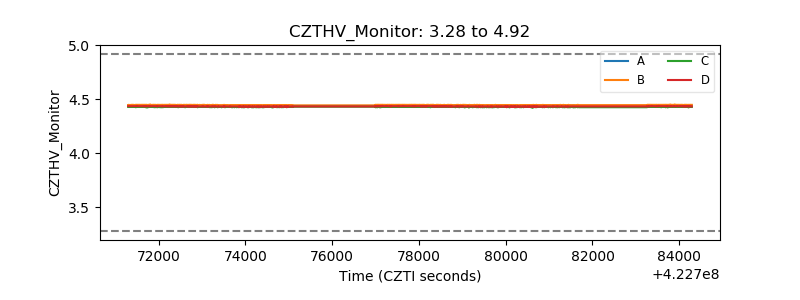 |
| D_VDD | 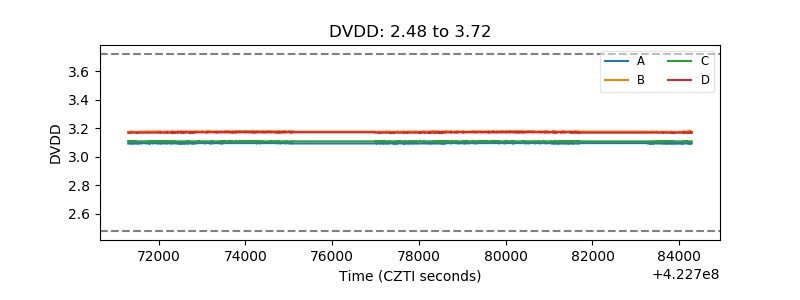 |
| Temperature 1 | 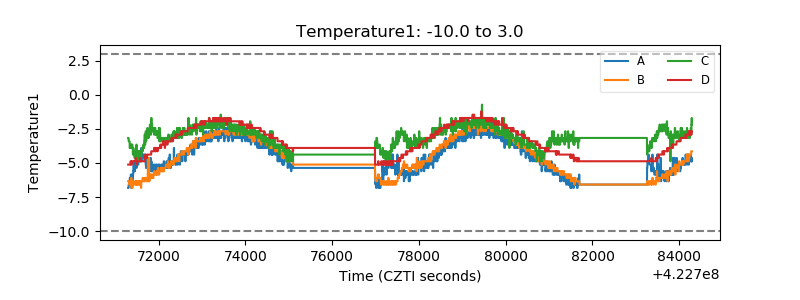 |
| Veto HV Monitor | 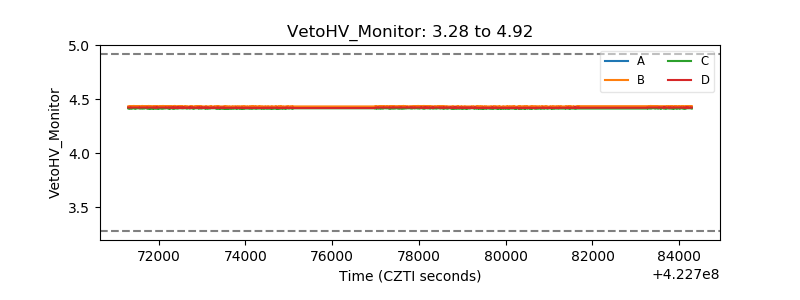 |
| Veto LLD | 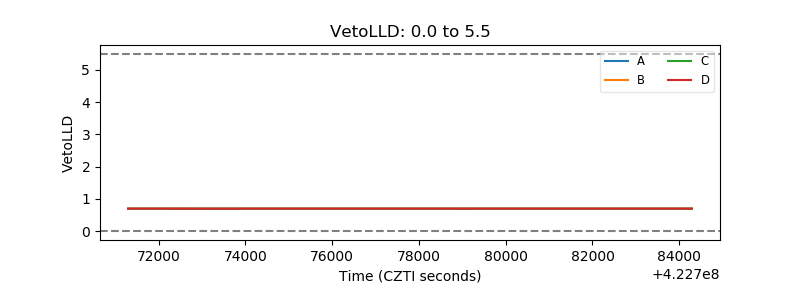 |
| Alpha Counter | 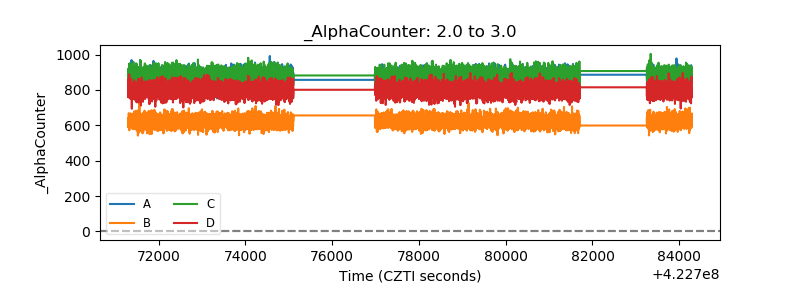 |
| _CPM_Rate | 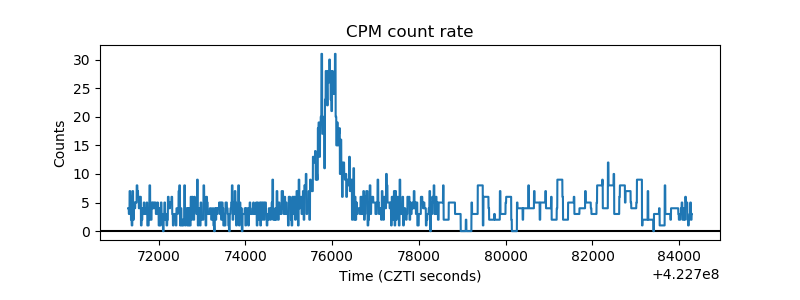 |
| CZT Counter | 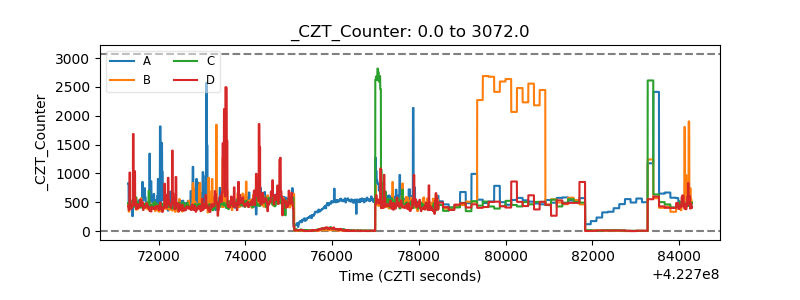 |
| +2.5 Volts monitor | 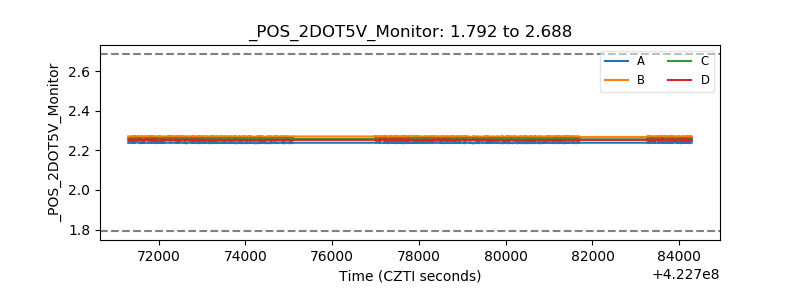 |
| +5 Volts monitor | 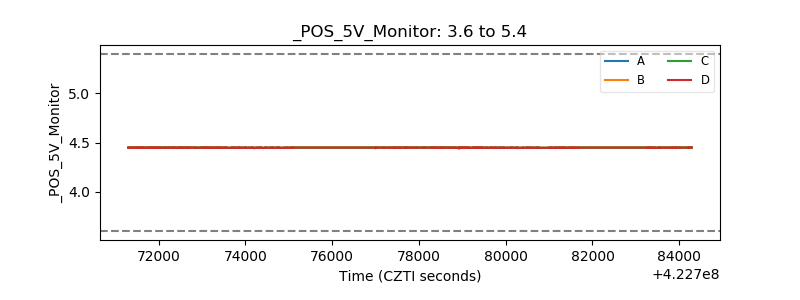 |
| _ROLL_ROT | 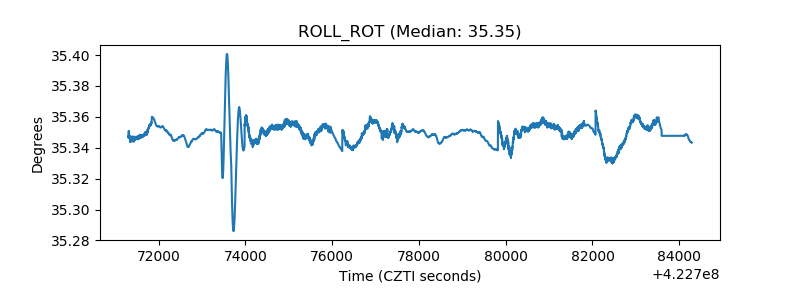 |
| _Roll_DEC | 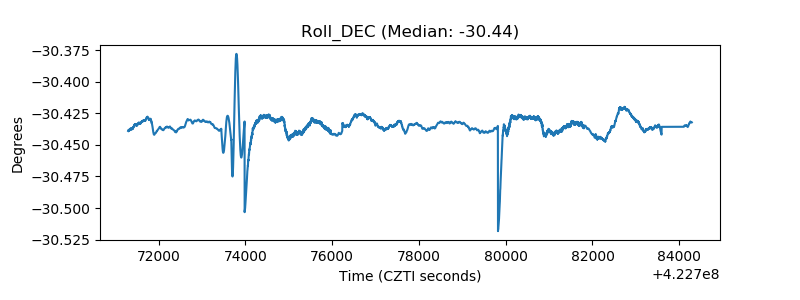 |
| _Roll_RA | 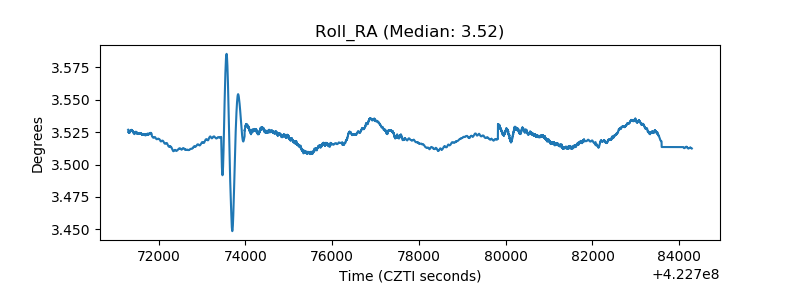 |
| Veto Counter | 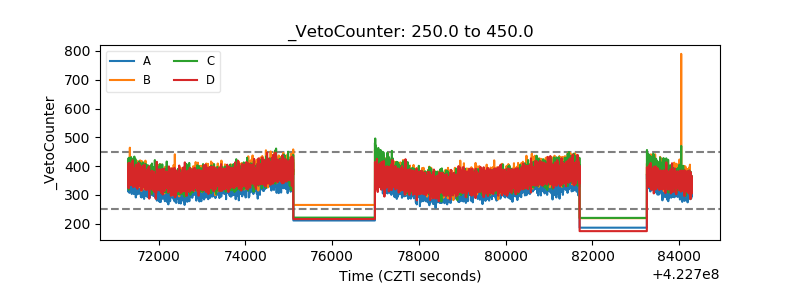 |