| Param | Original file | Final file |
|---|---|---|
| Filename | modeM0/AS1A12_035T01_9000005666_41407cztM0_level2.fits | modeM0/AS1A12_035T01_9000005666_41407cztM0_level2_quad_clean.evt |
| Size (bytes) | 368,913,600 | 95,814,720 |
| Size | 351.8 MB | 91.4 MB |
| Events in quadrant A | 3,721,474 | 634,823 |
| Events in quadrant B | 3,117,519 | 653,394 |
| Events in quadrant C | 3,267,096 | 612,867 |
| Events in quadrant D | 3,085,470 | 583,011 |
| Mode M0 | |||
|---|---|---|---|
| Quadrant | BADHDUFLAG | Total packets | Discarded packets |
| A | 0 | 14605 | 3 |
| B | 0 | 13203 | 2 |
| C | 0 | 13412 | 2 |
| D | 0 | 13376 | 2 |
| Mode SS | |||
|---|---|---|---|
| Quadrant | BADHDUFLAG | Total packets | Discarded packets |
| A | 0 | 122 | 0 |
| B | 0 | 122 | 0 |
| C | 0 | 122 | 0 |
| D | 0 | 122 | 0 |
| Mode M9 | |||
|---|---|---|---|
| Quadrant | BADHDUFLAG | Total packets | Discarded packets |
| A | 0 | 13 | 0 |
| B | 0 | 13 | 0 |
| C | 0 | 13 | 0 |
| D | 0 | 13 | 0 |
| Quadrant | Total seconds | Saturated seconds | Saturation percentage |
|---|---|---|---|
| A | 5968 | 80 | 1.340483% |
| B | 5968 | 27 | 0.452413% |
| C | 5968 | 185 | 3.099866% |
| D | 5968 | 36 | 0.603217% |
Noise dominated data is calculated using 1-second bins in cleaned event files. If a bin has >2000 counts, and if more than 50% of those come from <1% of pixels, then it is considered to be noise-dominated and hence unusable.
| Quadrant | # 1 sec bins | Bins with >0 counts | Bins with >2000 counts | High rate bins dominated by noise | Noise dominated (total time) | Noise dominated (detector-on time) | Marked lightcurve |
|---|---|---|---|---|---|---|---|
| A | 7281 | 5969 | 66 | 66 | 0.91% | 1.11% | 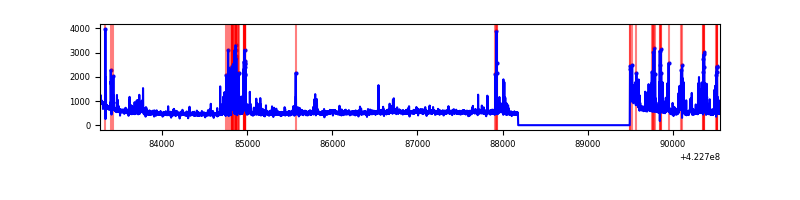 |
| B | 7281 | 5969 | 21 | 21 | 0.29% | 0.35% | 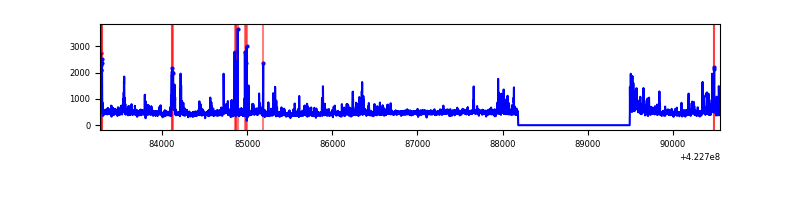 |
| C | 7281 | 5969 | 189 | 189 | 2.60% | 3.17% | 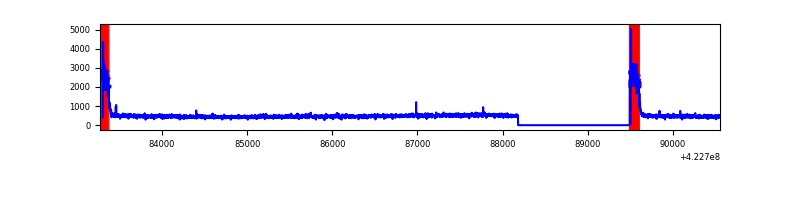 |
| D | 7281 | 5969 | 30 | 30 | 0.41% | 0.50% | 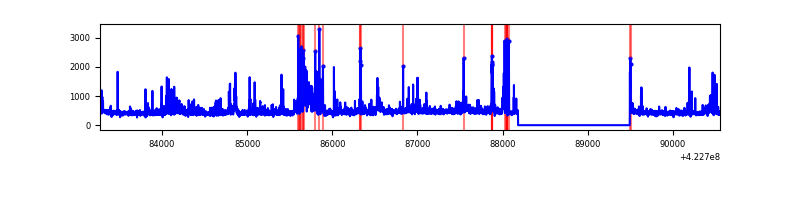 |
Top three noisy pixels from each quadrant. If the there are fewer than three noisy pixels in the level2.evt file, extra rows are filled as -1
| Pixel properties | Quadrant properties | ||||||
|---|---|---|---|---|---|---|---|
| Quadrant | DetID | PixID | Counts | Sigma | Mean | Median | Sigma |
| A | 13 | 248 | 566160 | 4168.84 | 653 | 637 | 135.7 |
| A | 10 | 83 | 544604 | 4009.94 | 653 | 637 | 135.7 |
| A | 12 | 189 | 47478 | 345.3 | 653 | 637 | 135.7 |
| B | 5 | 255 | 436981 | 3458.54 | 648 | 629 | 126.2 |
| B | 0 | 190 | 114219 | 900.32 | 648 | 629 | 126.2 |
| B | 12 | 111 | 16576 | 126.4 | 648 | 629 | 126.2 |
| C | 0 | 10 | 529853 | 3545.53 | 631 | 632 | 149.3 |
| C | 15 | 214 | 261345 | 1746.65 | 631 | 632 | 149.3 |
| C | 0 | 15 | 14707 | 94.3 | 631 | 632 | 149.3 |
| D | 2 | 120 | 192506 | 1221.53 | 644 | 625 | 157.1 |
| D | 13 | 249 | 165645 | 1050.53 | 644 | 625 | 157.1 |
| D | 1 | 52 | 90661 | 573.18 | 644 | 625 | 157.1 |
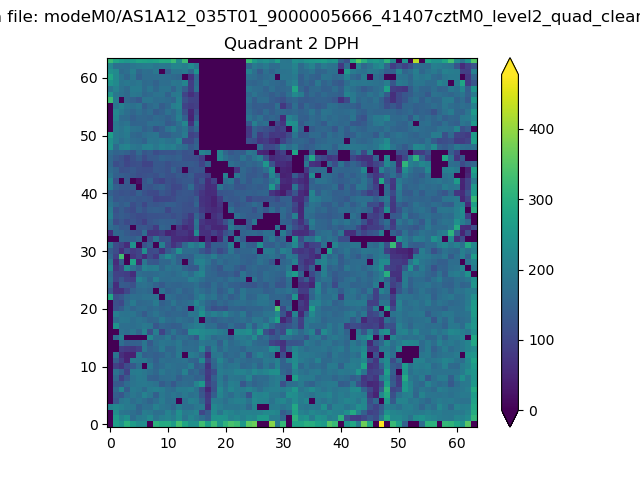
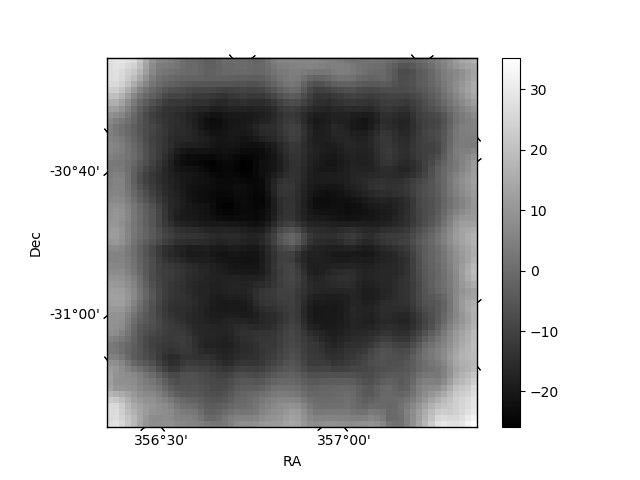
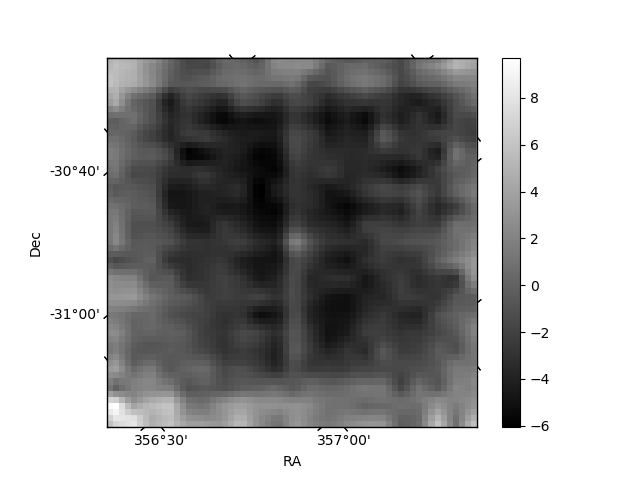
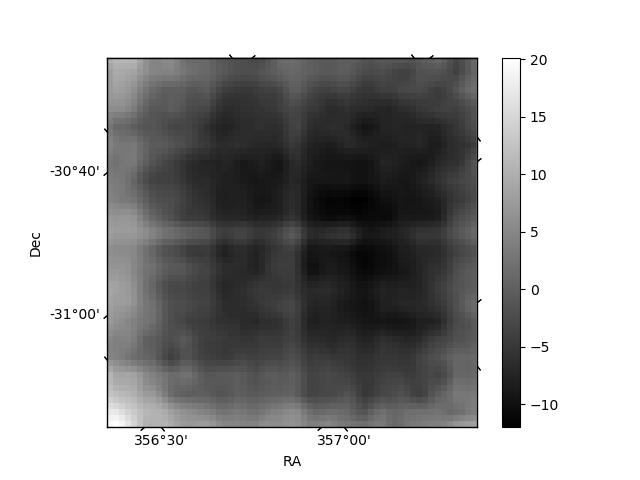
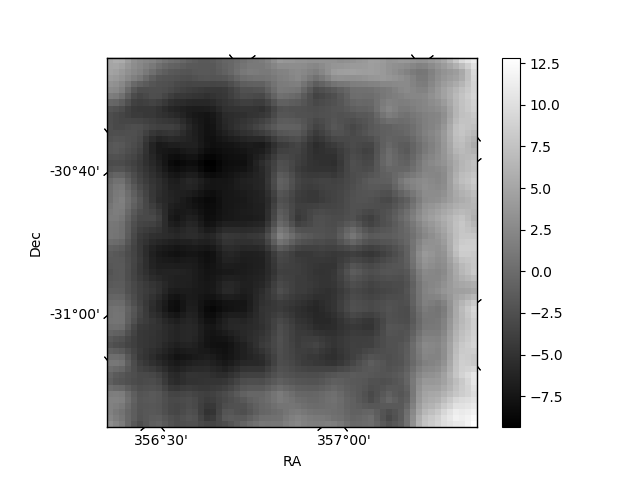
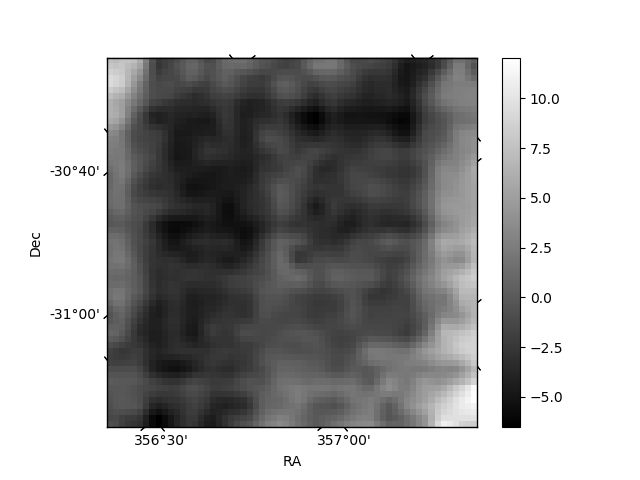
Histogram calculated using DETX and DETY for each event in the final _common_clean file
| Quadrant A | 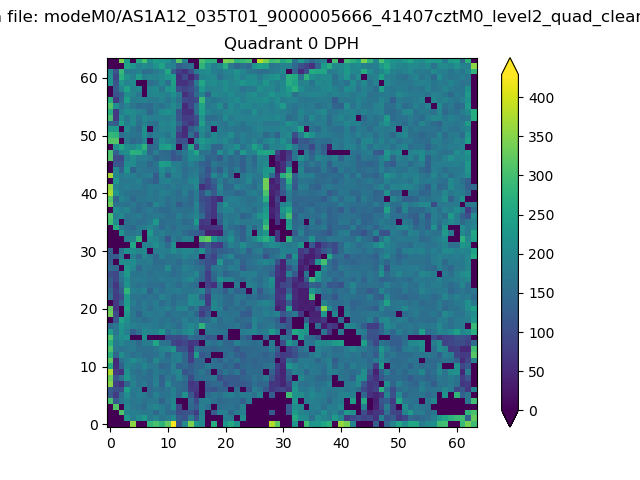 |
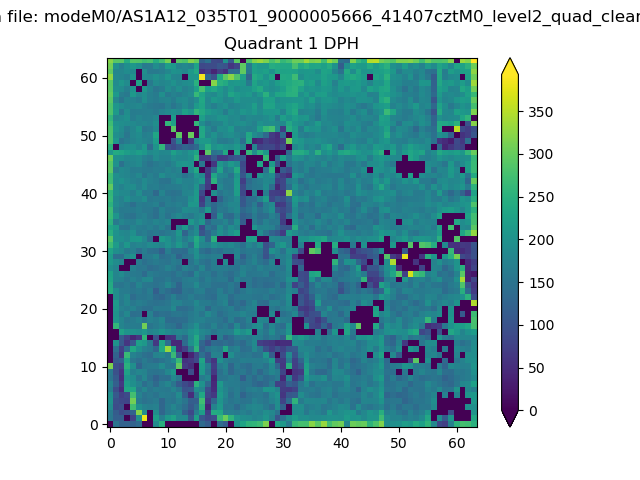 |
Quadrant B |
|---|---|---|---|
| Quadrant D | 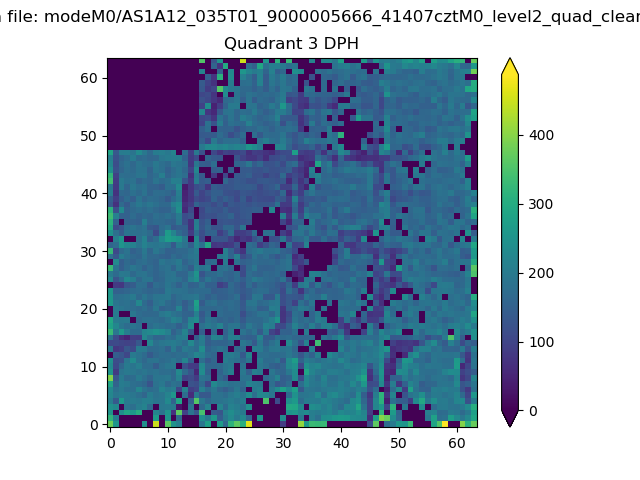 |
 |
Quadrant C |
| Plot type | Count rate plots | Images |
|---|---|---|
| Comparison with Poisson distribution Blue bars denote a histogram of data divided into 1 sec bins. Red curve is a Poisson curve with rate = median count rate of data. |
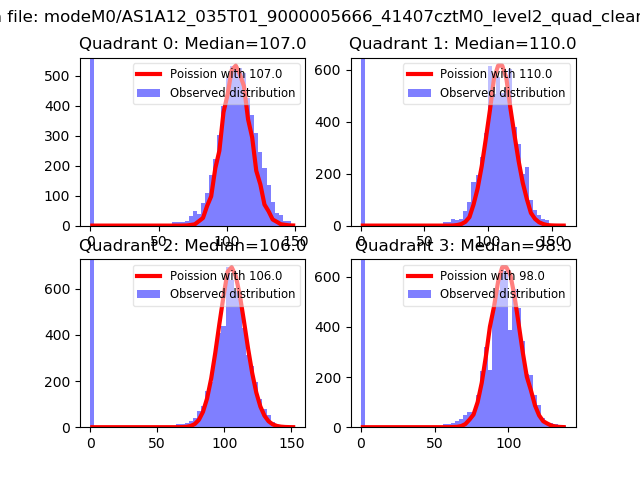 |
 |
| Quadrant-wise count rates Data is divided into 100 sec bins |
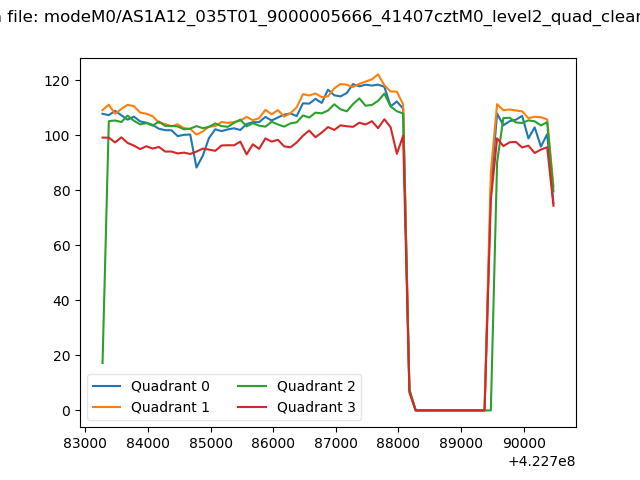 |
|
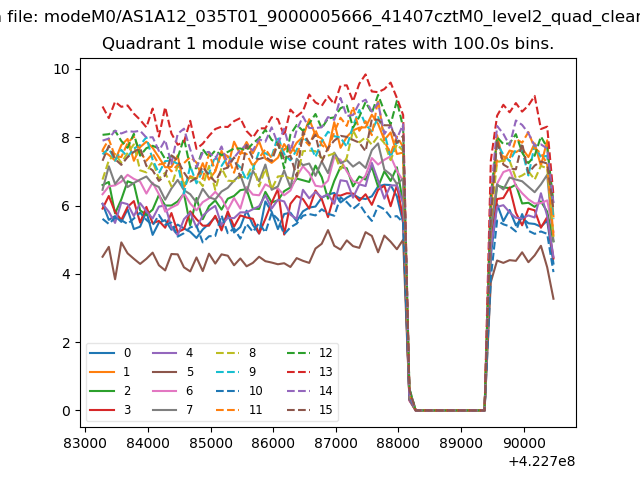
| Module-wise count rates for Quadrant A Data is divided into 100 sec bins |
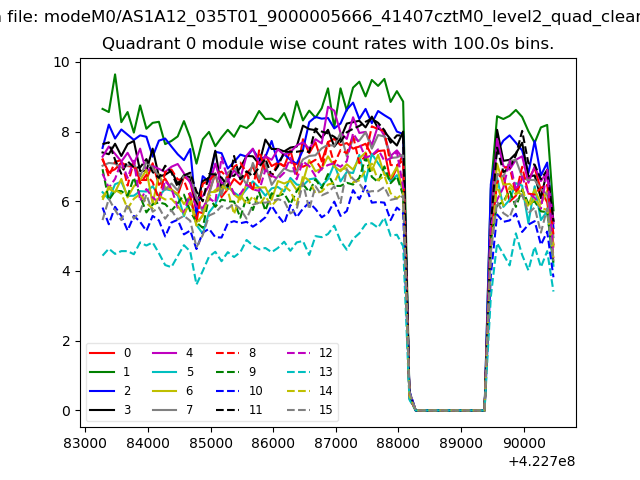 |
 |
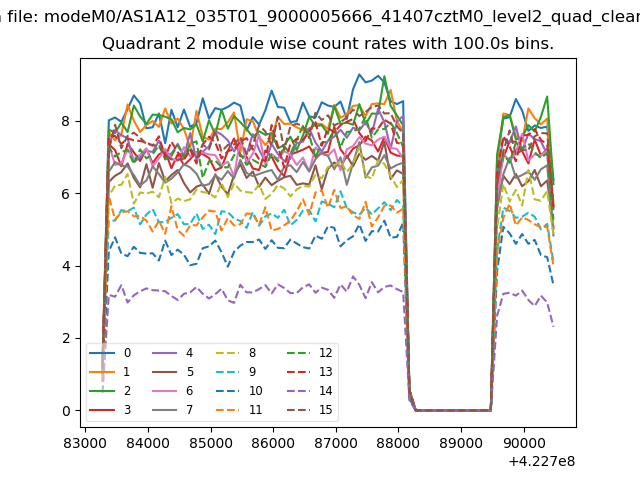
| Module-wise count rates for Quadrant B Data is divided into 100 sec bins |
 |
 |
| Module-wise count rates for Quadrant C Data is divided into 100 sec bins |
 |
 |
| Module-wise count rates for Quadrant D Data is divided into 100 sec bins |
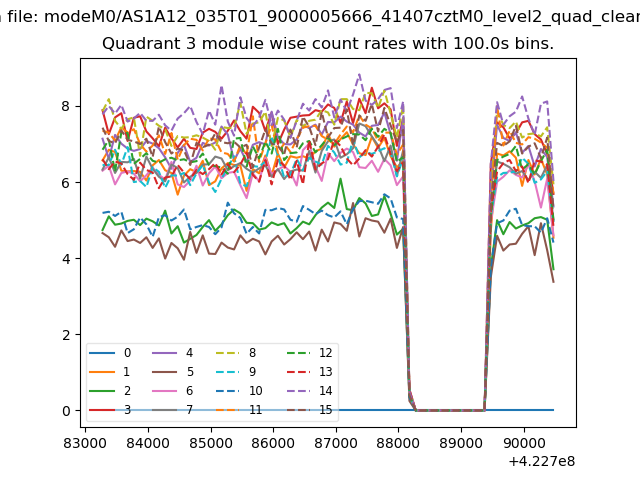 |
 |
| Parameter | Plot |
|---|---|
| CZT HV Monitor | 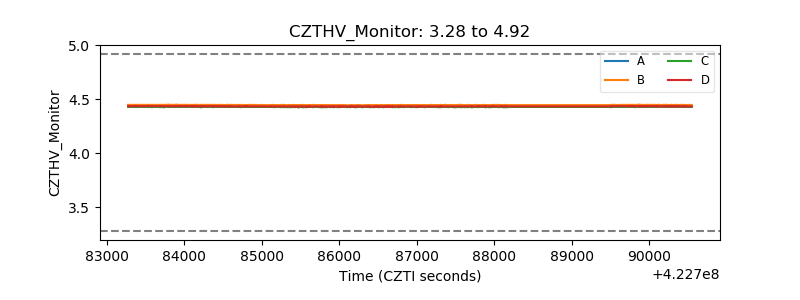 |
| D_VDD | 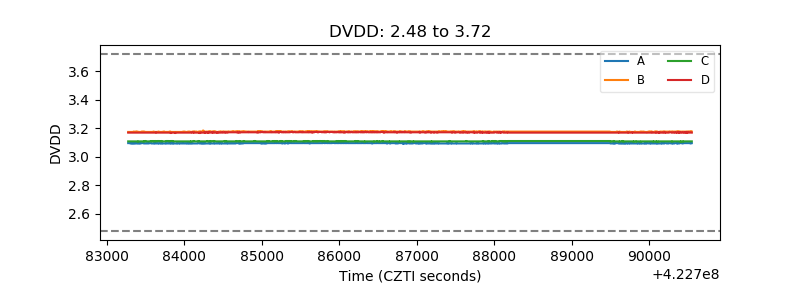 |
| Temperature 1 | 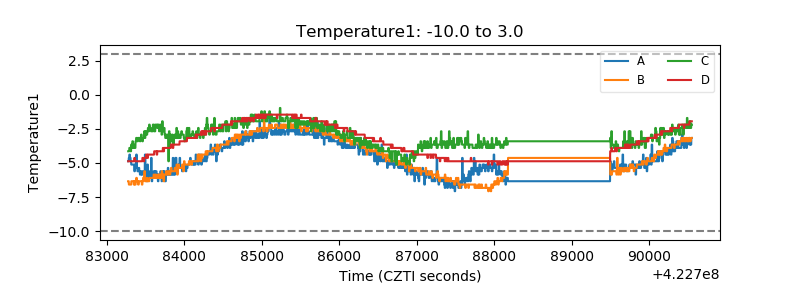 |
| Veto HV Monitor | 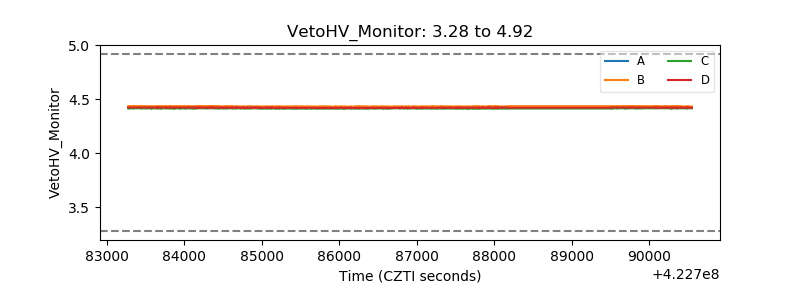 |
| Veto LLD | 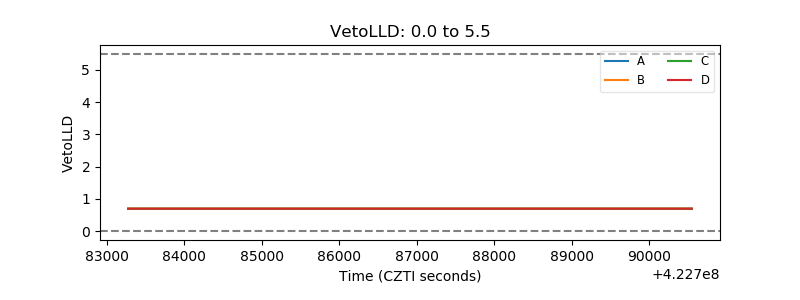 |
| Alpha Counter | 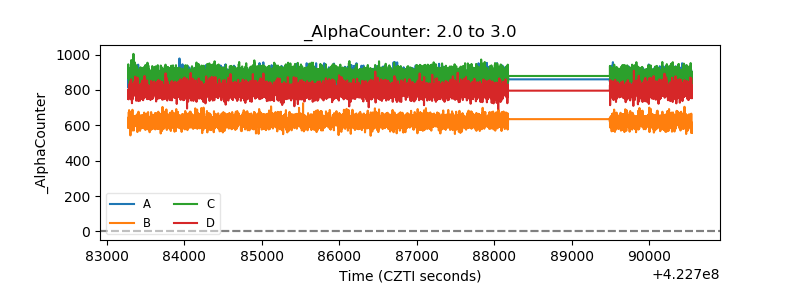 |
| _CPM_Rate |  |
| CZT Counter | 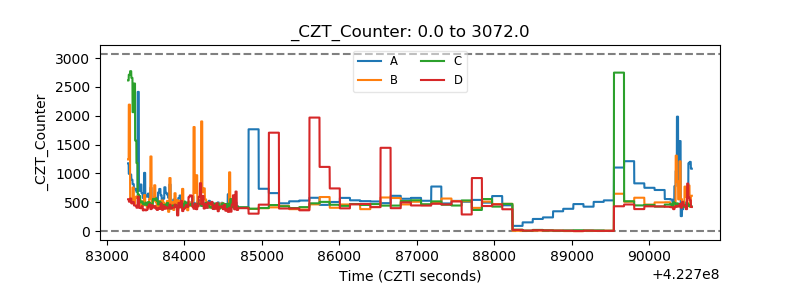 |
| +2.5 Volts monitor | 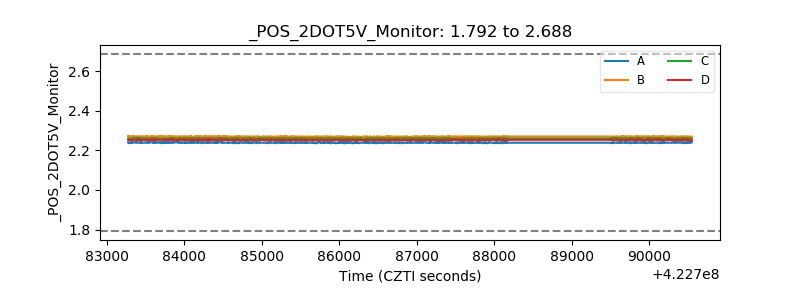 |
| +5 Volts monitor | 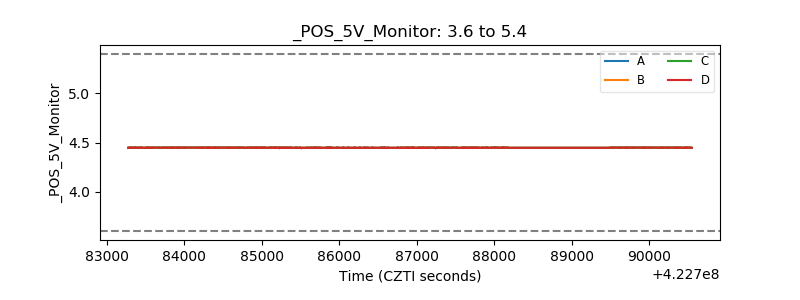 |
| _ROLL_ROT | 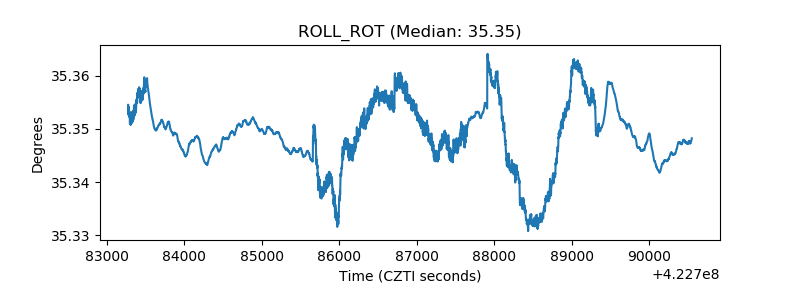 |
| _Roll_DEC | 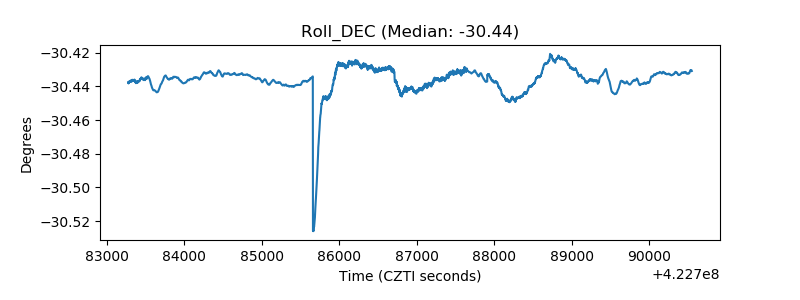 |
| _Roll_RA | 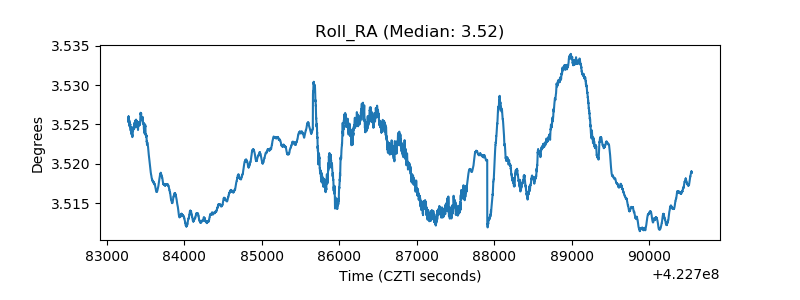 |
| Veto Counter | 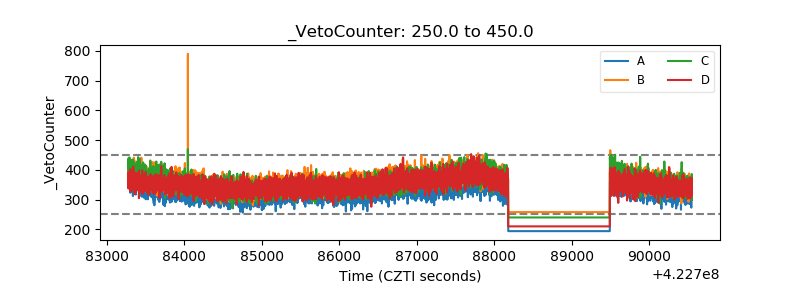 |