| Param | Original file | Final file |
|---|---|---|
| Filename | modeM0/AS1A12_035T01_9000005666_41408cztM0_level2.fits | modeM0/AS1A12_035T01_9000005666_41408cztM0_level2_quad_clean.evt |
| Size (bytes) | 352,241,280 | 95,391,360 |
| Size | 335.9 MB | 91.0 MB |
| Events in quadrant A | 3,598,967 | 632,745 |
| Events in quadrant B | 2,897,580 | 648,645 |
| Events in quadrant C | 3,349,579 | 610,245 |
| Events in quadrant D | 2,731,083 | 582,576 |
| Mode M0 | |||
|---|---|---|---|
| Quadrant | BADHDUFLAG | Total packets | Discarded packets |
| A | 0 | 14160 | 3 |
| B | 0 | 12604 | 2 |
| C | 0 | 13577 | 2 |
| D | 0 | 12369 | 2 |
| Mode SS | |||
|---|---|---|---|
| Quadrant | BADHDUFLAG | Total packets | Discarded packets |
| A | 0 | 120 | 0 |
| B | 0 | 120 | 0 |
| C | 0 | 120 | 0 |
| D | 0 | 120 | 0 |
| Mode M9 | |||
|---|---|---|---|
| Quadrant | BADHDUFLAG | Total packets | Discarded packets |
| A | 0 | 24 | 0 |
| B | 0 | 24 | 0 |
| C | 0 | 24 | 0 |
| D | 0 | 25 | 0 |
| Quadrant | Total seconds | Saturated seconds | Saturation percentage |
|---|---|---|---|
| A | 5928 | 62 | 1.045884% |
| B | 5928 | 15 | 0.253036% |
| C | 5928 | 189 | 3.188259% |
| D | 5928 | 22 | 0.371120% |
Noise dominated data is calculated using 1-second bins in cleaned event files. If a bin has >2000 counts, and if more than 50% of those come from <1% of pixels, then it is considered to be noise-dominated and hence unusable.
| Quadrant | # 1 sec bins | Bins with >0 counts | Bins with >2000 counts | High rate bins dominated by noise | Noise dominated (total time) | Noise dominated (detector-on time) | Marked lightcurve |
|---|---|---|---|---|---|---|---|
| A | 7210 | 5929 | 45 | 45 | 0.62% | 0.76% | 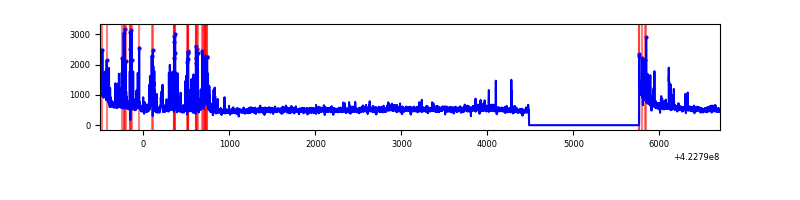 |
| B | 7210 | 5929 | 3 | 3 | 0.04% | 0.05% | 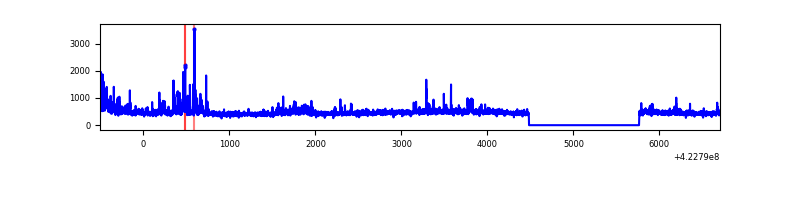 |
| C | 7210 | 5929 | 190 | 190 | 2.64% | 3.20% | 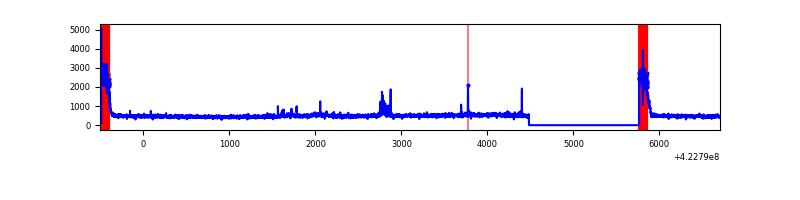 |
| D | 7210 | 5929 | 14 | 14 | 0.19% | 0.24% | 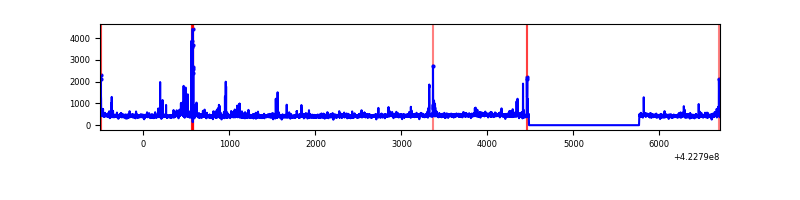 |
Top three noisy pixels from each quadrant. If the there are fewer than three noisy pixels in the level2.evt file, extra rows are filled as -1
| Pixel properties | Quadrant properties | ||||||
|---|---|---|---|---|---|---|---|
| Quadrant | DetID | PixID | Counts | Sigma | Mean | Median | Sigma |
| A | 10 | 83 | 563475 | 4167.33 | 654 | 640 | 135.1 |
| A | 13 | 248 | 463243 | 3425.19 | 654 | 640 | 135.1 |
| A | 2 | 79 | 20603 | 147.81 | 654 | 640 | 135.1 |
| B | 5 | 255 | 272305 | 2126.61 | 648 | 629 | 127.8 |
| B | 0 | 190 | 27960 | 213.94 | 648 | 629 | 127.8 |
| B | 0 | 186 | 25233 | 192.59 | 648 | 629 | 127.8 |
| C | 0 | 10 | 531679 | 3602.58 | 628 | 631 | 147.4 |
| C | 15 | 214 | 261707 | 1771.11 | 628 | 631 | 147.4 |
| C | 3 | 233 | 42435 | 283.59 | 628 | 631 | 147.4 |
| D | 13 | 249 | 93079 | 578.9 | 644 | 625 | 159.7 |
| D | 12 | 79 | 67647 | 419.66 | 644 | 625 | 159.7 |
| D | 1 | 52 | 47303 | 292.27 | 644 | 625 | 159.7 |
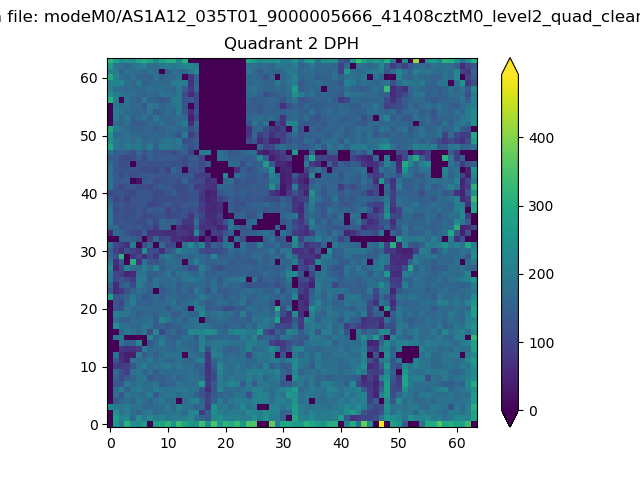
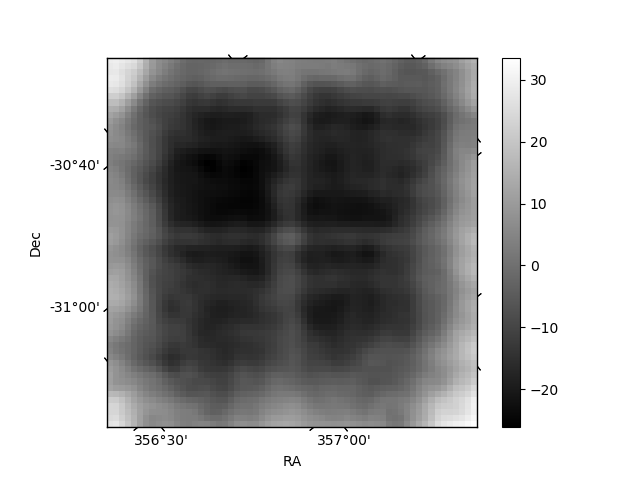
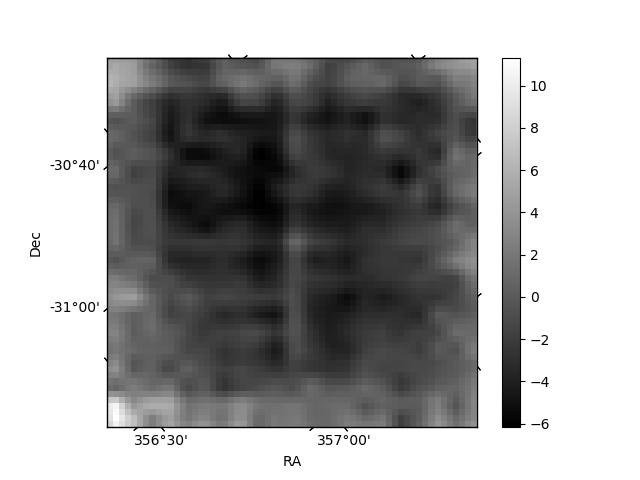
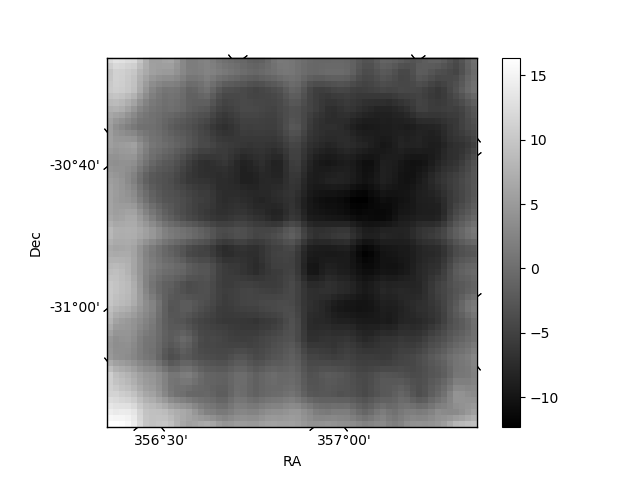
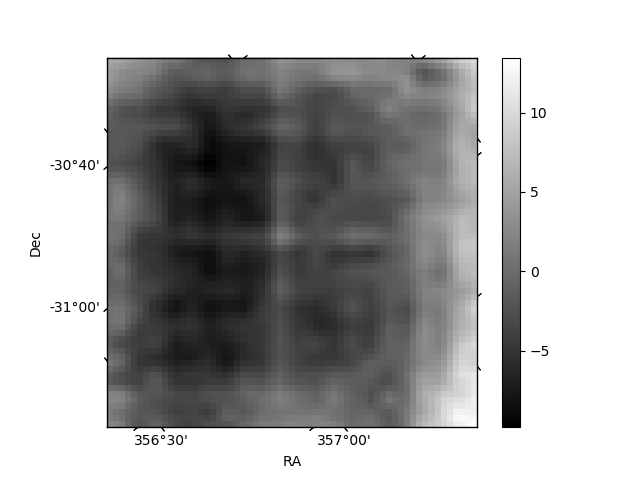
Histogram calculated using DETX and DETY for each event in the final _common_clean file
| Quadrant A | 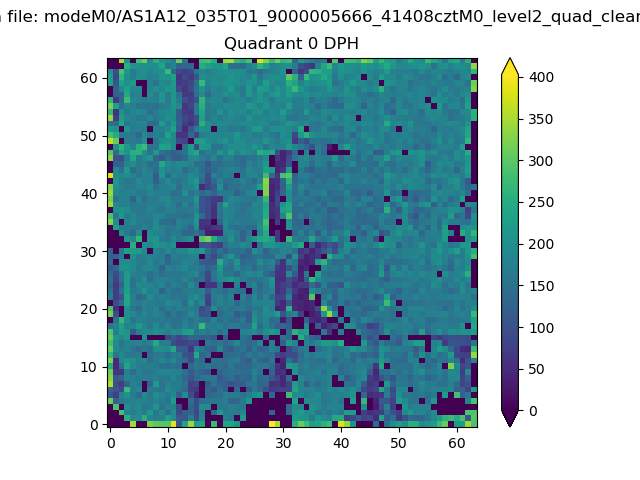 |
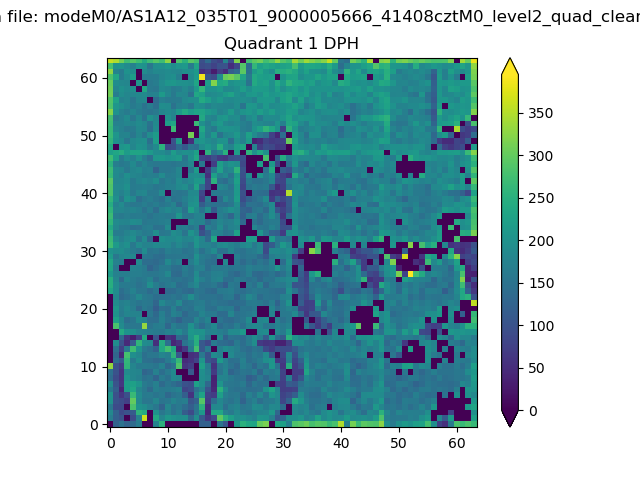 |
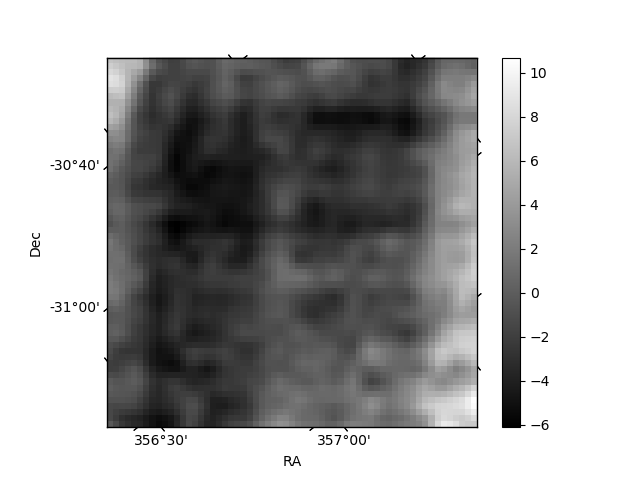
Quadrant B |
|---|---|---|---|
| Quadrant D | 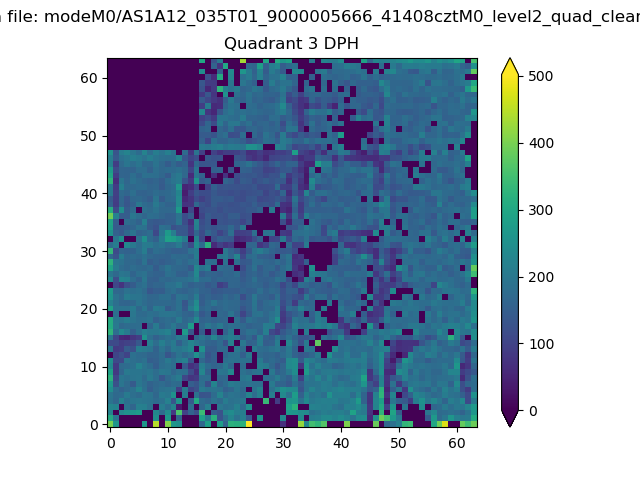 |
 |
Quadrant C |
| Plot type | Count rate plots | Images |
|---|---|---|
| Comparison with Poisson distribution Blue bars denote a histogram of data divided into 1 sec bins. Red curve is a Poisson curve with rate = median count rate of data. |
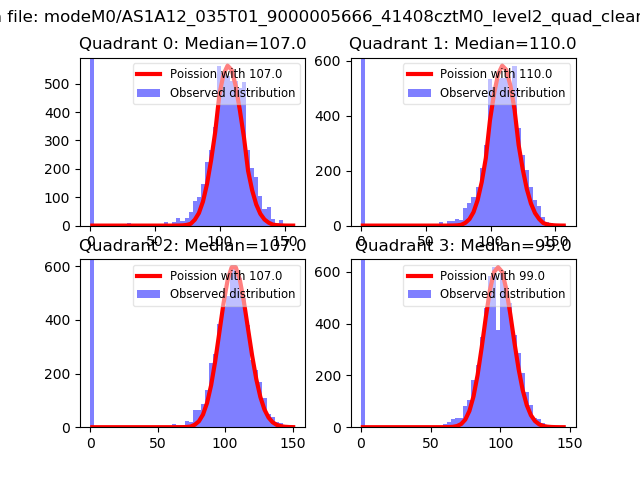 |
 |
| Quadrant-wise count rates Data is divided into 100 sec bins |
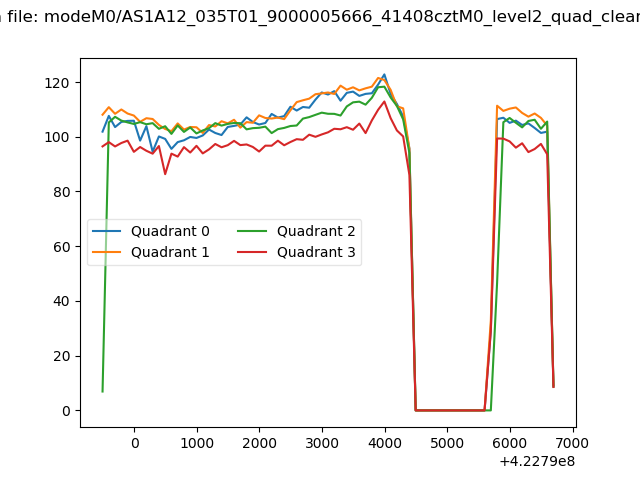 |
|
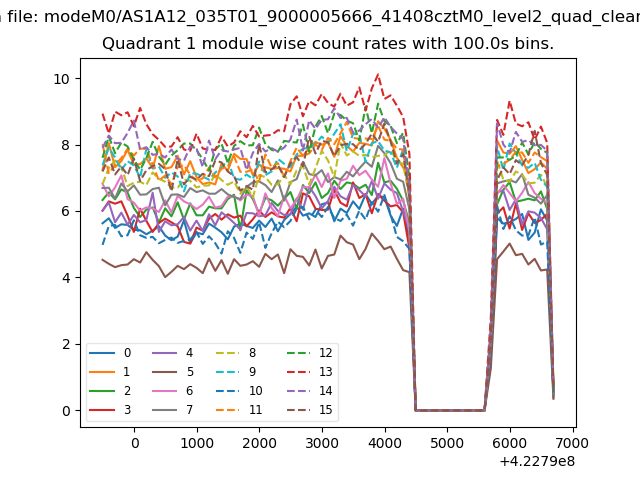
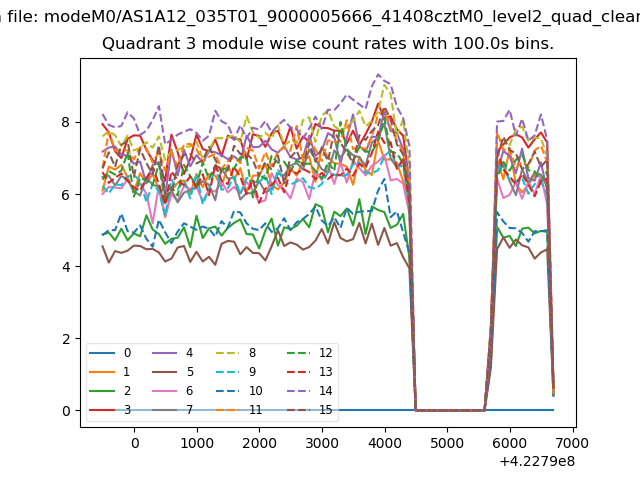
| Module-wise count rates for Quadrant A Data is divided into 100 sec bins |
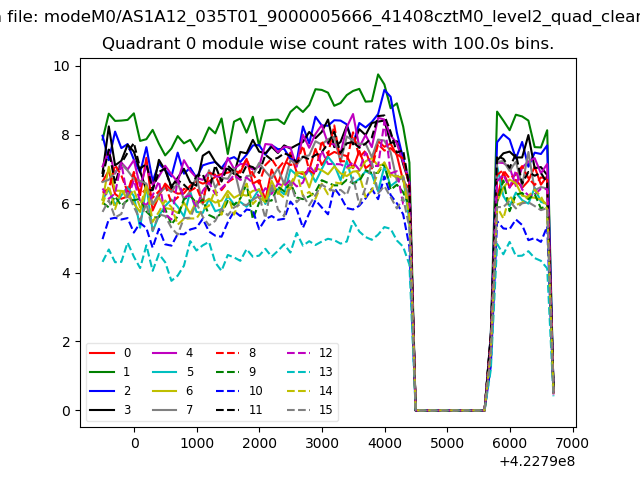 |
 |
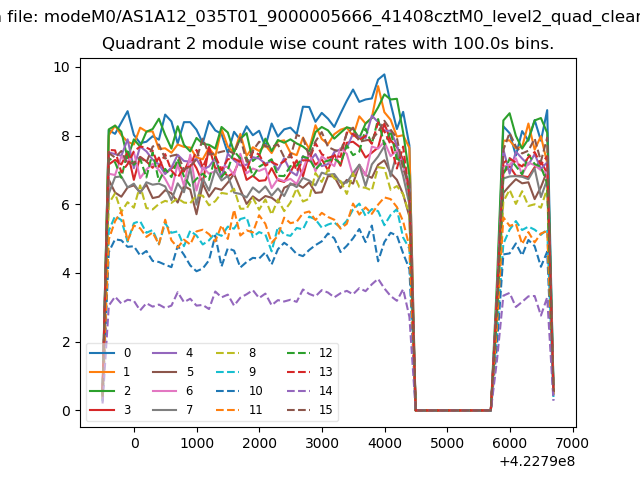
| Module-wise count rates for Quadrant B Data is divided into 100 sec bins |
 |
 |
| Module-wise count rates for Quadrant C Data is divided into 100 sec bins |
 |
 |
| Module-wise count rates for Quadrant D Data is divided into 100 sec bins |
 |
 |
| Parameter | Plot |
|---|---|
| CZT HV Monitor | 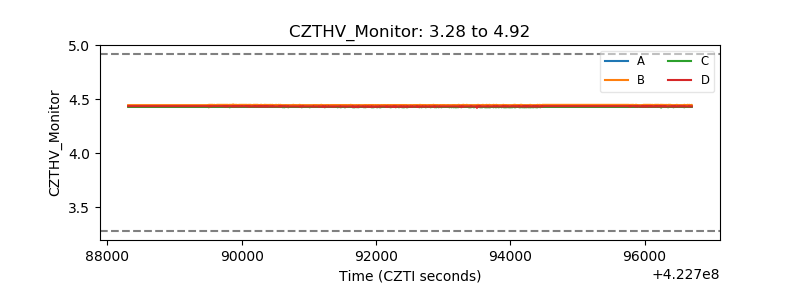 |
| D_VDD | 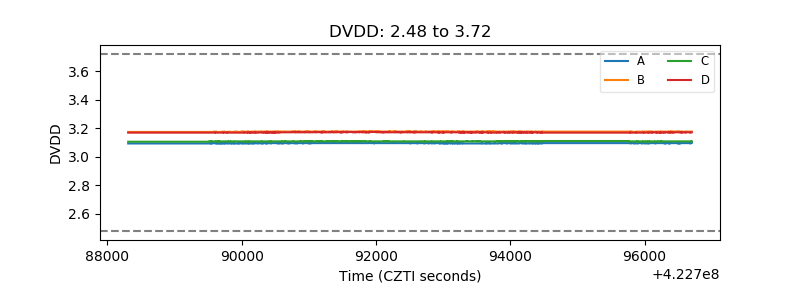 |
| Temperature 1 | 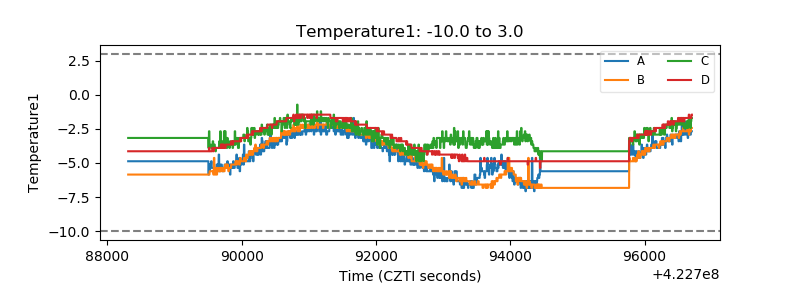 |
| Veto HV Monitor | 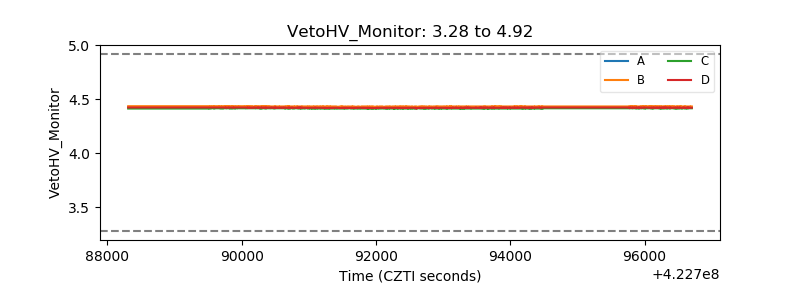 |
| Veto LLD | 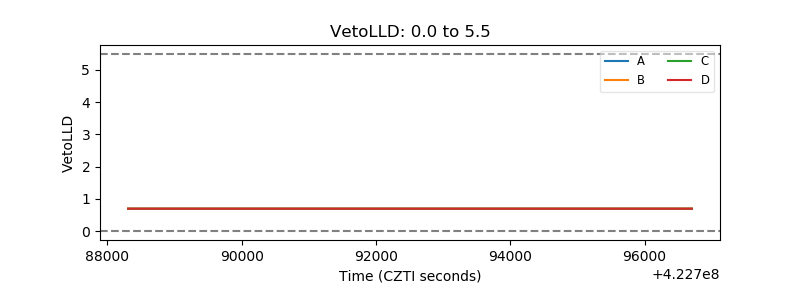 |
| Alpha Counter | 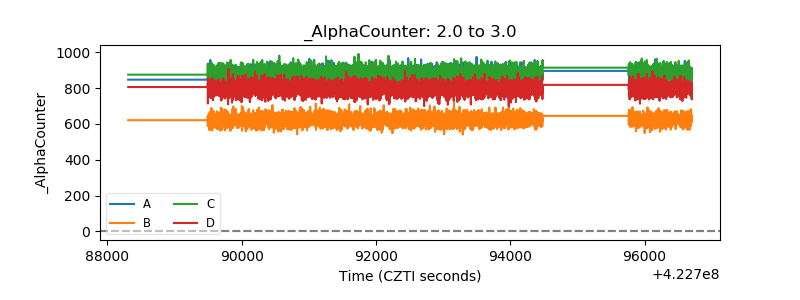 |
| _CPM_Rate | 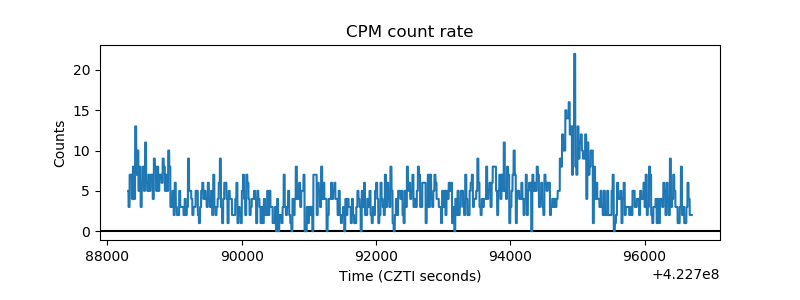 |
| CZT Counter | 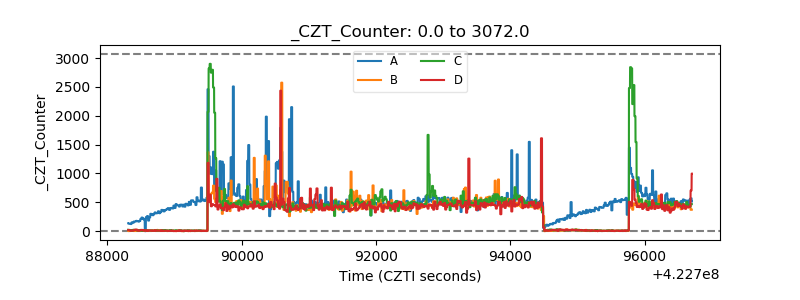 |
| +2.5 Volts monitor | 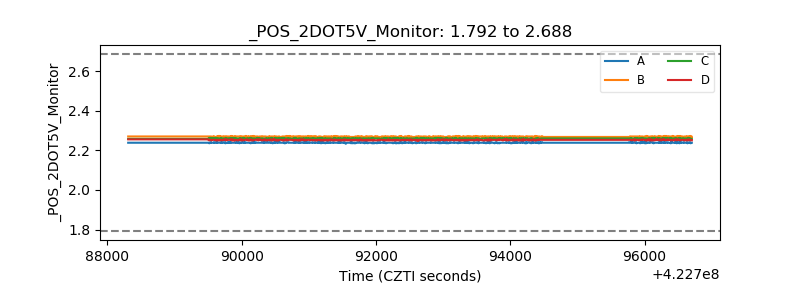 |
| +5 Volts monitor | 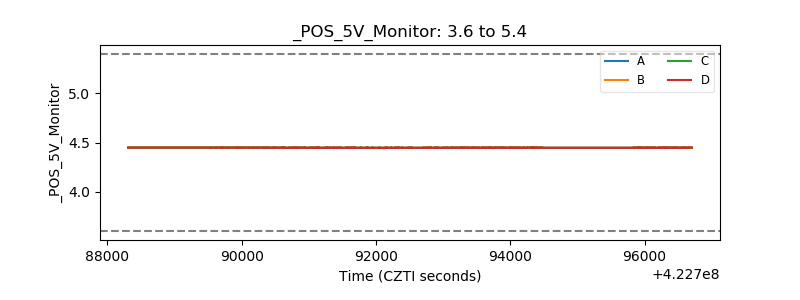 |
| _ROLL_ROT | 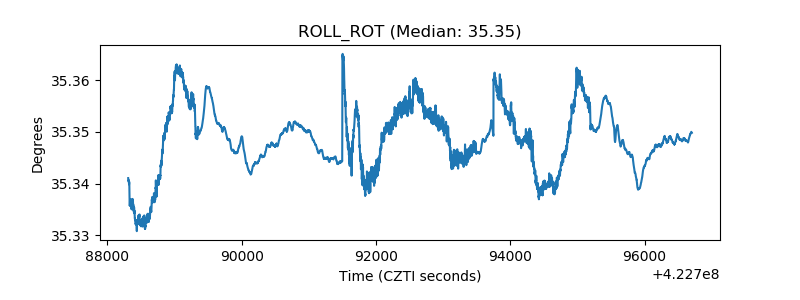 |
| _Roll_DEC | 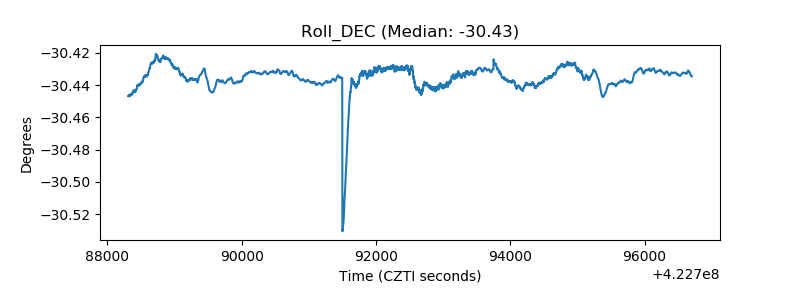 |
| _Roll_RA | 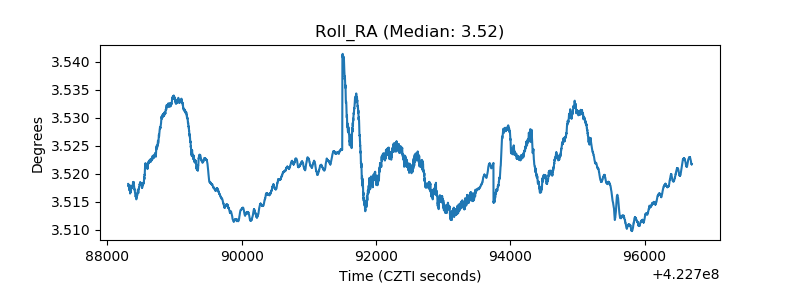 |
| Veto Counter | 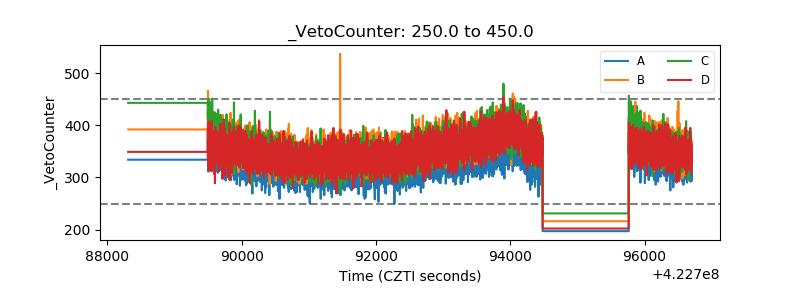 |