| Param | Original file | Final file |
|---|---|---|
| Filename | modeM0/AS1A12_035T01_9000005666_41410cztM0_level2.fits | modeM0/AS1A12_035T01_9000005666_41410cztM0_level2_quad_clean.evt |
| Size (bytes) | 652,345,920 | 171,990,720 |
| Size | 622.1 MB | 164.0 MB |
| Events in quadrant A | 6,021,186 | 1,146,504 |
| Events in quadrant B | 5,547,370 | 1,170,041 |
| Events in quadrant C | 5,987,499 | 1,097,454 |
| Events in quadrant D | 5,751,979 | 1,043,962 |
| Mode M0 | |||
|---|---|---|---|
| Quadrant | BADHDUFLAG | Total packets | Discarded packets |
| A | 0 | 24054 | 4 |
| B | 0 | 23708 | 3 |
| C | 0 | 24447 | 3 |
| D | 0 | 24623 | 3 |
| Mode SS | |||
|---|---|---|---|
| Quadrant | BADHDUFLAG | Total packets | Discarded packets |
| A | 0 | 220 | 0 |
| B | 0 | 220 | 0 |
| C | 0 | 220 | 0 |
| D | 0 | 220 | 0 |
| Mode M9 | |||
|---|---|---|---|
| Quadrant | BADHDUFLAG | Total packets | Discarded packets |
| A | 0 | 38 | 0 |
| B | 0 | 38 | 0 |
| C | 0 | 38 | 0 |
| D | 0 | 39 | 0 |
| Quadrant | Total seconds | Saturated seconds | Saturation percentage |
|---|---|---|---|
| A | 10824 | 46 | 0.424982% |
| B | 10824 | 91 | 0.840724% |
| C | 10824 | 340 | 3.141168% |
| D | 10824 | 124 | 1.145602% |
Noise dominated data is calculated using 1-second bins in cleaned event files. If a bin has >2000 counts, and if more than 50% of those come from <1% of pixels, then it is considered to be noise-dominated and hence unusable.
| Quadrant | # 1 sec bins | Bins with >0 counts | Bins with >2000 counts | High rate bins dominated by noise | Noise dominated (total time) | Noise dominated (detector-on time) | Marked lightcurve |
|---|---|---|---|---|---|---|---|
| A | 13600 | 10826 | 25 | 25 | 0.18% | 0.23% | 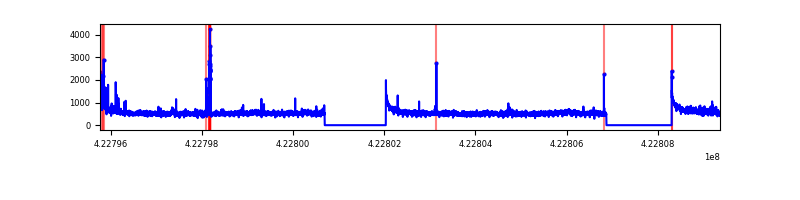 |
| B | 13600 | 10826 | 53 | 53 | 0.39% | 0.49% | 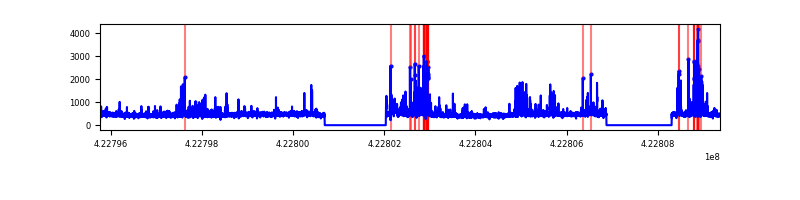 |
| C | 13600 | 10826 | 328 | 328 | 2.41% | 3.03% | 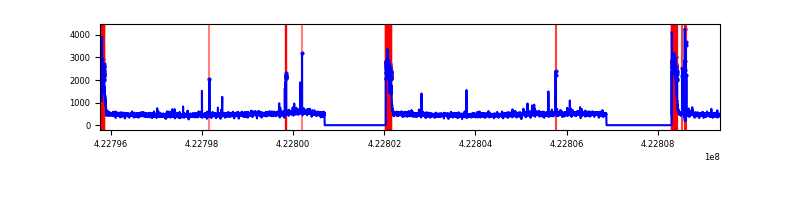 |
| D | 13600 | 10826 | 89 | 89 | 0.65% | 0.82% | 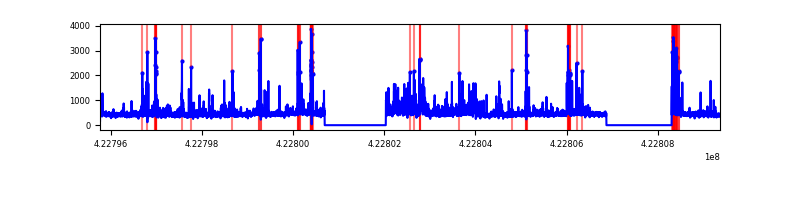 |
Top three noisy pixels from each quadrant. If the there are fewer than three noisy pixels in the level2.evt file, extra rows are filled as -1
| Pixel properties | Quadrant properties | ||||||
|---|---|---|---|---|---|---|---|
| Quadrant | DetID | PixID | Counts | Sigma | Mean | Median | Sigma |
| A | 10 | 83 | 987579 | 4023.84 | 1199 | 1175 | 245.1 |
| A | 2 | 79 | 262216 | 1064.87 | 1199 | 1175 | 245.1 |
| A | 13 | 248 | 63639 | 254.81 | 1199 | 1175 | 245.1 |
| B | 5 | 255 | 636138 | 2757.29 | 1185 | 1148 | 230.3 |
| B | 0 | 190 | 169989 | 733.15 | 1185 | 1148 | 230.3 |
| B | 0 | 189 | 42757 | 180.68 | 1185 | 1148 | 230.3 |
| C | 0 | 10 | 864529 | 3218.2 | 1151 | 1157 | 268.3 |
| C | 15 | 214 | 473572 | 1760.92 | 1151 | 1157 | 268.3 |
| C | 0 | 15 | 138343 | 511.36 | 1151 | 1157 | 268.3 |
| D | 1 | 52 | 465363 | 1616.97 | 1173 | 1140 | 287.1 |
| D | 2 | 249 | 362797 | 1259.72 | 1173 | 1140 | 287.1 |
| D | 13 | 249 | 198651 | 687.97 | 1173 | 1140 | 287.1 |
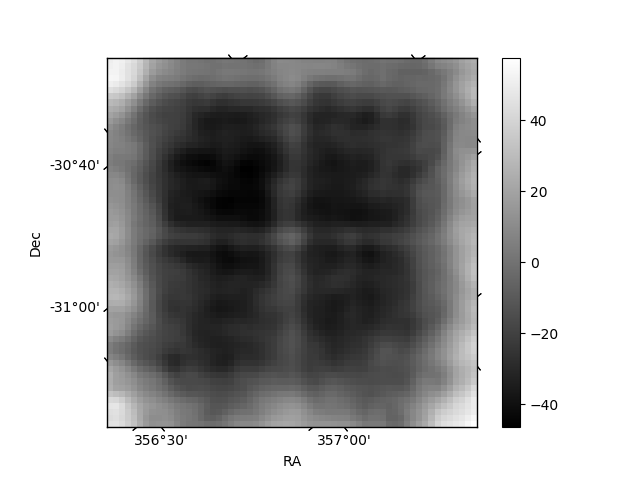
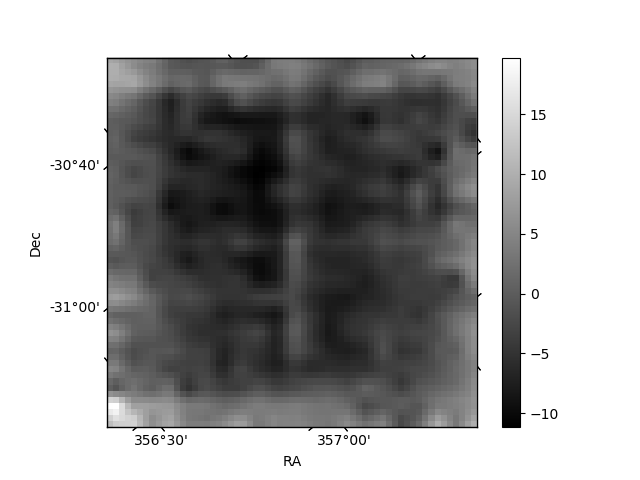
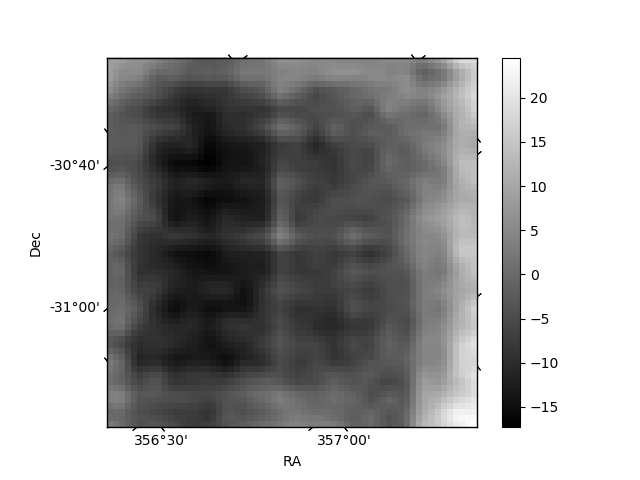
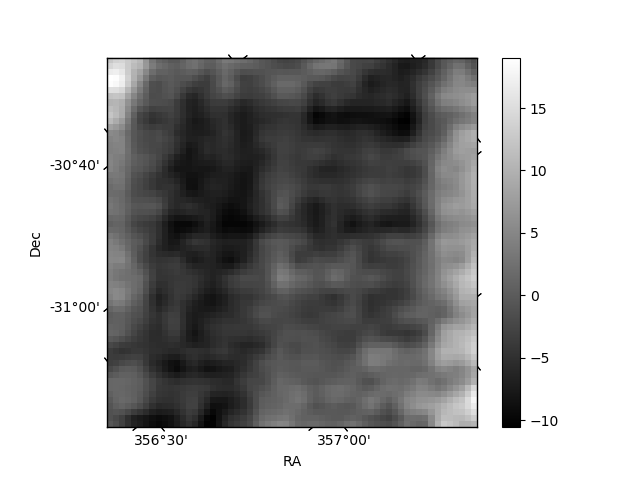
Histogram calculated using DETX and DETY for each event in the final _common_clean file
| Quadrant A | 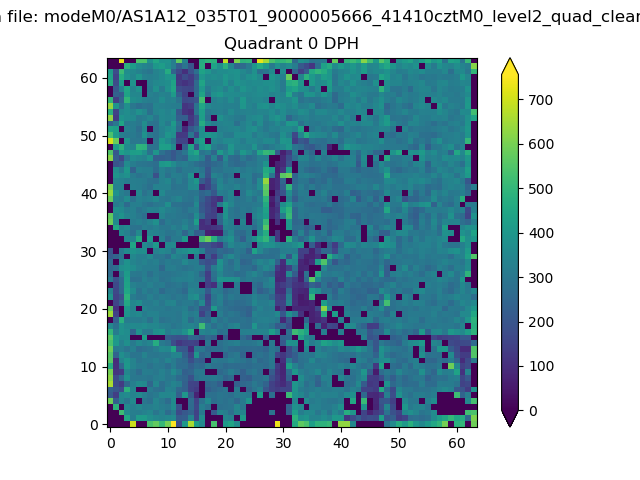 |
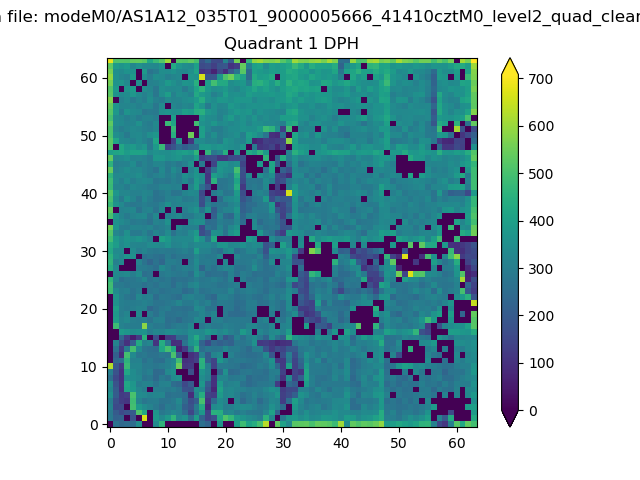 |
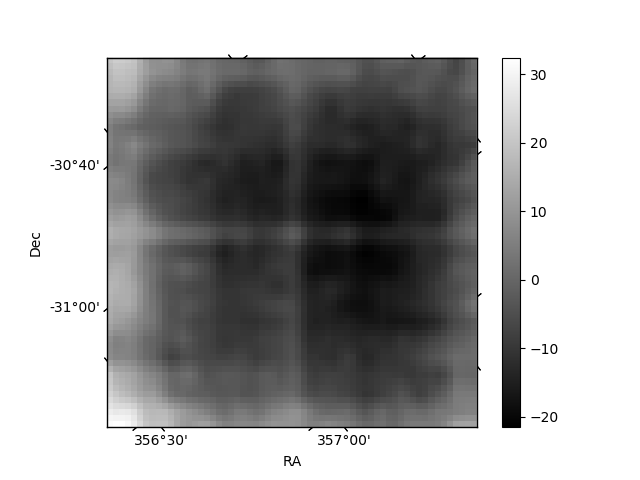
Quadrant B |
|---|---|---|---|
| Quadrant D | 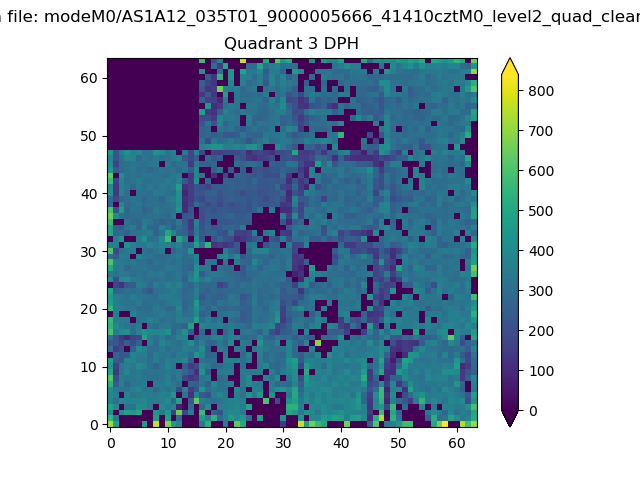 |
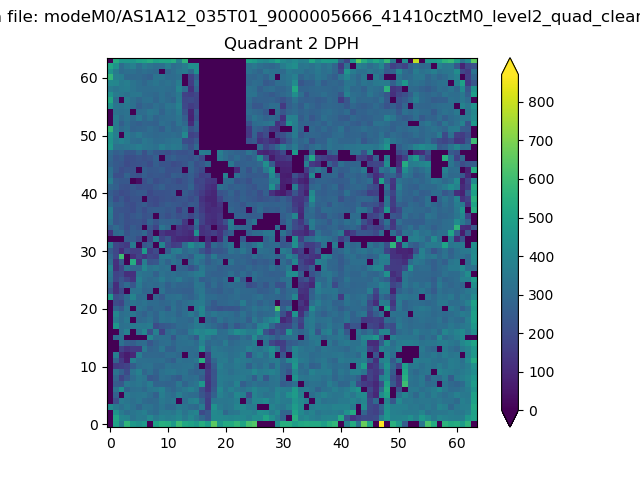 |
Quadrant C |
| Plot type | Count rate plots | Images |
|---|---|---|
| Comparison with Poisson distribution Blue bars denote a histogram of data divided into 1 sec bins. Red curve is a Poisson curve with rate = median count rate of data. |
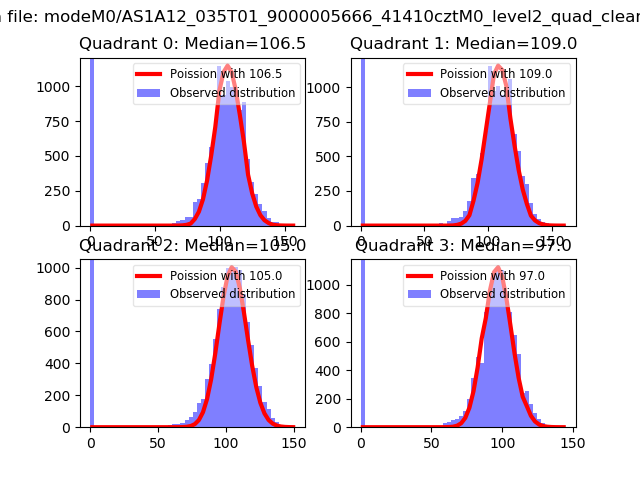 |
 |
| Quadrant-wise count rates Data is divided into 100 sec bins |
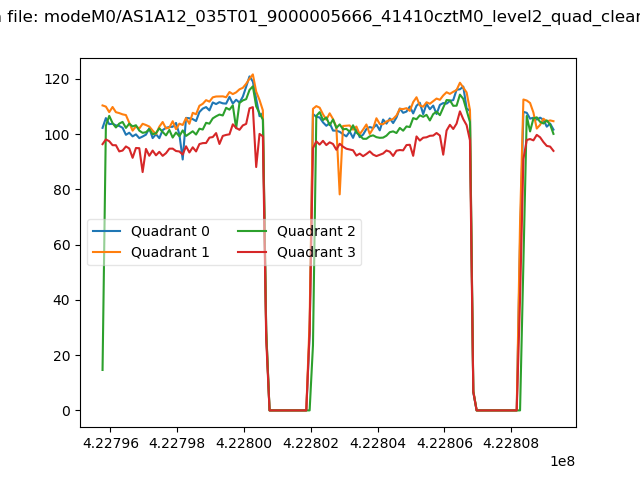 |
|
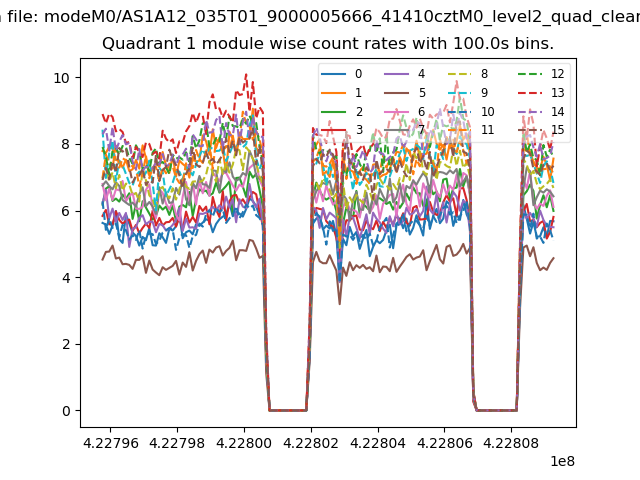
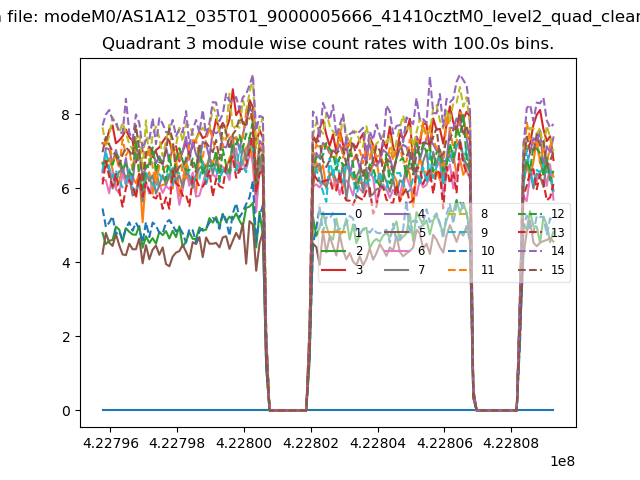
| Module-wise count rates for Quadrant A Data is divided into 100 sec bins |
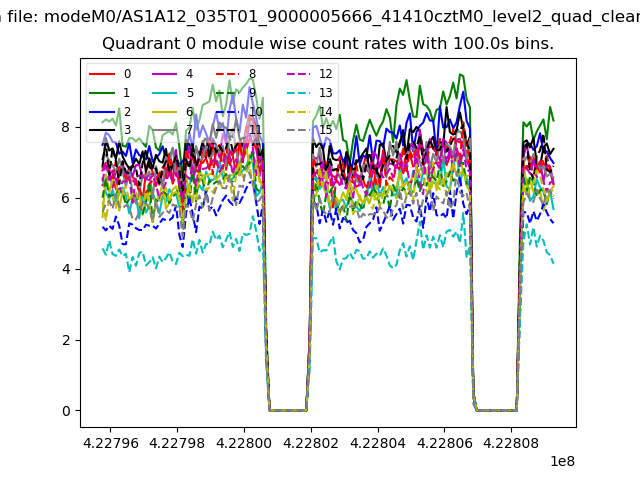 |
 |
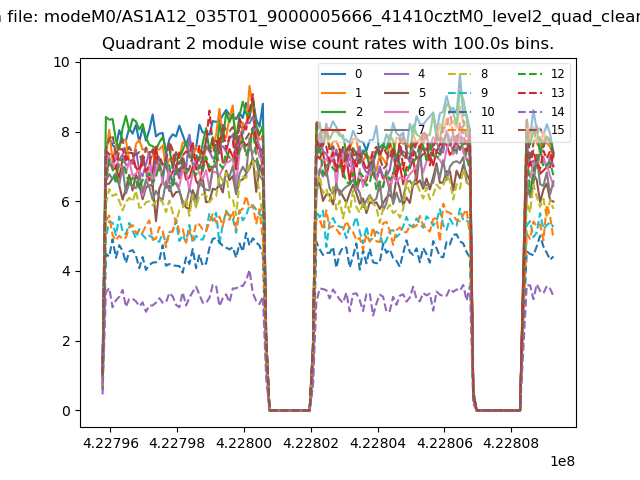
| Module-wise count rates for Quadrant B Data is divided into 100 sec bins |
 |
 |
| Module-wise count rates for Quadrant C Data is divided into 100 sec bins |
 |
 |
| Module-wise count rates for Quadrant D Data is divided into 100 sec bins |
 |
 |
| Parameter | Plot |
|---|---|
| CZT HV Monitor | 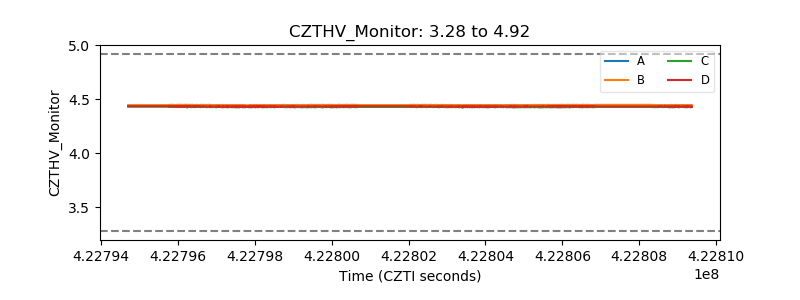 |
| D_VDD | 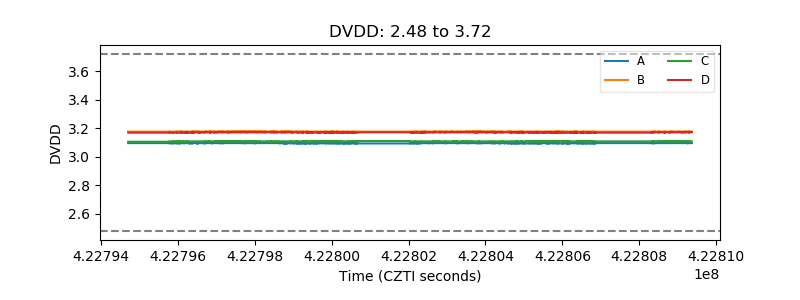 |
| Temperature 1 | 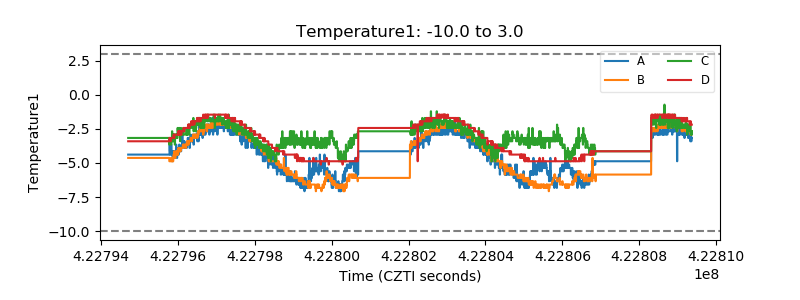 |
| Veto HV Monitor | 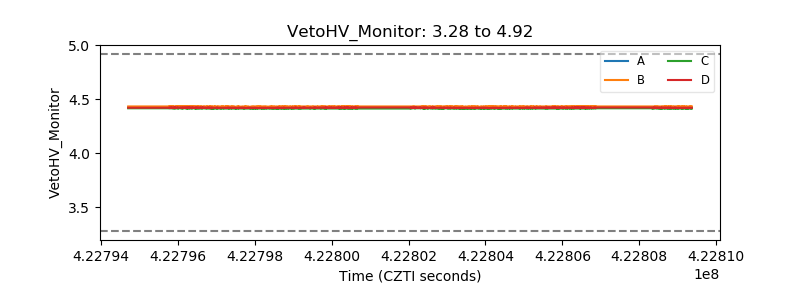 |
| Veto LLD | 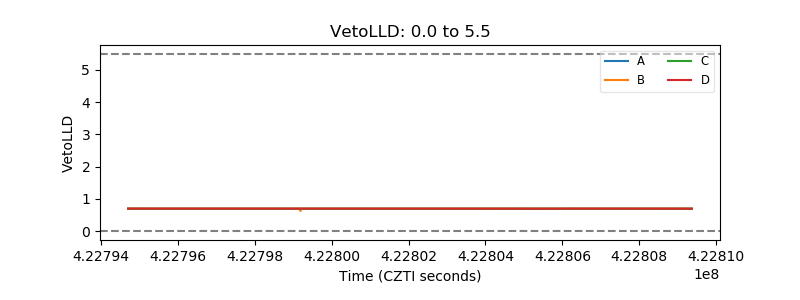 |
| Alpha Counter | 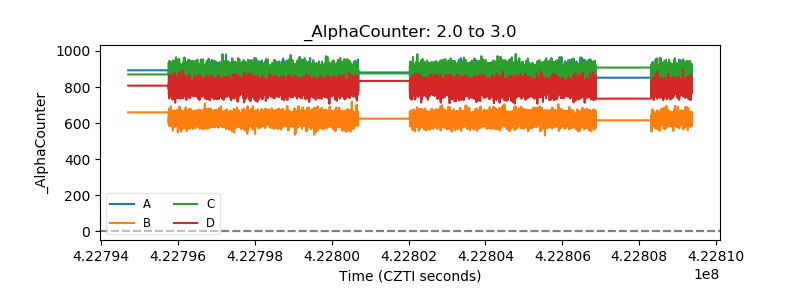 |
| _CPM_Rate | 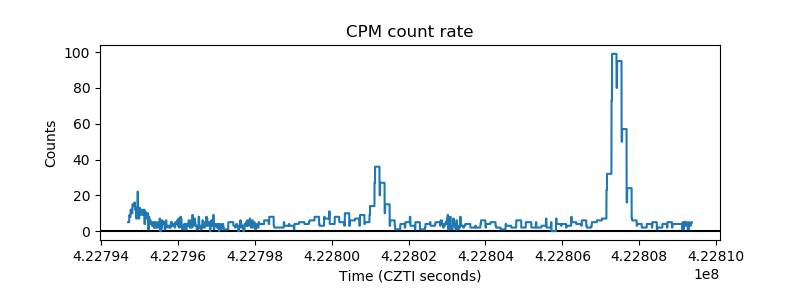 |
| CZT Counter | 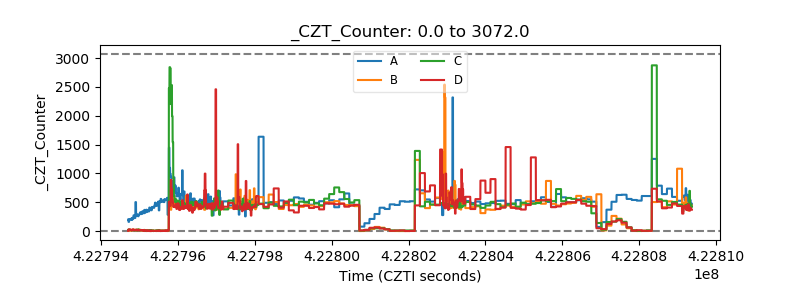 |
| +2.5 Volts monitor | 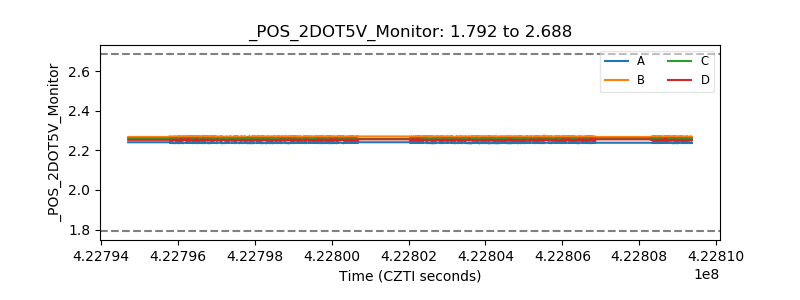 |
| +5 Volts monitor | 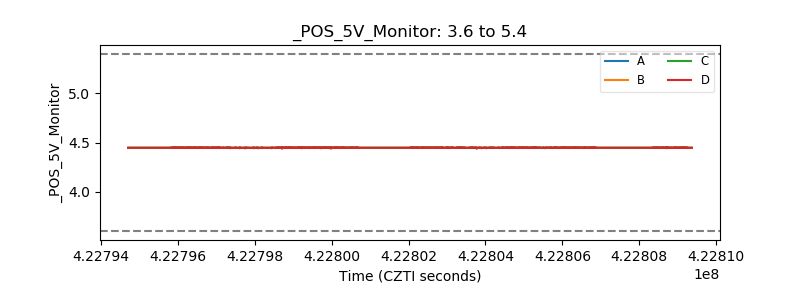 |
| _ROLL_ROT | 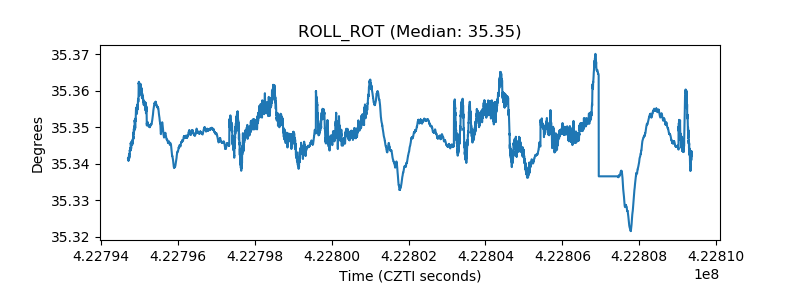 |
| _Roll_DEC | 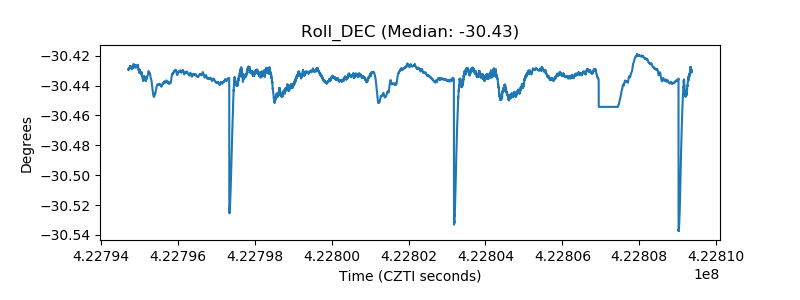 |
| _Roll_RA | 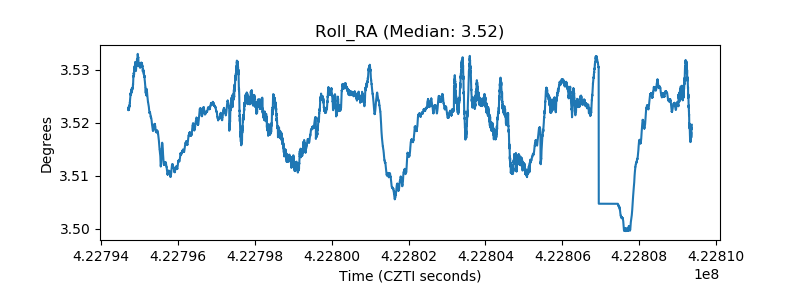 |
| Veto Counter | 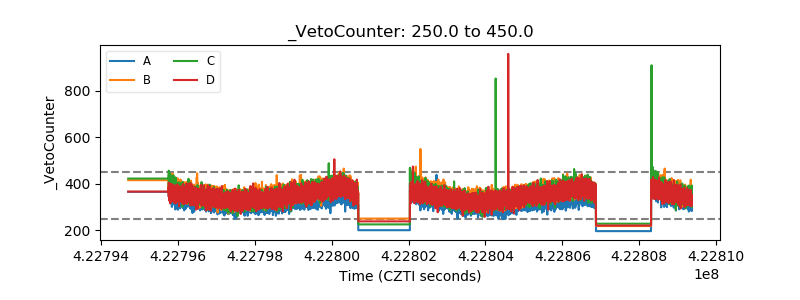 |