| Param | Original file | Final file |
|---|---|---|
| Filename | modeM0/AS1A12_035T01_9000005666_41412cztM0_level2.fits | modeM0/AS1A12_035T01_9000005666_41412cztM0_level2_quad_clean.evt |
| Size (bytes) | 334,814,400 | 90,120,960 |
| Size | 319.3 MB | 85.9 MB |
| Events in quadrant A | 3,081,279 | 612,013 |
| Events in quadrant B | 2,580,927 | 622,472 |
| Events in quadrant C | 3,129,082 | 562,551 |
| Events in quadrant D | 3,175,712 | 548,250 |
| Mode M0 | |||
|---|---|---|---|
| Quadrant | BADHDUFLAG | Total packets | Discarded packets |
| A | 0 | 12429 | 3 |
| B | 0 | 11406 | 2 |
| C | 0 | 12663 | 2 |
| D | 0 | 13076 | 2 |
| Mode SS | |||
|---|---|---|---|
| Quadrant | BADHDUFLAG | Total packets | Discarded packets |
| A | 0 | 112 | 0 |
| B | 0 | 112 | 0 |
| C | 0 | 112 | 0 |
| D | 0 | 112 | 0 |
| Mode M9 | |||
|---|---|---|---|
| Quadrant | BADHDUFLAG | Total packets | Discarded packets |
| A | 0 | 21 | 0 |
| B | 0 | 21 | 0 |
| C | 0 | 21 | 0 |
| D | 0 | 22 | 0 |
| Quadrant | Total seconds | Saturated seconds | Saturation percentage |
|---|---|---|---|
| A | 5477 | 18 | 0.328647% |
| B | 5477 | 18 | 0.328647% |
| C | 5477 | 237 | 4.327186% |
| D | 5477 | 62 | 1.132007% |
Noise dominated data is calculated using 1-second bins in cleaned event files. If a bin has >2000 counts, and if more than 50% of those come from <1% of pixels, then it is considered to be noise-dominated and hence unusable.
| Quadrant | # 1 sec bins | Bins with >0 counts | Bins with >2000 counts | High rate bins dominated by noise | Noise dominated (total time) | Noise dominated (detector-on time) | Marked lightcurve |
|---|---|---|---|---|---|---|---|
| A | 7179 | 5478 | 6 | 6 | 0.08% | 0.11% | 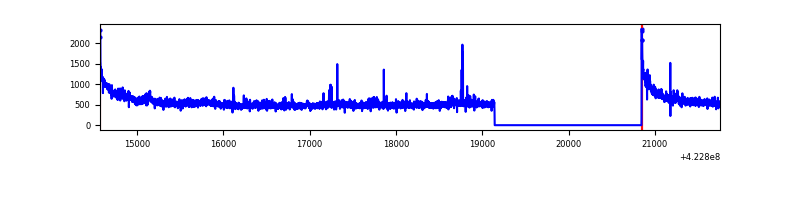 |
| B | 7179 | 5478 | 6 | 6 | 0.08% | 0.11% | 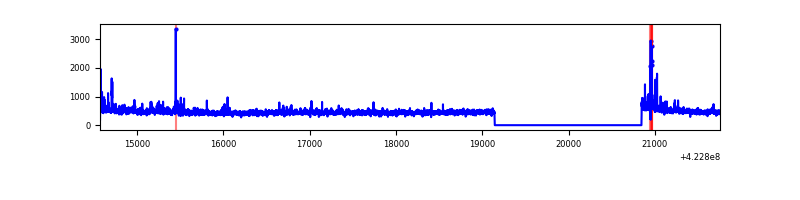 |
| C | 7179 | 5478 | 230 | 230 | 3.20% | 4.20% | 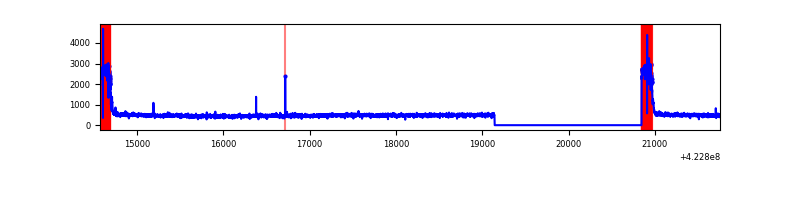 |
| D | 7179 | 5478 | 53 | 53 | 0.74% | 0.97% | 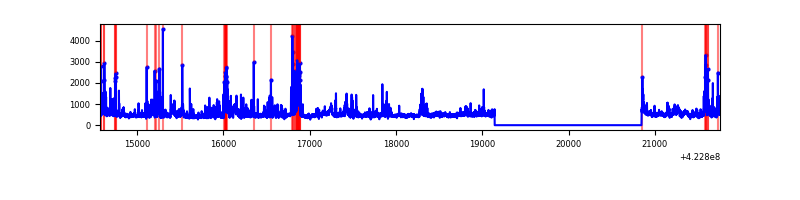 |
Top three noisy pixels from each quadrant. If the there are fewer than three noisy pixels in the level2.evt file, extra rows are filled as -1
| Pixel properties | Quadrant properties | ||||||
|---|---|---|---|---|---|---|---|
| Quadrant | DetID | PixID | Counts | Sigma | Mean | Median | Sigma |
| A | 10 | 83 | 537731 | 4245.76 | 613 | 600 | 126.5 |
| A | 2 | 79 | 85853 | 673.88 | 613 | 600 | 126.5 |
| A | 15 | 254 | 28645 | 221.68 | 613 | 600 | 126.5 |
| B | 0 | 190 | 97385 | 820.12 | 608 | 589 | 118.0 |
| B | 5 | 255 | 42398 | 354.23 | 608 | 589 | 118.0 |
| B | 0 | 189 | 30872 | 256.58 | 608 | 589 | 118.0 |
| C | 0 | 10 | 621338 | 4609.6 | 577 | 580 | 134.7 |
| C | 15 | 214 | 239216 | 1772.05 | 577 | 580 | 134.7 |
| C | 0 | 15 | 9622 | 67.14 | 577 | 580 | 134.7 |
| D | 1 | 52 | 516002 | 3537.91 | 595 | 578 | 145.7 |
| D | 12 | 79 | 148275 | 1013.8 | 595 | 578 | 145.7 |
| D | 2 | 249 | 146608 | 1002.36 | 595 | 578 | 145.7 |
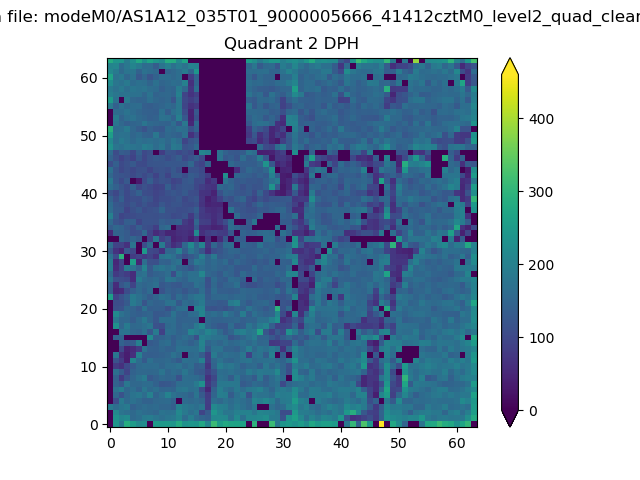
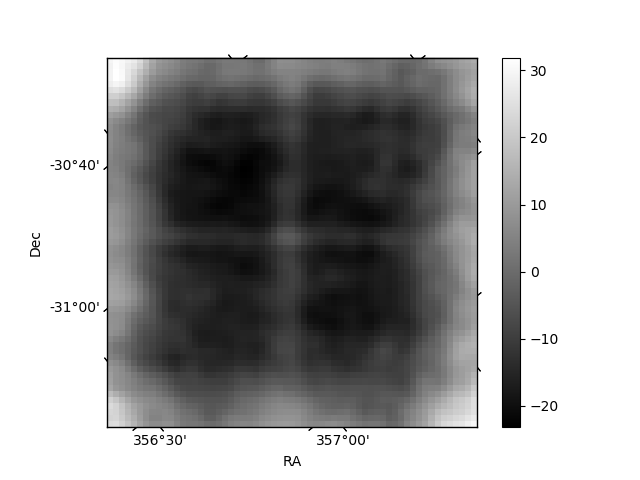
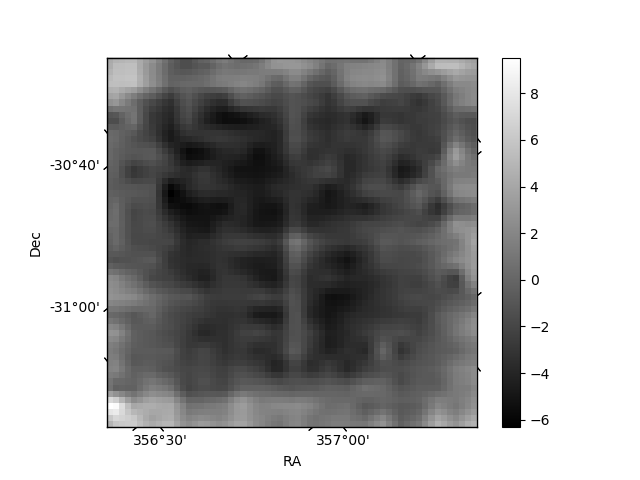
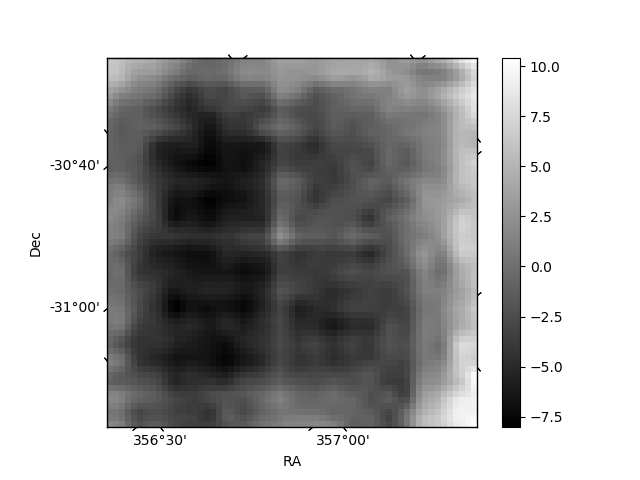
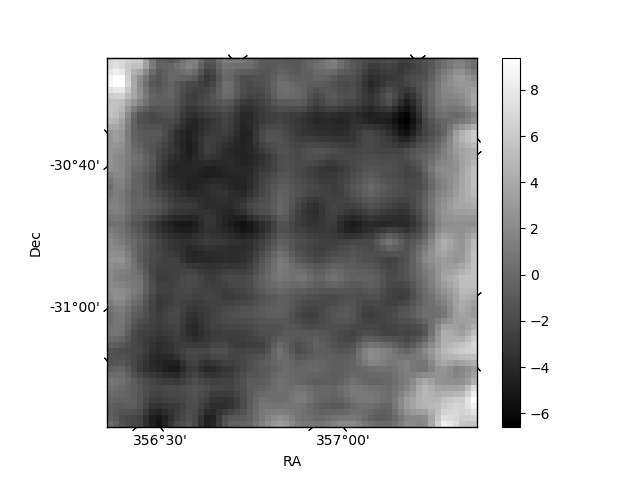
Histogram calculated using DETX and DETY for each event in the final _common_clean file
| Quadrant A | 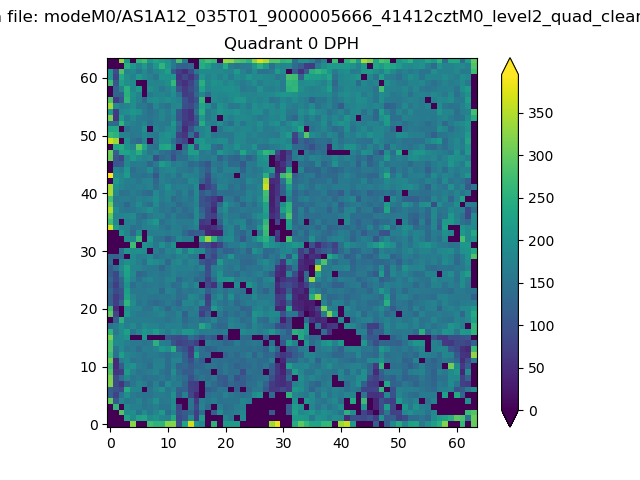 |
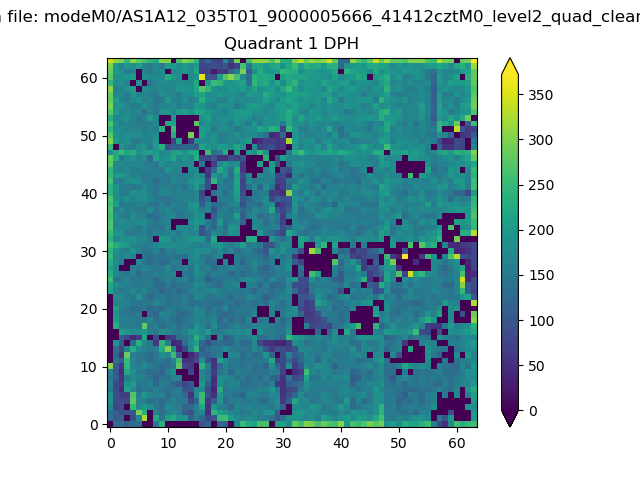 |
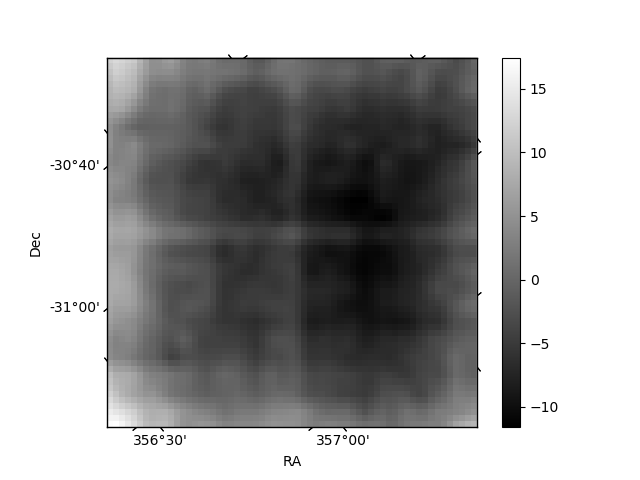
Quadrant B |
|---|---|---|---|
| Quadrant D | 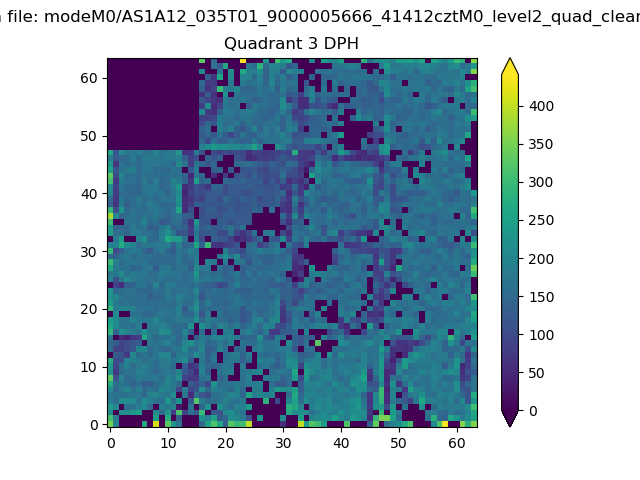 |
 |
Quadrant C |
| Plot type | Count rate plots | Images |
|---|---|---|
| Comparison with Poisson distribution Blue bars denote a histogram of data divided into 1 sec bins. Red curve is a Poisson curve with rate = median count rate of data. |
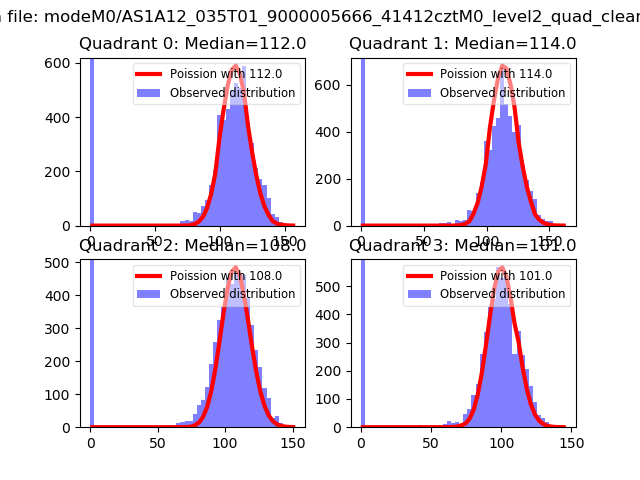 |
 |
| Quadrant-wise count rates Data is divided into 100 sec bins |
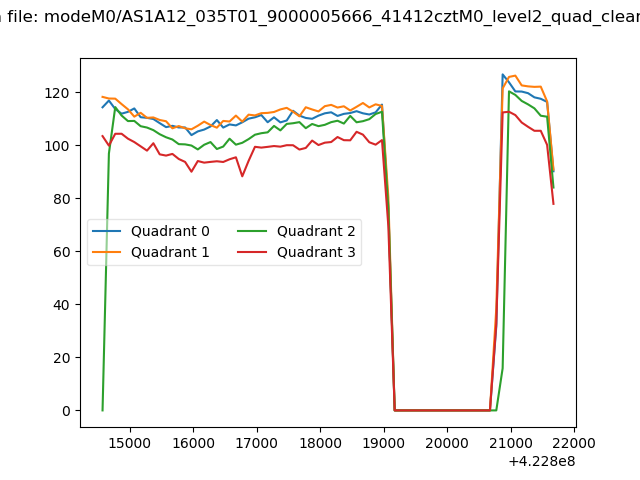 |
|
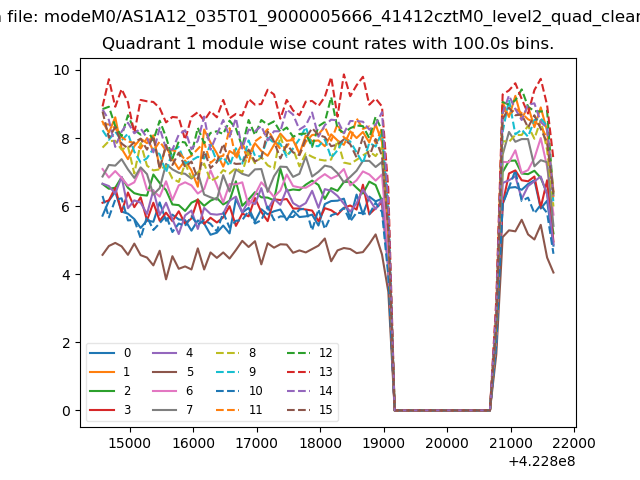
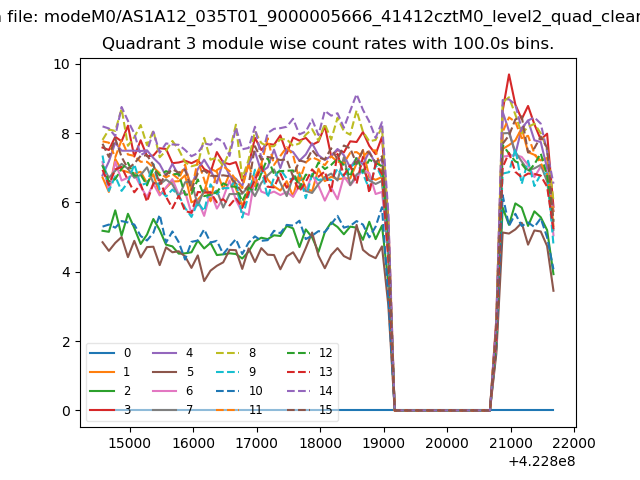
| Module-wise count rates for Quadrant A Data is divided into 100 sec bins |
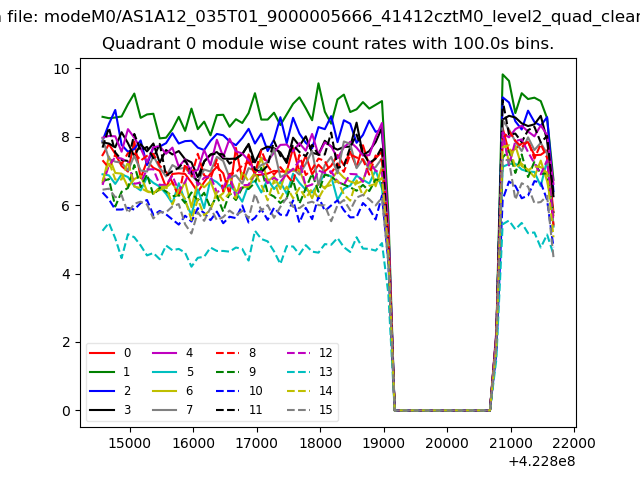 |
 |
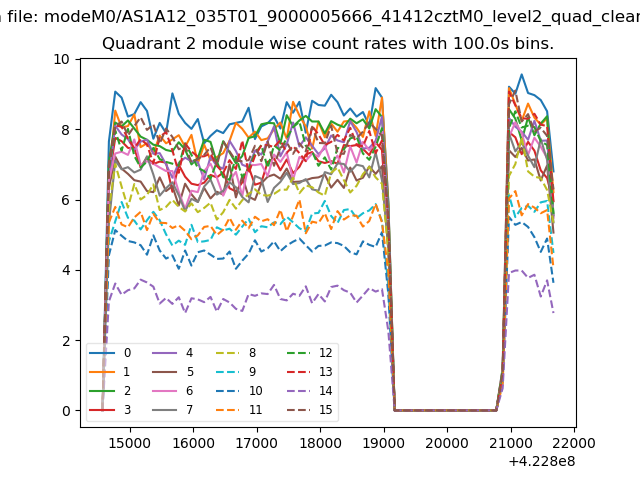
| Module-wise count rates for Quadrant B Data is divided into 100 sec bins |
 |
 |
| Module-wise count rates for Quadrant C Data is divided into 100 sec bins |
 |
 |
| Module-wise count rates for Quadrant D Data is divided into 100 sec bins |
 |
 |
| Parameter | Plot |
|---|---|
| CZT HV Monitor | 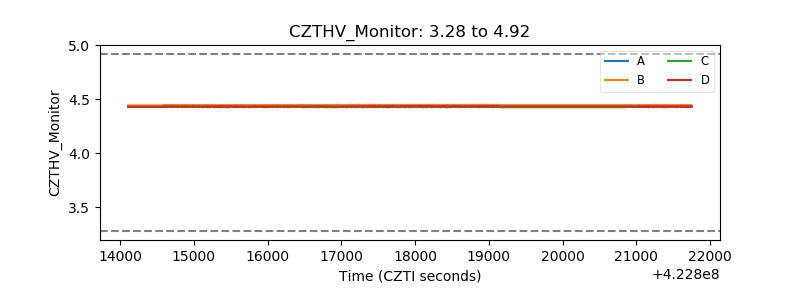 |
| D_VDD | 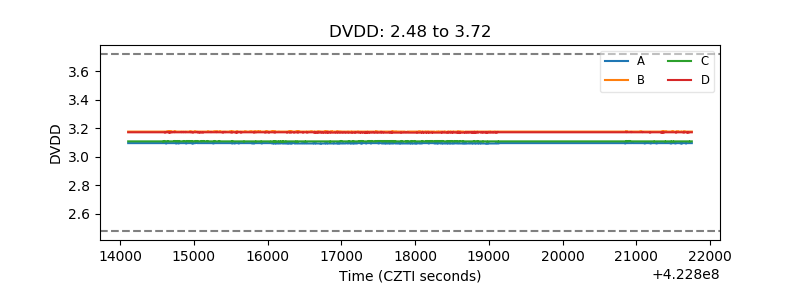 |
| Temperature 1 | 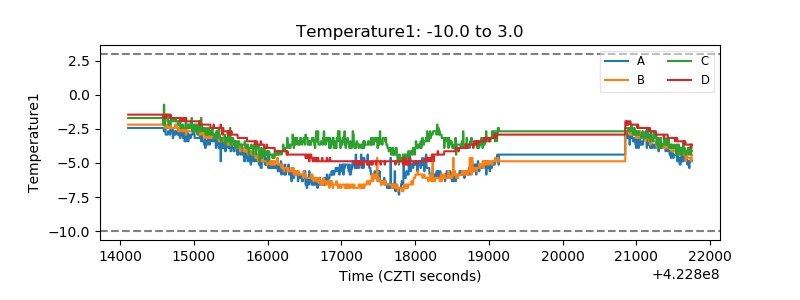 |
| Veto HV Monitor | 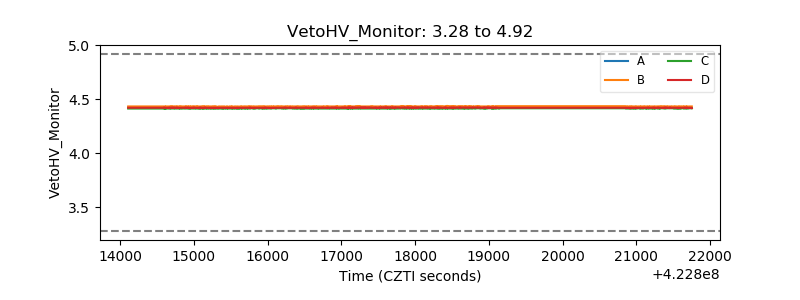 |
| Veto LLD | 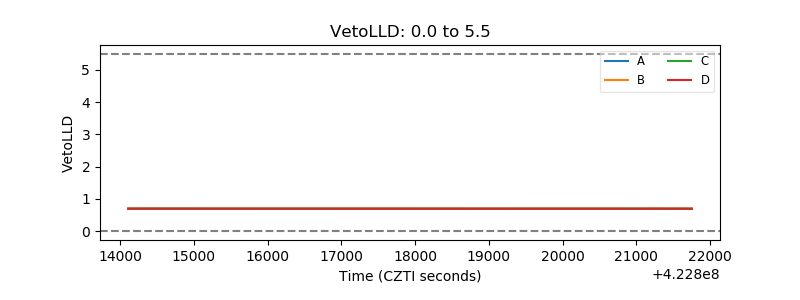 |
| Alpha Counter | 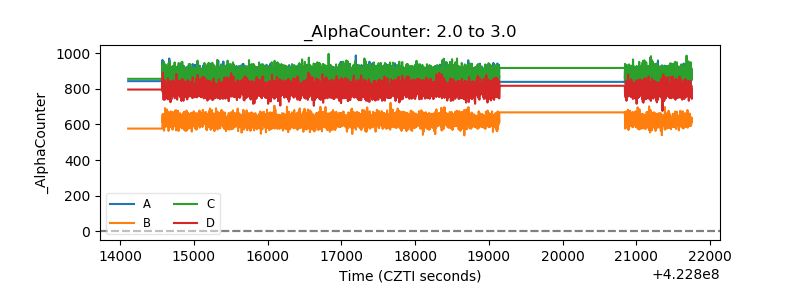 |
| _CPM_Rate | 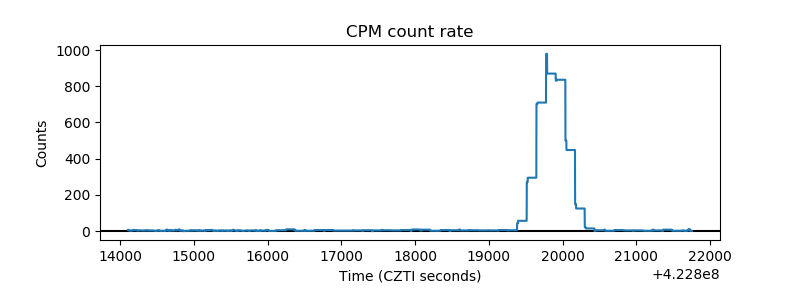 |
| CZT Counter | 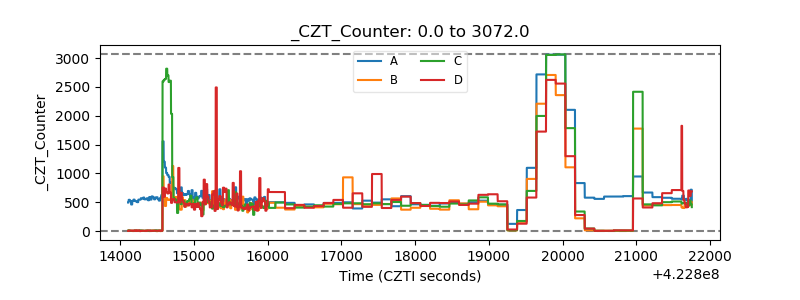 |
| +2.5 Volts monitor | 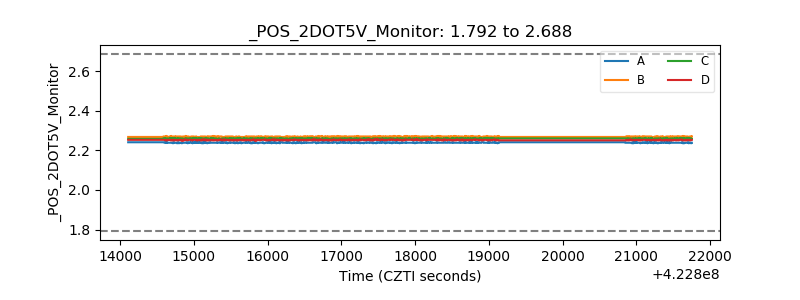 |
| +5 Volts monitor | 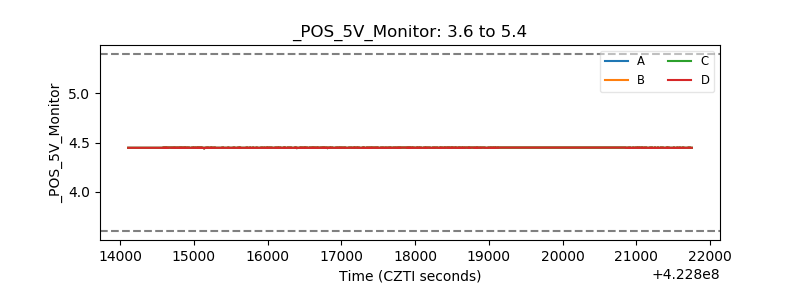 |
| _ROLL_ROT | 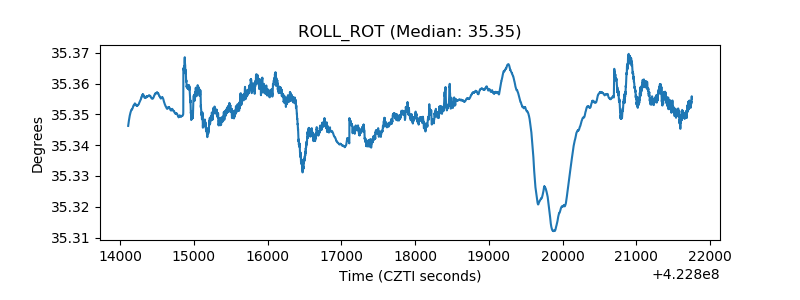 |
| _Roll_DEC | 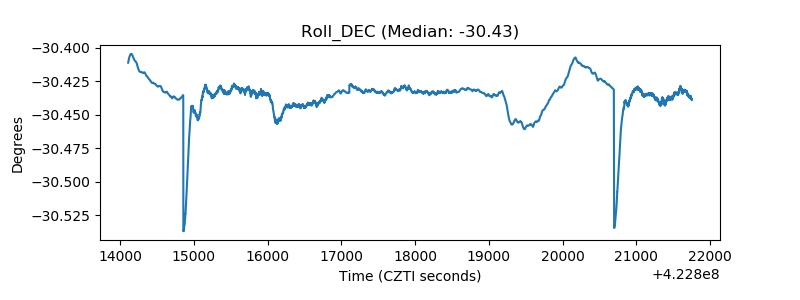 |
| _Roll_RA | 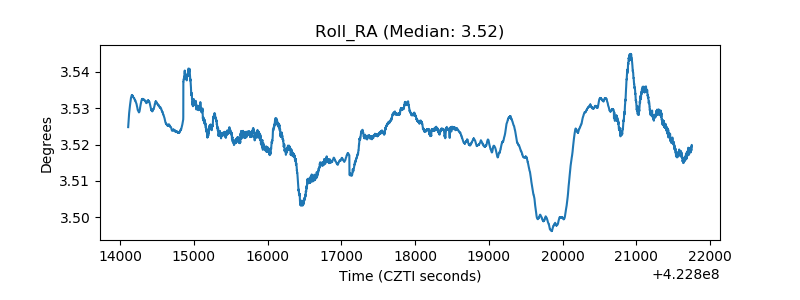 |
| Veto Counter | 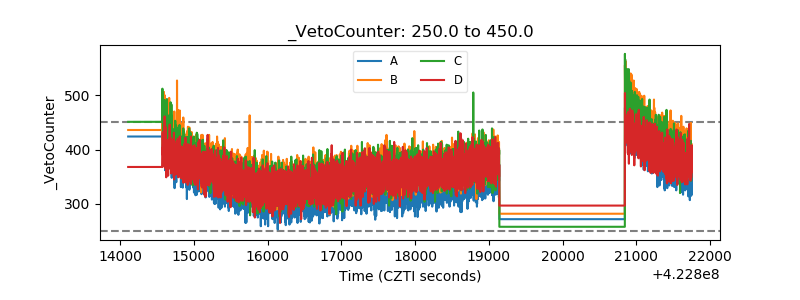 |