| Param | Original file | Final file |
|---|---|---|
| Filename | modeM0/AS1A12_035T01_9000005666_41414cztM0_level2.fits | modeM0/AS1A12_035T01_9000005666_41414cztM0_level2_quad_clean.evt |
| Size (bytes) | 384,940,800 | 91,218,240 |
| Size | 367.1 MB | 87.0 MB |
| Events in quadrant A | 3,044,161 | 634,578 |
| Events in quadrant B | 2,587,842 | 647,254 |
| Events in quadrant C | 3,489,162 | 575,909 |
| Events in quadrant D | 4,706,540 | 525,278 |
| Mode M0 | |||
|---|---|---|---|
| Quadrant | BADHDUFLAG | Total packets | Discarded packets |
| A | 0 | 12414 | 3 |
| B | 0 | 11307 | 2 |
| C | 0 | 13630 | 2 |
| D | 0 | 17650 | 2 |
| Mode SS | |||
|---|---|---|---|
| Quadrant | BADHDUFLAG | Total packets | Discarded packets |
| A | 0 | 112 | 0 |
| B | 0 | 112 | 0 |
| C | 0 | 112 | 0 |
| D | 0 | 112 | 0 |
| Mode M9 | |||
|---|---|---|---|
| Quadrant | BADHDUFLAG | Total packets | Discarded packets |
| A | 0 | 35 | 0 |
| B | 0 | 35 | 0 |
| C | 0 | 35 | 0 |
| D | 0 | 35 | 0 |
| Quadrant | Total seconds | Saturated seconds | Saturation percentage |
|---|---|---|---|
| A | 5418 | 20 | 0.369140% |
| B | 5418 | 17 | 0.313769% |
| C | 5418 | 308 | 5.684755% |
| D | 5418 | 484 | 8.933186% |
Noise dominated data is calculated using 1-second bins in cleaned event files. If a bin has >2000 counts, and if more than 50% of those come from <1% of pixels, then it is considered to be noise-dominated and hence unusable.
| Quadrant | # 1 sec bins | Bins with >0 counts | Bins with >2000 counts | High rate bins dominated by noise | Noise dominated (total time) | Noise dominated (detector-on time) | Marked lightcurve |
|---|---|---|---|---|---|---|---|
| A | 8943 | 5420 | 13 | 13 | 0.15% | 0.24% | 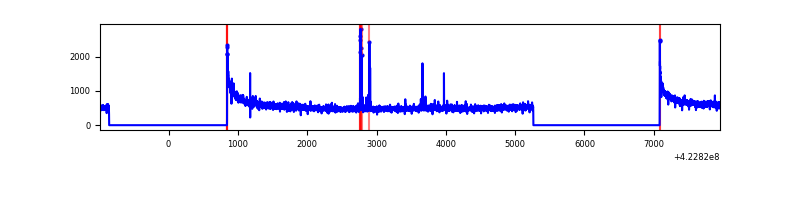 |
| B | 8943 | 5420 | 5 | 5 | 0.06% | 0.09% | 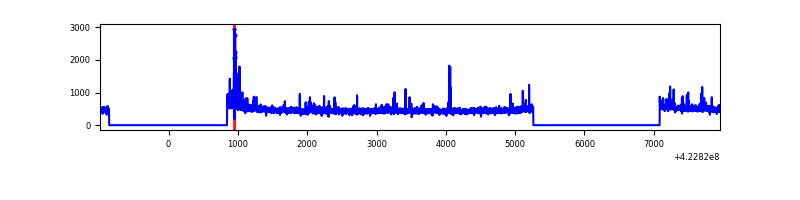 |
| C | 8943 | 5420 | 287 | 287 | 3.21% | 5.30% | 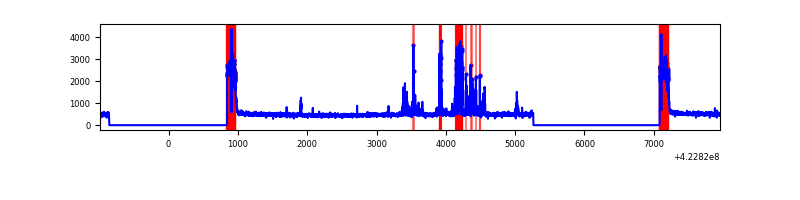 |
| D | 8943 | 5420 | 400 | 400 | 4.47% | 7.38% | 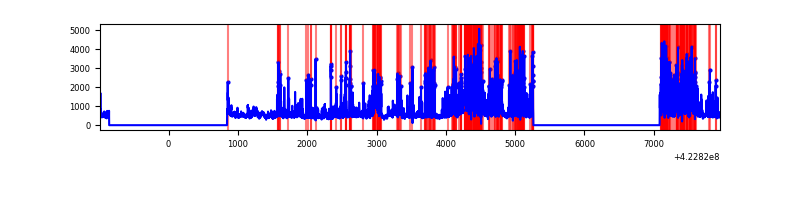 |
Top three noisy pixels from each quadrant. If the there are fewer than three noisy pixels in the level2.evt file, extra rows are filled as -1
| Pixel properties | Quadrant properties | ||||||
|---|---|---|---|---|---|---|---|
| Quadrant | DetID | PixID | Counts | Sigma | Mean | Median | Sigma |
| A | 10 | 83 | 522863 | 4131.6 | 618 | 605 | 126.4 |
| A | 2 | 79 | 41738 | 325.4 | 618 | 605 | 126.4 |
| A | 13 | 248 | 40831 | 318.23 | 618 | 605 | 126.4 |
| B | 5 | 255 | 67312 | 560.79 | 616 | 598 | 119.0 |
| B | 0 | 190 | 60523 | 503.73 | 616 | 598 | 119.0 |
| B | 0 | 189 | 24517 | 201.06 | 616 | 598 | 119.0 |
| C | 0 | 10 | 610191 | 4483.05 | 583 | 587 | 136.0 |
| C | 15 | 214 | 235507 | 1727.61 | 583 | 587 | 136.0 |
| C | 15 | 111 | 195222 | 1431.35 | 583 | 587 | 136.0 |
| D | 1 | 47 | 1629525 | 11434.04 | 584 | 567 | 142.5 |
| D | 1 | 52 | 229903 | 1609.76 | 584 | 567 | 142.5 |
| D | 13 | 249 | 189712 | 1327.65 | 584 | 567 | 142.5 |
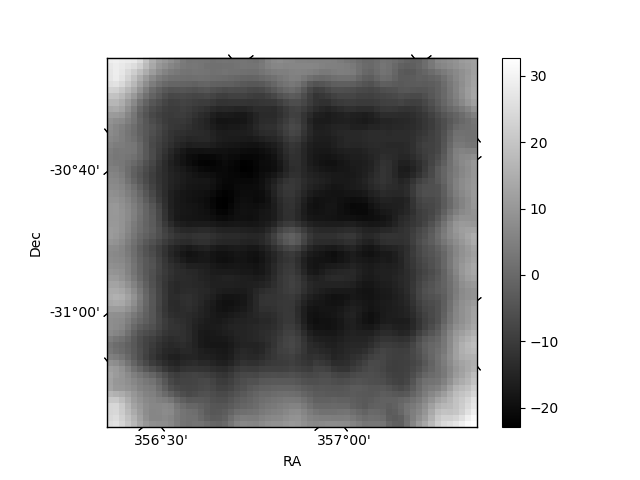
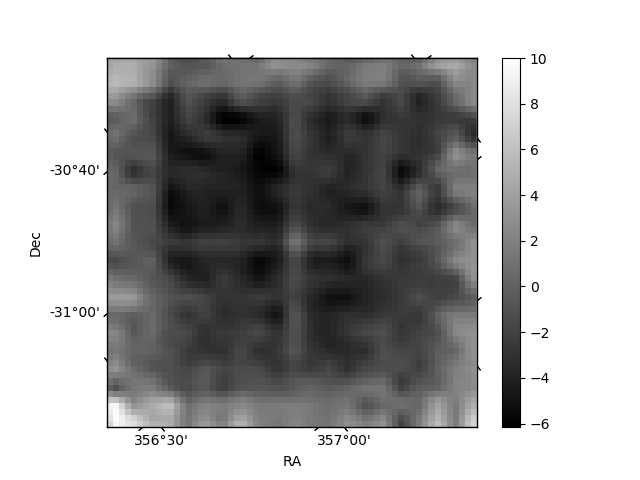
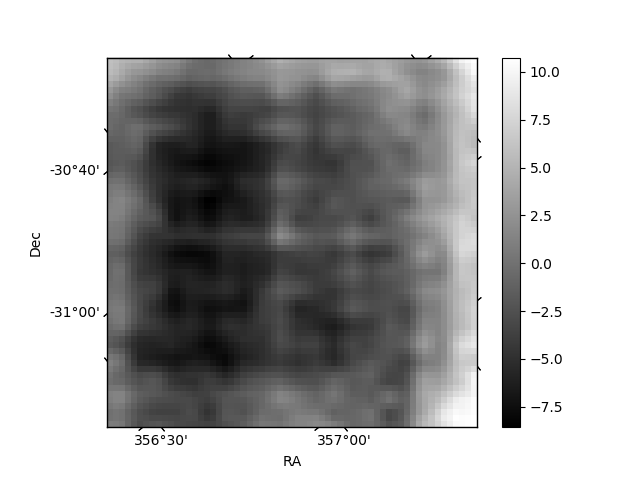
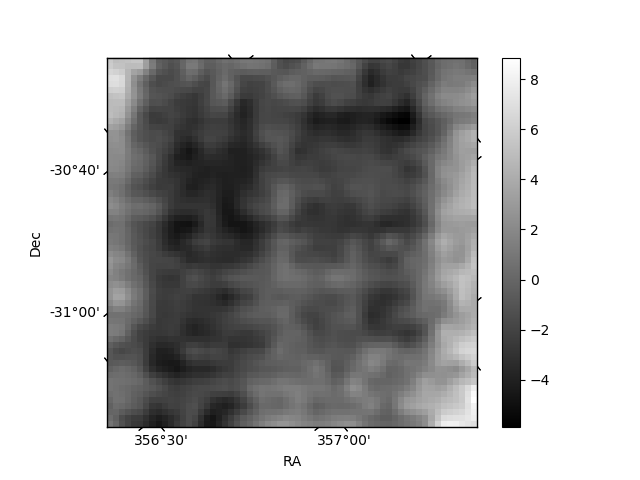
Histogram calculated using DETX and DETY for each event in the final _common_clean file
| Quadrant A | 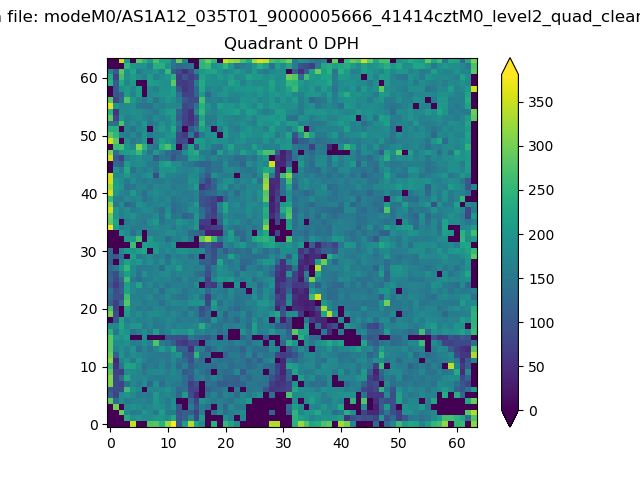 |
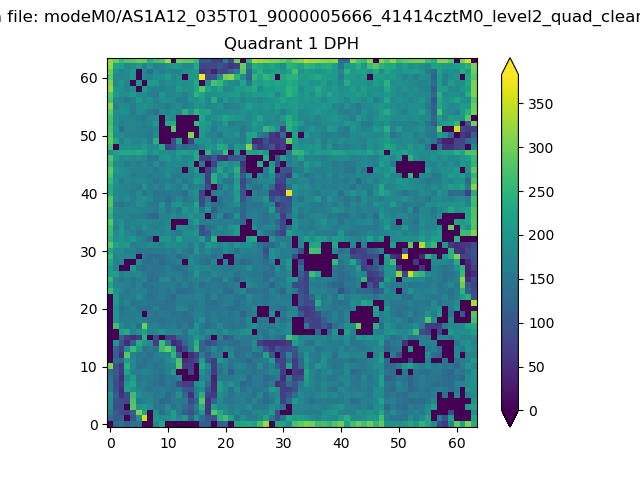 |
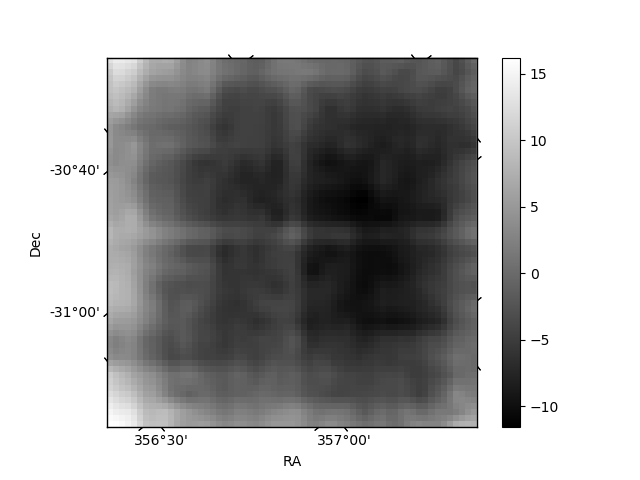
Quadrant B |
|---|---|---|---|
| Quadrant D | 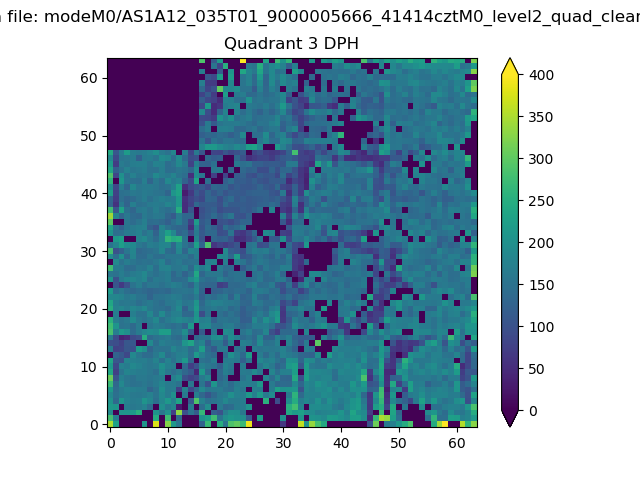 |
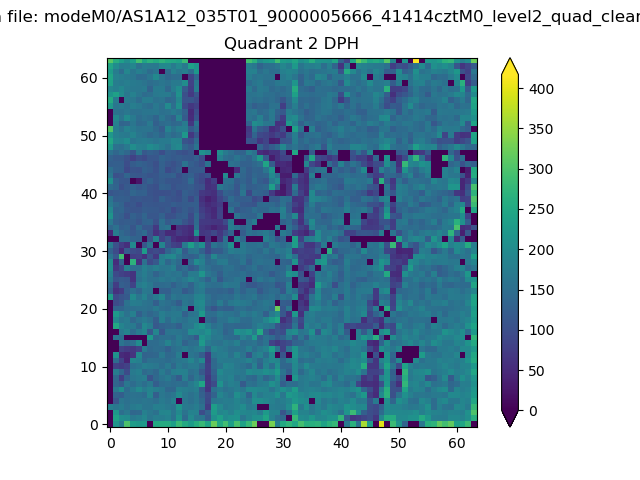 |
Quadrant C |
| Plot type | Count rate plots | Images |
|---|---|---|
| Comparison with Poisson distribution Blue bars denote a histogram of data divided into 1 sec bins. Red curve is a Poisson curve with rate = median count rate of data. |
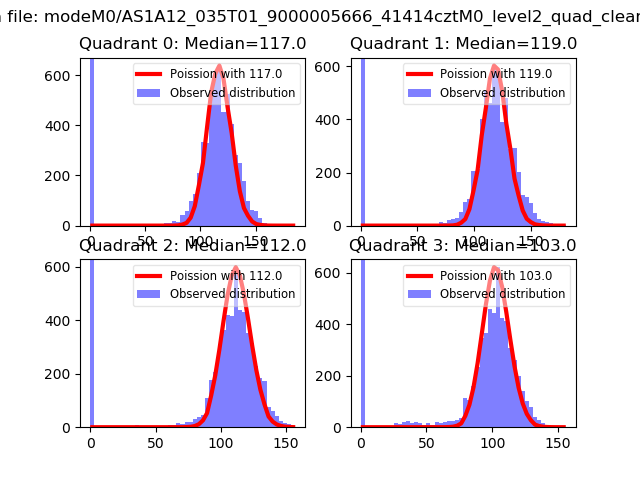 |
 |
| Quadrant-wise count rates Data is divided into 100 sec bins |
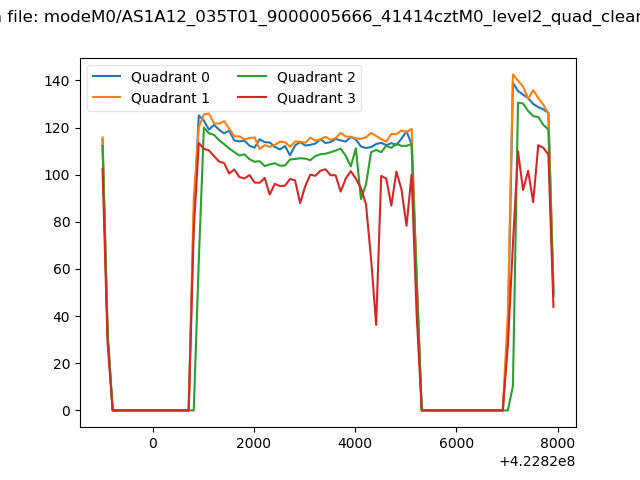 |
|
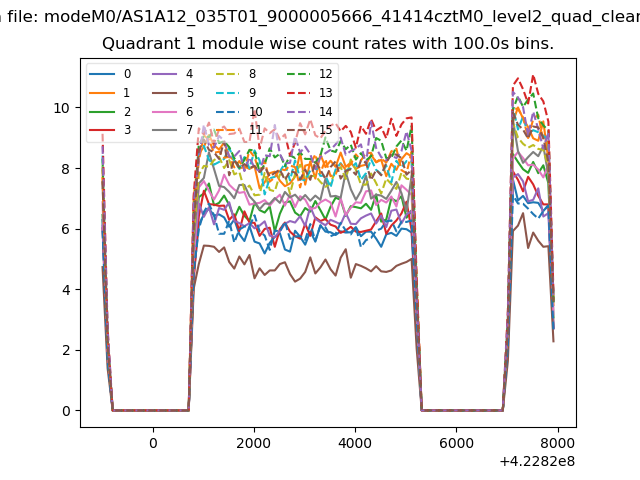
| Module-wise count rates for Quadrant A Data is divided into 100 sec bins |
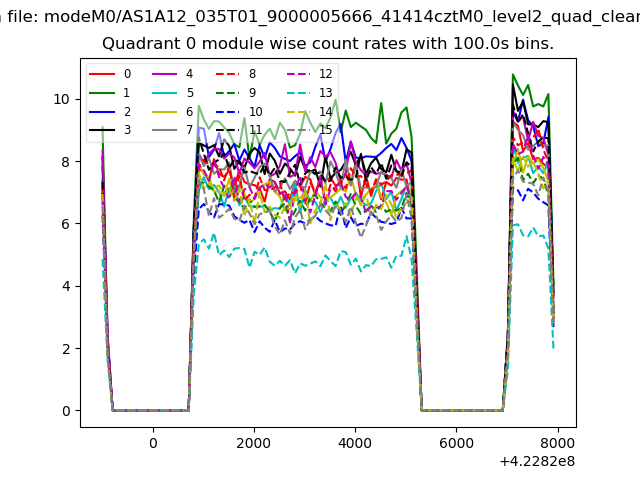 |
 |
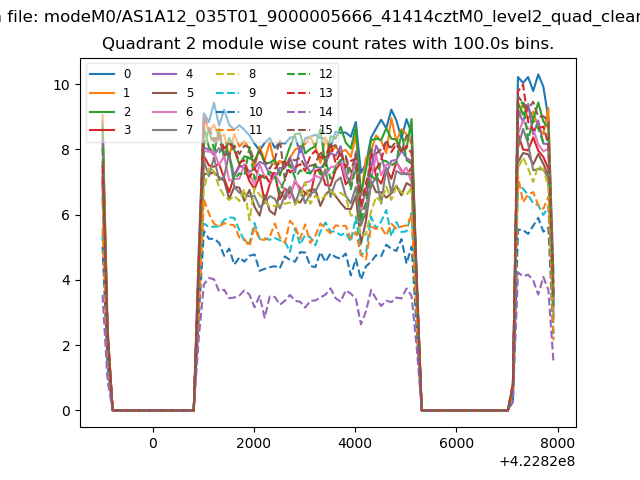
| Module-wise count rates for Quadrant B Data is divided into 100 sec bins |
 |
 |
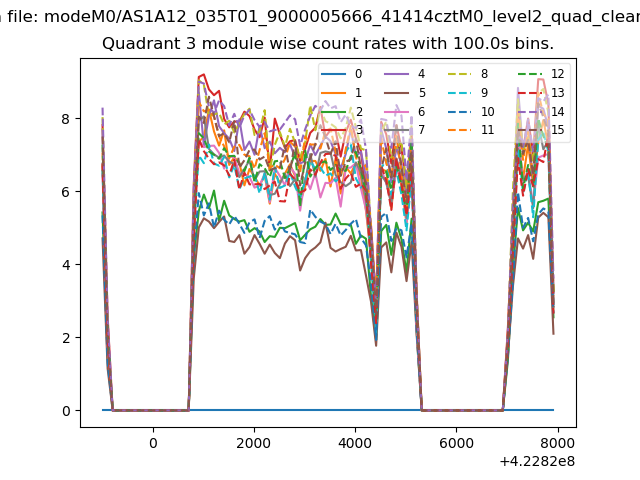
| Module-wise count rates for Quadrant C Data is divided into 100 sec bins |
 |
 |
| Module-wise count rates for Quadrant D Data is divided into 100 sec bins |
 |
 |
| Parameter | Plot |
|---|---|
| CZT HV Monitor | 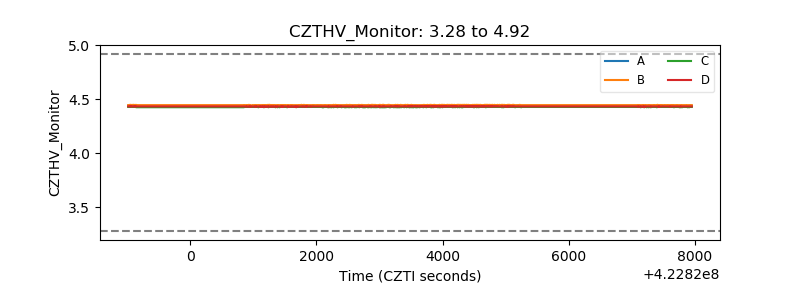 |
| D_VDD | 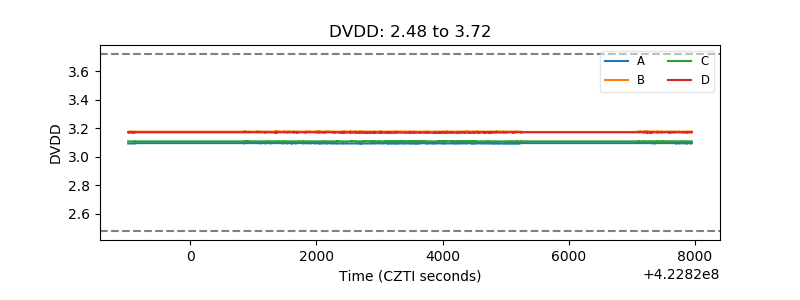 |
| Temperature 1 | 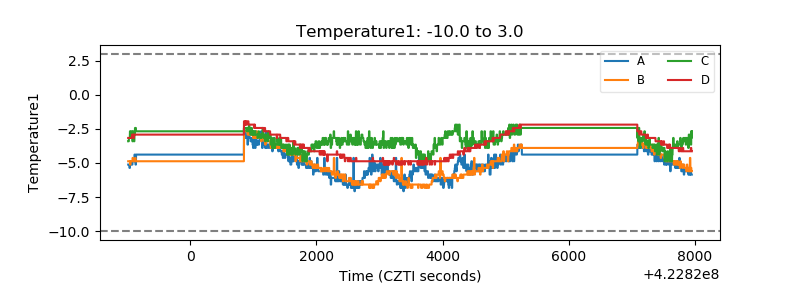 |
| Veto HV Monitor | 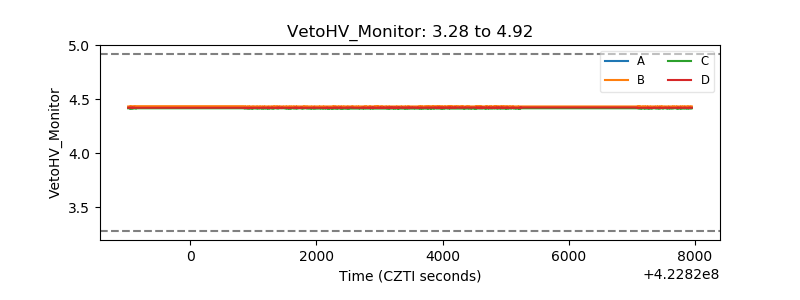 |
| Veto LLD | 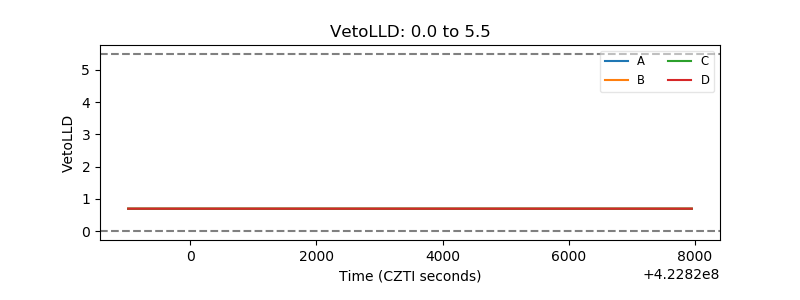 |
| Alpha Counter | 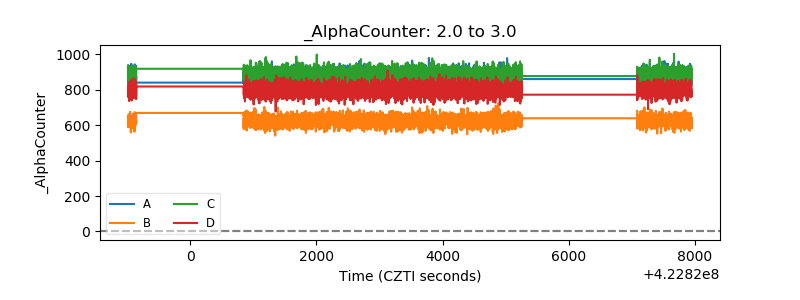 |
| _CPM_Rate | 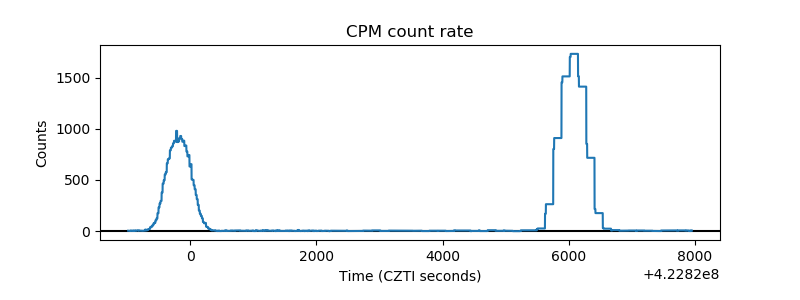 |
| CZT Counter | 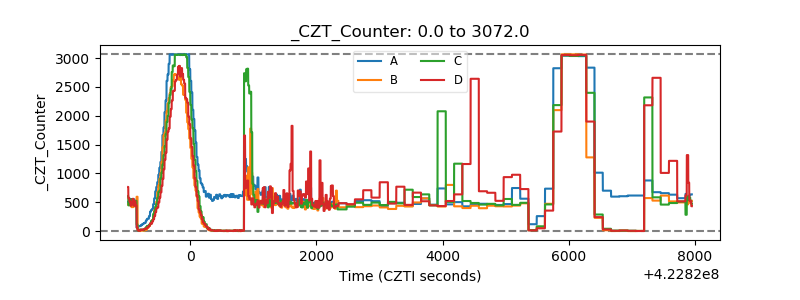 |
| +2.5 Volts monitor | 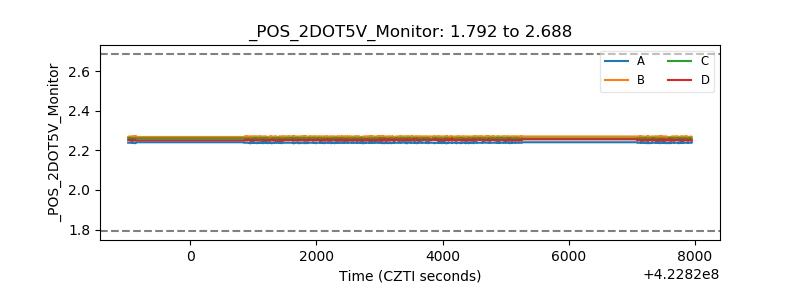 |
| +5 Volts monitor | 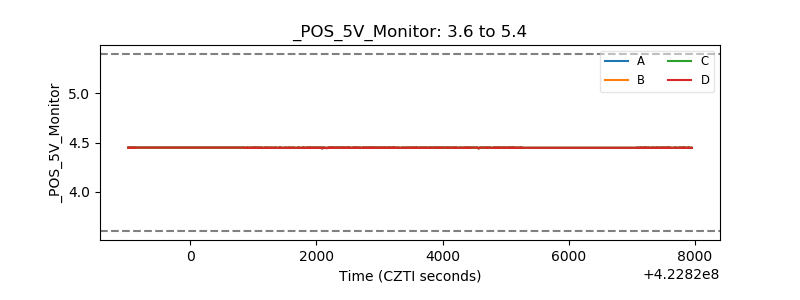 |
| _ROLL_ROT | 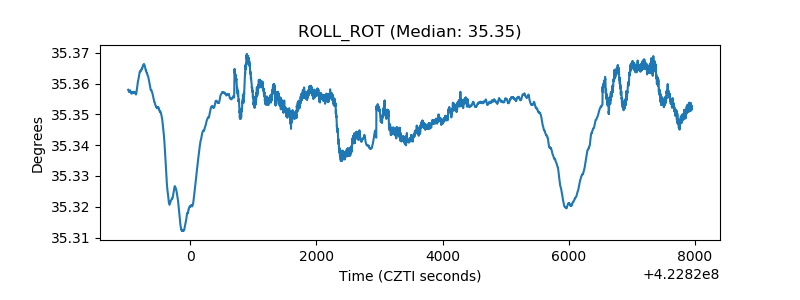 |
| _Roll_DEC | 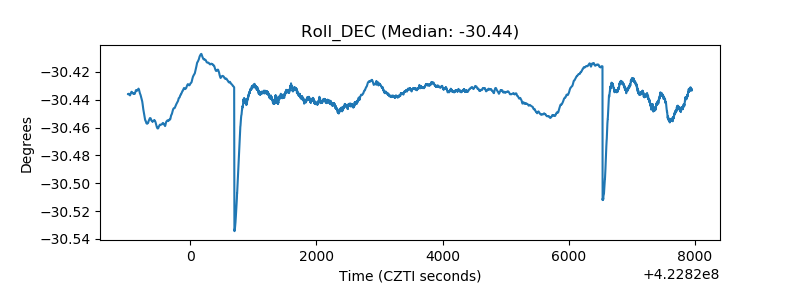 |
| _Roll_RA | 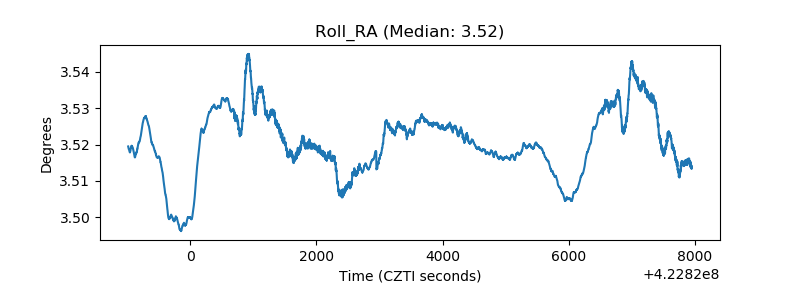 |
| Veto Counter | 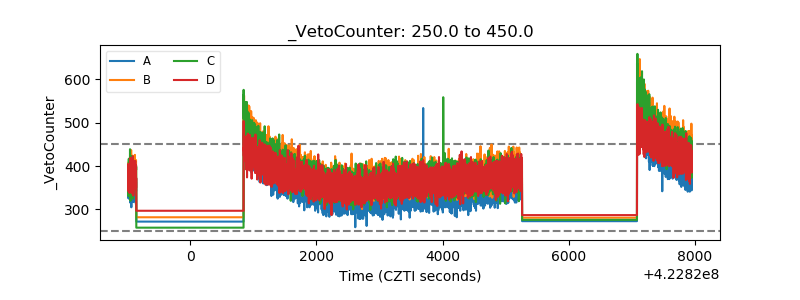 |