| Param | Original file | Final file |
|---|---|---|
| Filename | modeM0/AS1A12_035T01_9000005666_41415cztM0_level2.fits | modeM0/AS1A12_035T01_9000005666_41415cztM0_level2_quad_clean.evt |
| Size (bytes) | 356,264,640 | 90,708,480 |
| Size | 339.8 MB | 86.5 MB |
| Events in quadrant A | 2,981,653 | 628,090 |
| Events in quadrant B | 2,558,919 | 643,424 |
| Events in quadrant C | 3,244,596 | 577,990 |
| Events in quadrant D | 4,002,324 | 536,857 |
| Mode M0 | |||
|---|---|---|---|
| Quadrant | BADHDUFLAG | Total packets | Discarded packets |
| A | 0 | 11961 | 3 |
| B | 0 | 10882 | 2 |
| C | 0 | 12597 | 2 |
| D | 0 | 15345 | 2 |
| Mode SS | |||
|---|---|---|---|
| Quadrant | BADHDUFLAG | Total packets | Discarded packets |
| A | 0 | 106 | 0 |
| B | 0 | 106 | 0 |
| C | 0 | 106 | 0 |
| D | 0 | 106 | 0 |
| Mode M9 | |||
|---|---|---|---|
| Quadrant | BADHDUFLAG | Total packets | Discarded packets |
| A | 0 | 34 | 0 |
| B | 0 | 34 | 0 |
| C | 0 | 34 | 0 |
| D | 0 | 35 | 0 |
| Quadrant | Total seconds | Saturated seconds | Saturation percentage |
|---|---|---|---|
| A | 5141 | 19 | 0.369578% |
| B | 5141 | 39 | 0.758607% |
| C | 5141 | 263 | 5.115736% |
| D | 5141 | 326 | 6.341179% |
Noise dominated data is calculated using 1-second bins in cleaned event files. If a bin has >2000 counts, and if more than 50% of those come from <1% of pixels, then it is considered to be noise-dominated and hence unusable.
| Quadrant | # 1 sec bins | Bins with >0 counts | Bins with >2000 counts | High rate bins dominated by noise | Noise dominated (total time) | Noise dominated (detector-on time) | Marked lightcurve |
|---|---|---|---|---|---|---|---|
| A | 7084 | 5142 | 4 | 4 | 0.06% | 0.08% | 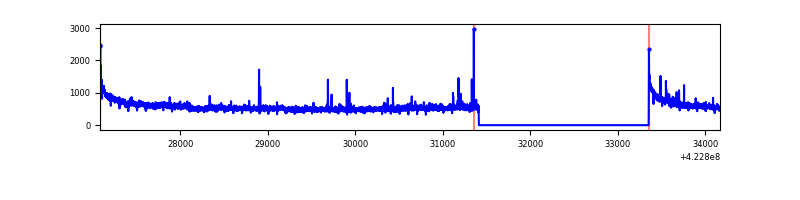 |
| B | 7084 | 5142 | 26 | 26 | 0.37% | 0.51% | 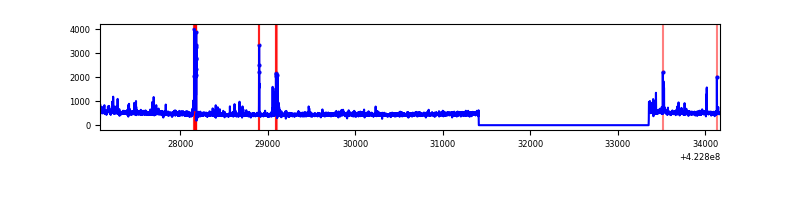 |
| C | 7084 | 5142 | 254 | 254 | 3.59% | 4.94% | 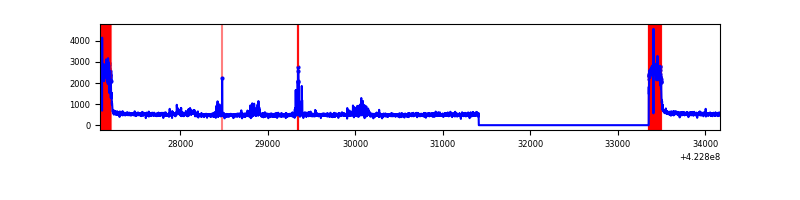 |
| D | 7084 | 5142 | 274 | 274 | 3.87% | 5.33% | 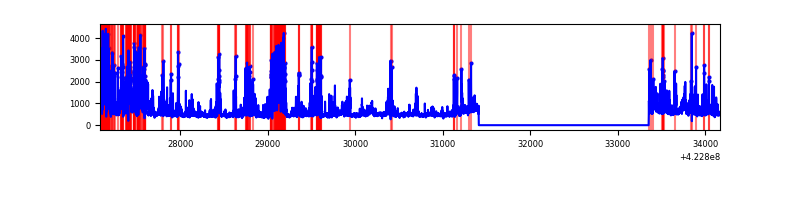 |
Top three noisy pixels from each quadrant. If the there are fewer than three noisy pixels in the level2.evt file, extra rows are filled as -1
| Pixel properties | Quadrant properties | ||||||
|---|---|---|---|---|---|---|---|
| Quadrant | DetID | PixID | Counts | Sigma | Mean | Median | Sigma |
| A | 10 | 83 | 500154 | 4037.17 | 602 | 591 | 123.7 |
| A | 2 | 79 | 120012 | 965.09 | 602 | 591 | 123.7 |
| A | 13 | 6 | 11176 | 85.54 | 602 | 591 | 123.7 |
| B | 0 | 190 | 110337 | 957.33 | 601 | 585 | 114.6 |
| B | 5 | 255 | 67198 | 581.04 | 601 | 585 | 114.6 |
| B | 12 | 111 | 14576 | 122.04 | 601 | 585 | 114.6 |
| C | 0 | 10 | 660391 | 4985.08 | 569 | 574 | 132.4 |
| C | 15 | 214 | 223430 | 1683.73 | 569 | 574 | 132.4 |
| C | 15 | 111 | 83162 | 623.97 | 569 | 574 | 132.4 |
| D | 1 | 47 | 923092 | 6582.74 | 577 | 560 | 140.1 |
| D | 2 | 249 | 327905 | 2335.77 | 577 | 560 | 140.1 |
| D | 5 | 222 | 261235 | 1860.05 | 577 | 560 | 140.1 |
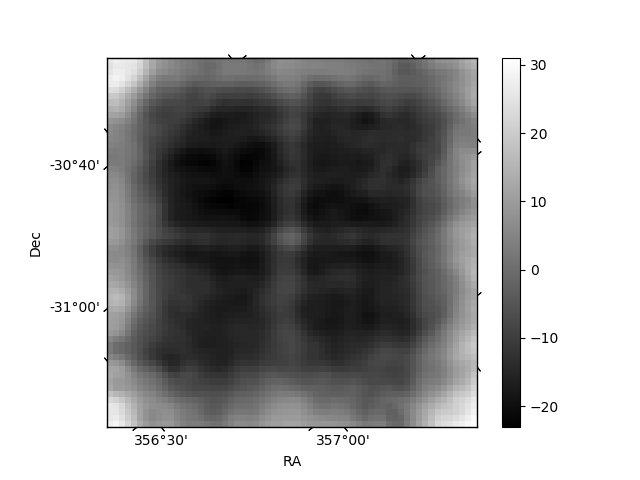
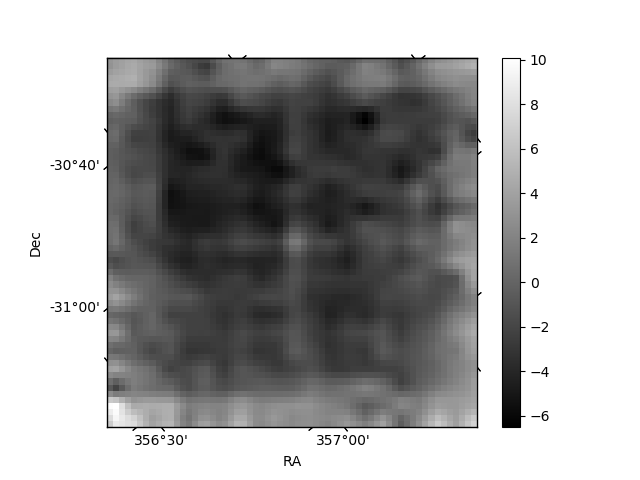
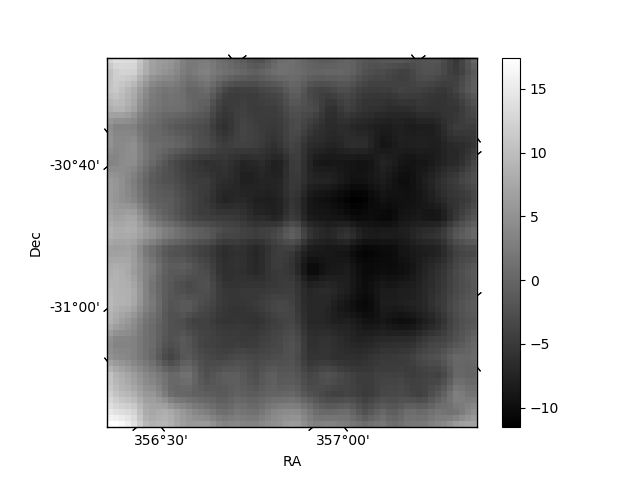
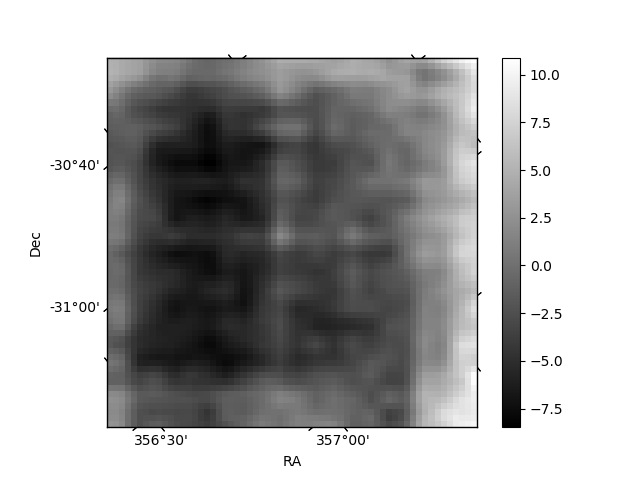
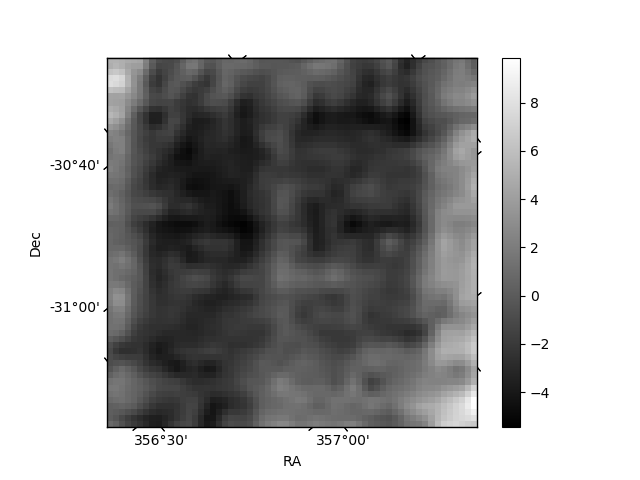
Histogram calculated using DETX and DETY for each event in the final _common_clean file
| Quadrant A | 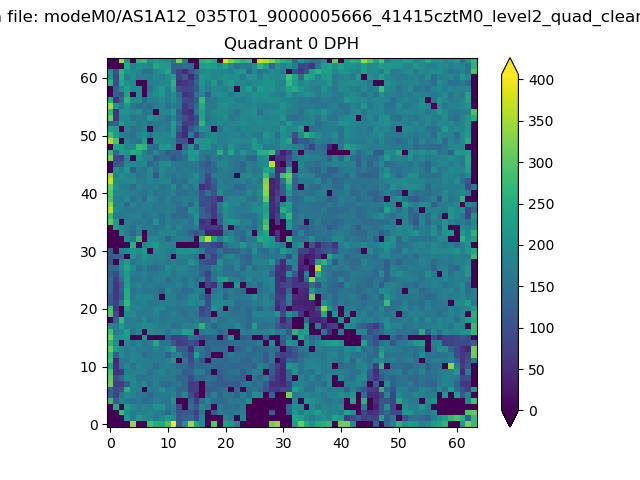 |
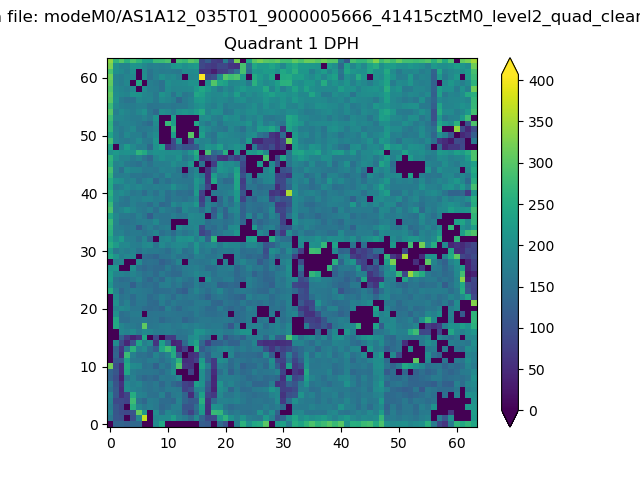 |
Quadrant B |
|---|---|---|---|
| Quadrant D | 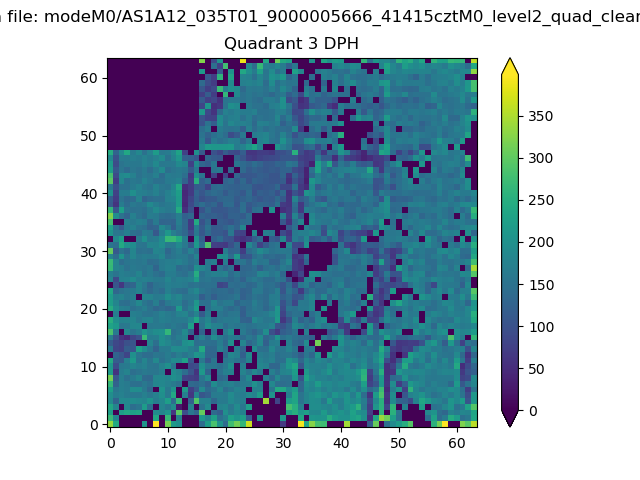 |
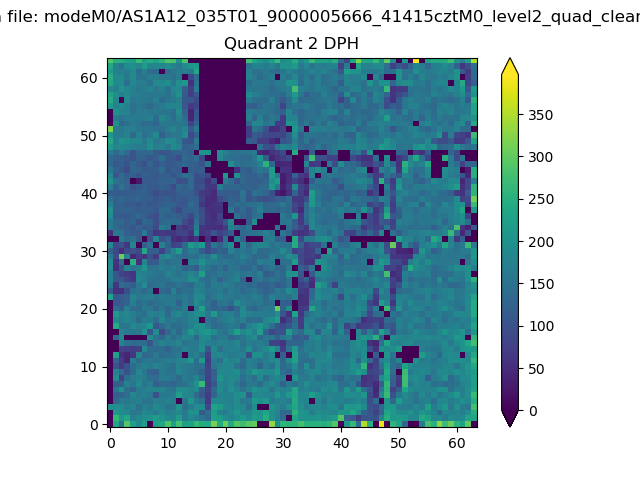 |
Quadrant C |
| Plot type | Count rate plots | Images |
|---|---|---|
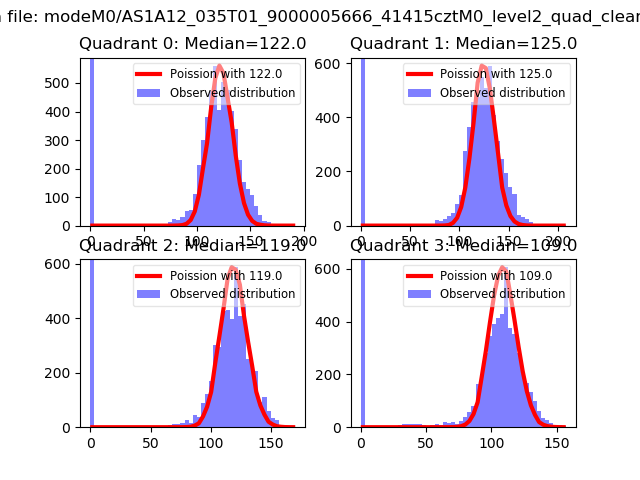
| Comparison with Poisson distribution Blue bars denote a histogram of data divided into 1 sec bins. Red curve is a Poisson curve with rate = median count rate of data. |
 |
 |
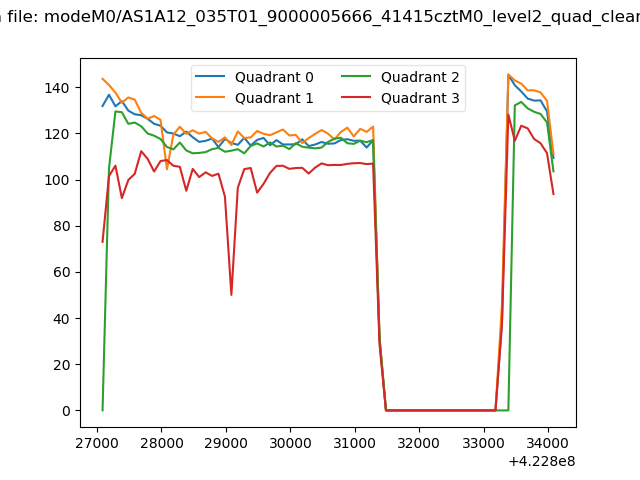
| Quadrant-wise count rates Data is divided into 100 sec bins |
 |
|
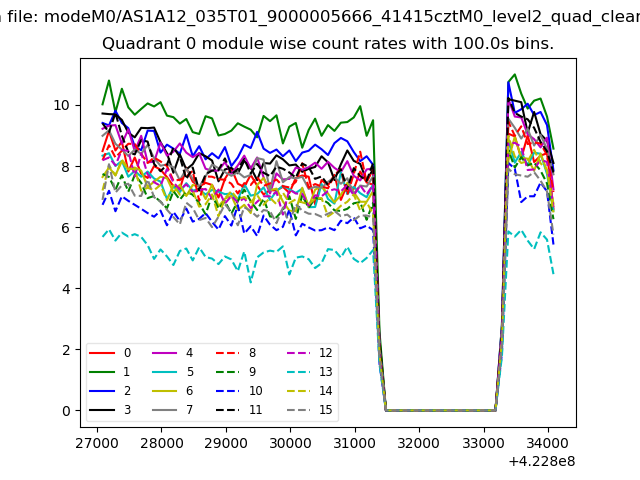
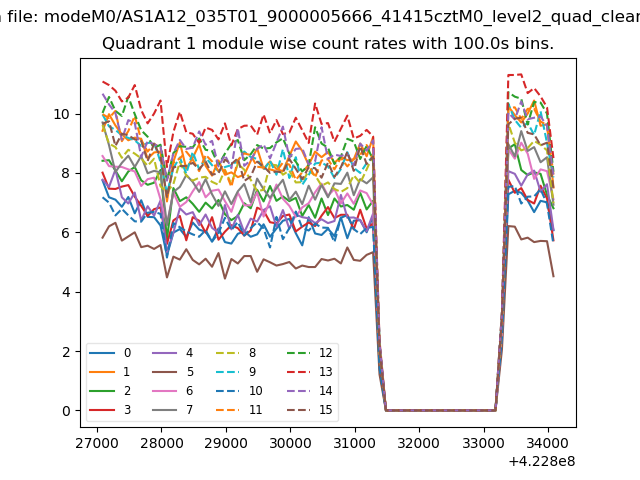
| Module-wise count rates for Quadrant A Data is divided into 100 sec bins |
 |
 |
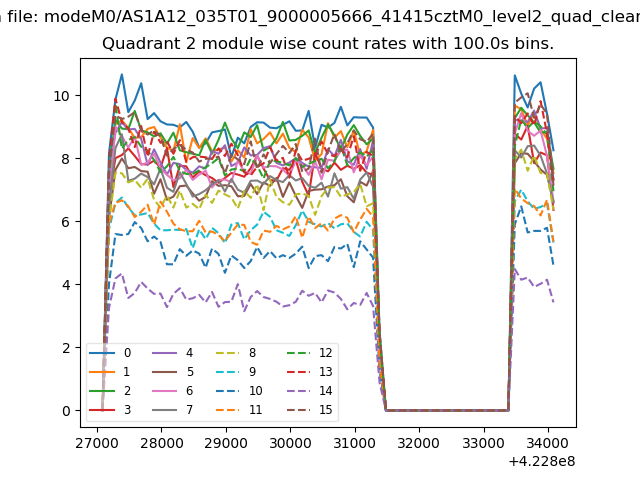
| Module-wise count rates for Quadrant B Data is divided into 100 sec bins |
 |
 |
| Module-wise count rates for Quadrant C Data is divided into 100 sec bins |
 |
 |
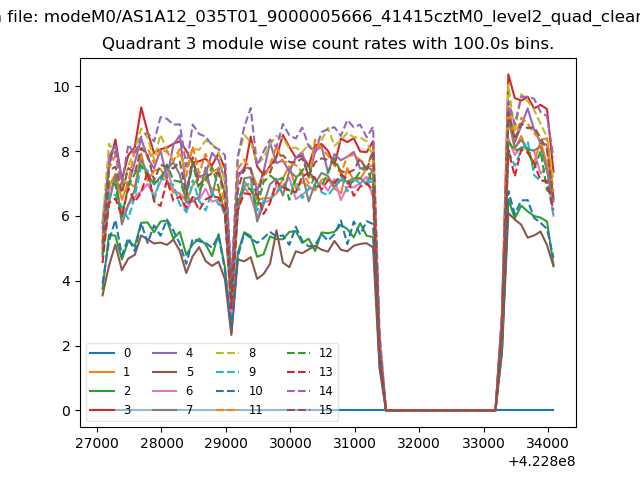
| Module-wise count rates for Quadrant D Data is divided into 100 sec bins |
 |
 |
| Parameter | Plot |
|---|---|
| CZT HV Monitor | 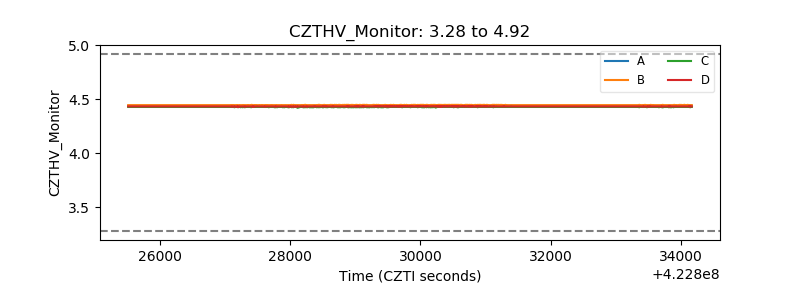 |
| D_VDD | 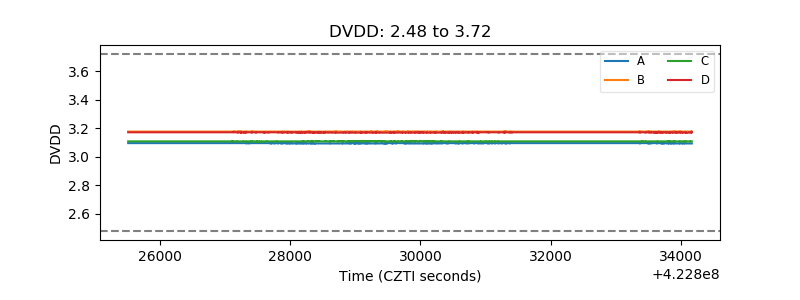 |
| Temperature 1 | 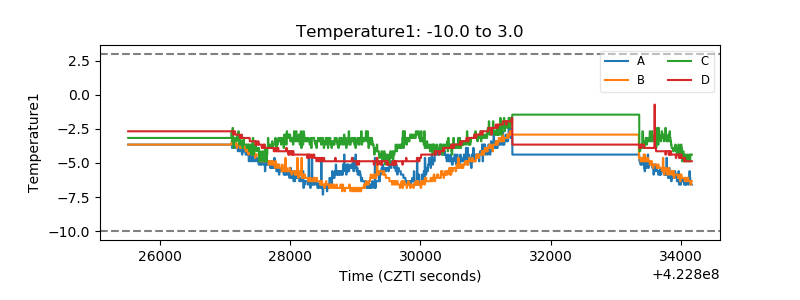 |
| Veto HV Monitor | 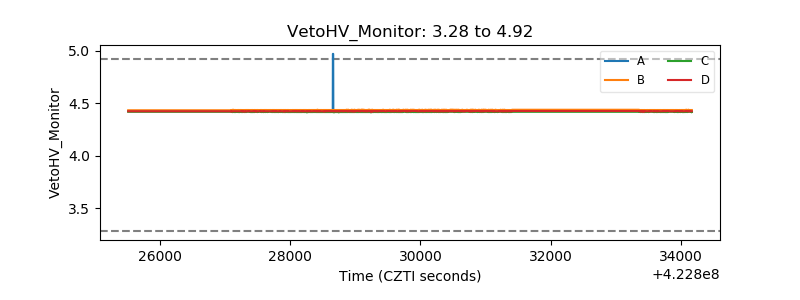 |
| Veto LLD | 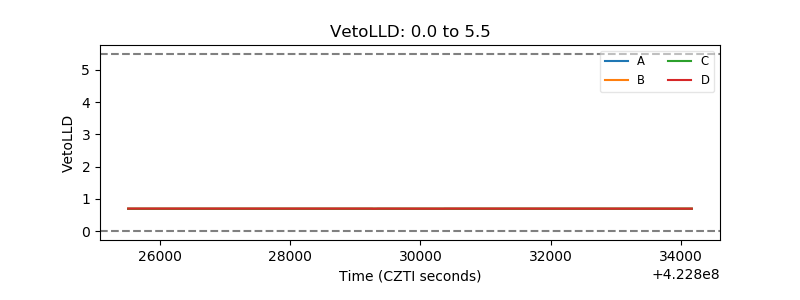 |
| Alpha Counter | 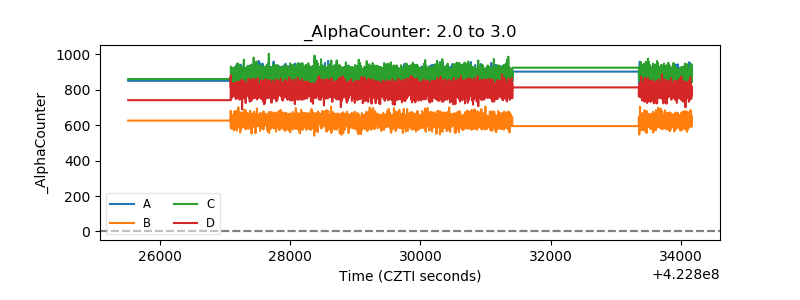 |
| _CPM_Rate | 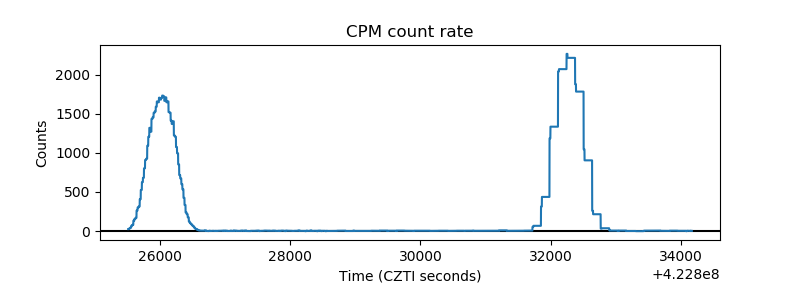 |
| CZT Counter | 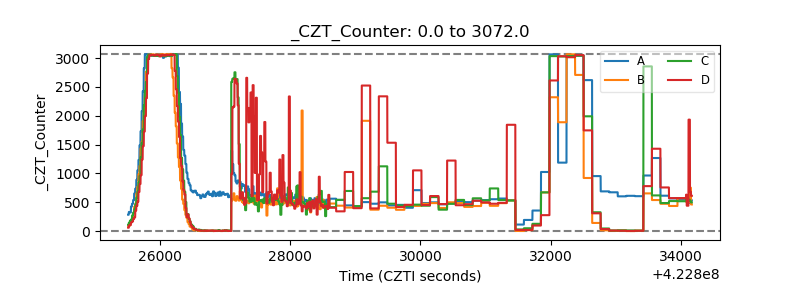 |
| +2.5 Volts monitor |  |
| +5 Volts monitor | 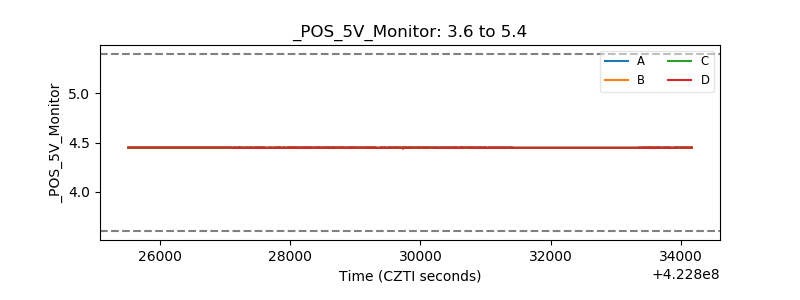 |
| _ROLL_ROT | 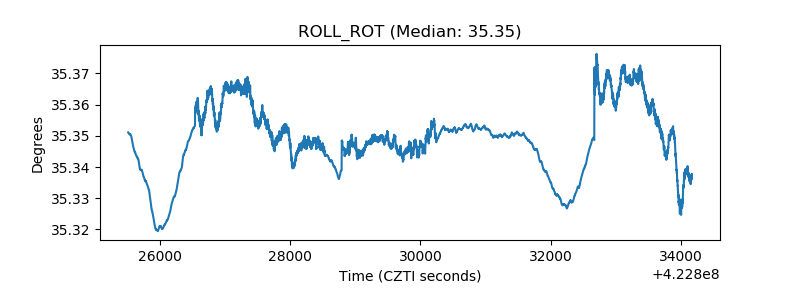 |
| _Roll_DEC | 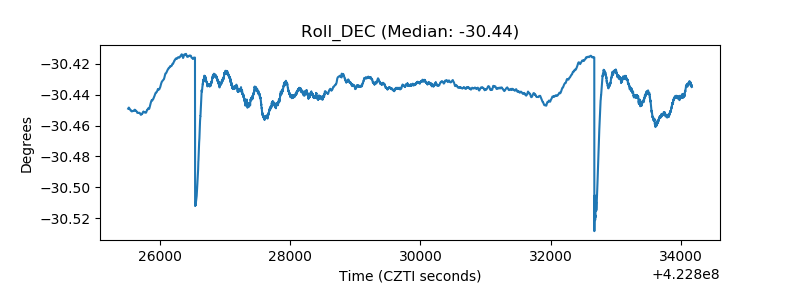 |
| _Roll_RA | 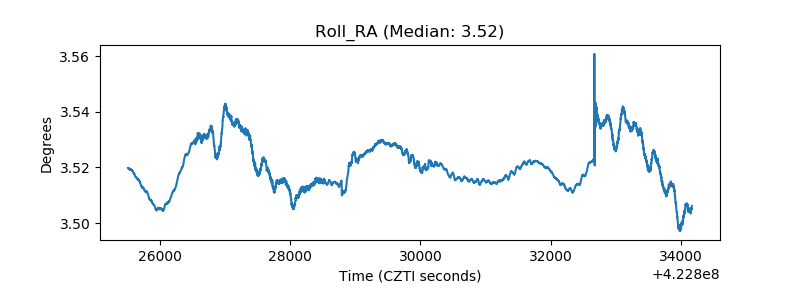 |
| Veto Counter | 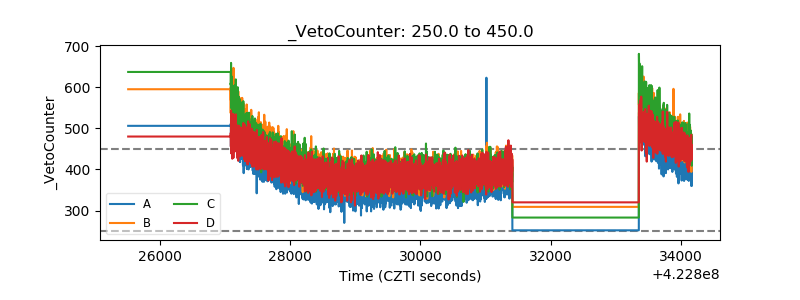 |