| Param | Original file | Final file |
|---|---|---|
| Filename | modeM0/AS1A12_035T01_9000005666_41416cztM0_level2.fits | modeM0/AS1A12_035T01_9000005666_41416cztM0_level2_quad_clean.evt |
| Size (bytes) | 326,252,160 | 90,489,600 |
| Size | 311.1 MB | 86.3 MB |
| Events in quadrant A | 2,945,285 | 622,018 |
| Events in quadrant B | 2,386,447 | 641,333 |
| Events in quadrant C | 3,165,202 | 572,415 |
| Events in quadrant D | 3,192,376 | 556,028 |
| Mode M0 | |||
|---|---|---|---|
| Quadrant | BADHDUFLAG | Total packets | Discarded packets |
| A | 0 | 11655 | 3 |
| B | 0 | 10197 | 2 |
| C | 0 | 12231 | 2 |
| D | 0 | 12659 | 2 |
| Mode SS | |||
|---|---|---|---|
| Quadrant | BADHDUFLAG | Total packets | Discarded packets |
| A | 0 | 100 | 0 |
| B | 0 | 100 | 0 |
| C | 0 | 100 | 0 |
| D | 0 | 100 | 0 |
| Mode M9 | |||
|---|---|---|---|
| Quadrant | BADHDUFLAG | Total packets | Discarded packets |
| A | 0 | 31 | 0 |
| B | 0 | 31 | 0 |
| C | 0 | 31 | 0 |
| D | 0 | 32 | 0 |
| Quadrant | Total seconds | Saturated seconds | Saturation percentage |
|---|---|---|---|
| A | 4974 | 38 | 0.763973% |
| B | 4974 | 7 | 0.140732% |
| C | 4974 | 273 | 5.488540% |
| D | 4974 | 92 | 1.849618% |
Noise dominated data is calculated using 1-second bins in cleaned event files. If a bin has >2000 counts, and if more than 50% of those come from <1% of pixels, then it is considered to be noise-dominated and hence unusable.
| Quadrant | # 1 sec bins | Bins with >0 counts | Bins with >2000 counts | High rate bins dominated by noise | Noise dominated (total time) | Noise dominated (detector-on time) | Marked lightcurve |
|---|---|---|---|---|---|---|---|
| A | 7036 | 4975 | 21 | 21 | 0.30% | 0.42% | 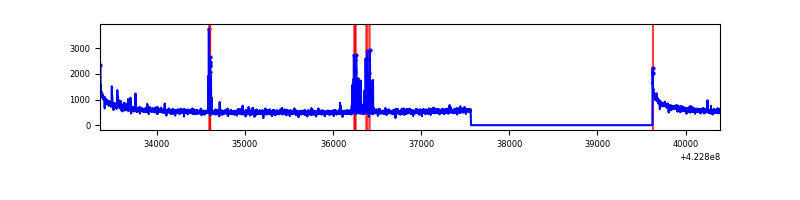 |
| B | 7036 | 4975 | 2 | 2 | 0.03% | 0.04% | 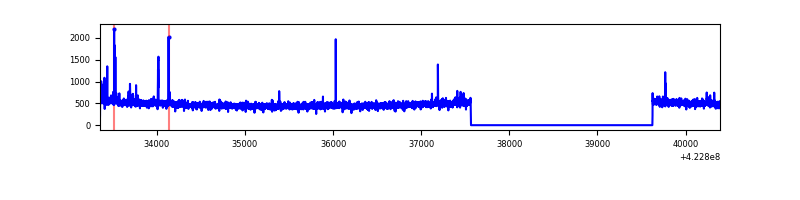 |
| C | 7036 | 4975 | 261 | 261 | 3.71% | 5.25% | 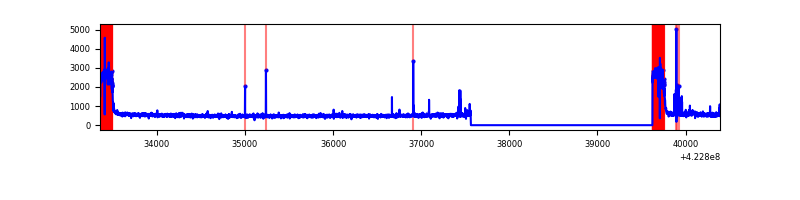 |
| D | 7036 | 4975 | 72 | 72 | 1.02% | 1.45% | 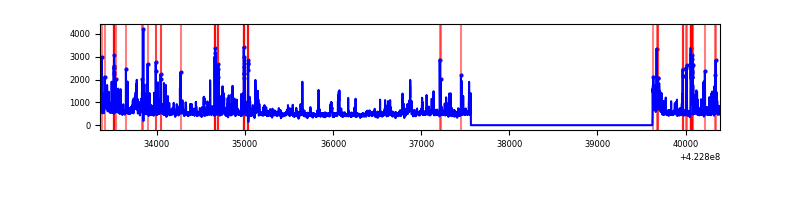 |
Top three noisy pixels from each quadrant. If the there are fewer than three noisy pixels in the level2.evt file, extra rows are filled as -1
| Pixel properties | Quadrant properties | ||||||
|---|---|---|---|---|---|---|---|
| Quadrant | DetID | PixID | Counts | Sigma | Mean | Median | Sigma |
| A | 10 | 83 | 484063 | 3994.18 | 589 | 577 | 121.0 |
| A | 2 | 79 | 118672 | 975.61 | 589 | 577 | 121.0 |
| A | 13 | 248 | 40430 | 329.23 | 589 | 577 | 121.0 |
| B | 0 | 190 | 38744 | 339.27 | 589 | 573 | 112.5 |
| B | 12 | 111 | 13984 | 119.2 | 589 | 573 | 112.5 |
| B | 5 | 255 | 13964 | 119.02 | 589 | 573 | 112.5 |
| C | 0 | 10 | 683577 | 5224.4 | 562 | 566 | 130.7 |
| C | 15 | 214 | 214569 | 1636.92 | 562 | 566 | 130.7 |
| C | 15 | 111 | 47648 | 360.13 | 562 | 566 | 130.7 |
| D | 2 | 249 | 249259 | 1765.83 | 579 | 564 | 140.8 |
| D | 5 | 222 | 210676 | 1491.87 | 579 | 564 | 140.8 |
| D | 13 | 249 | 205306 | 1453.75 | 579 | 564 | 140.8 |
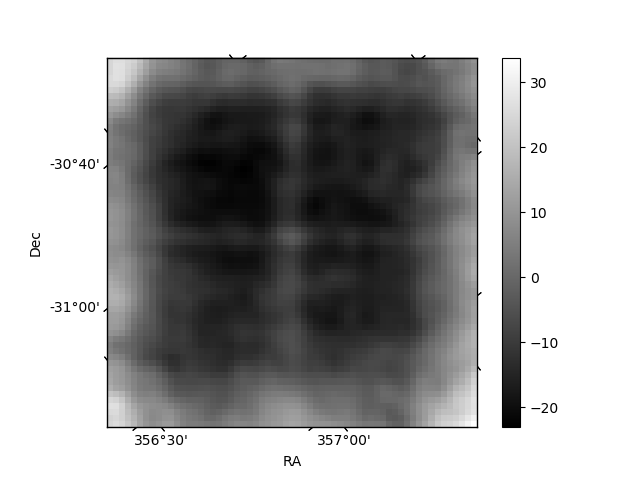
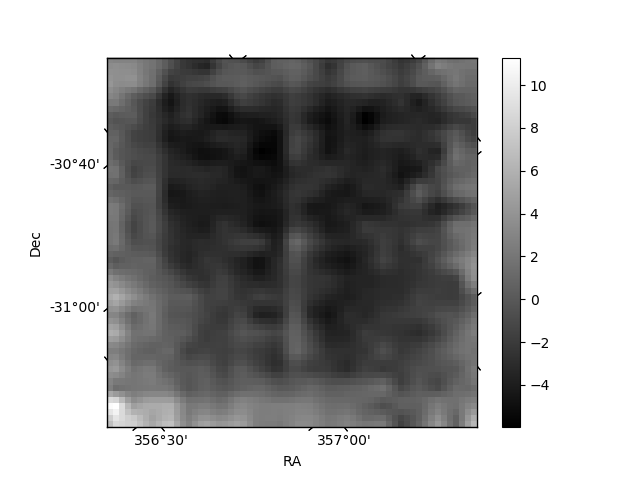
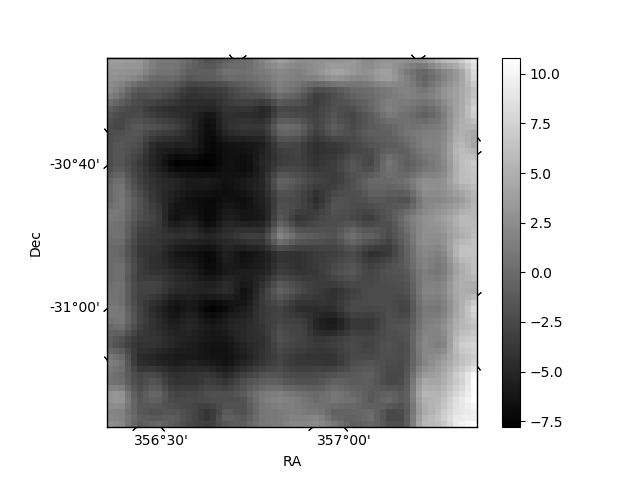
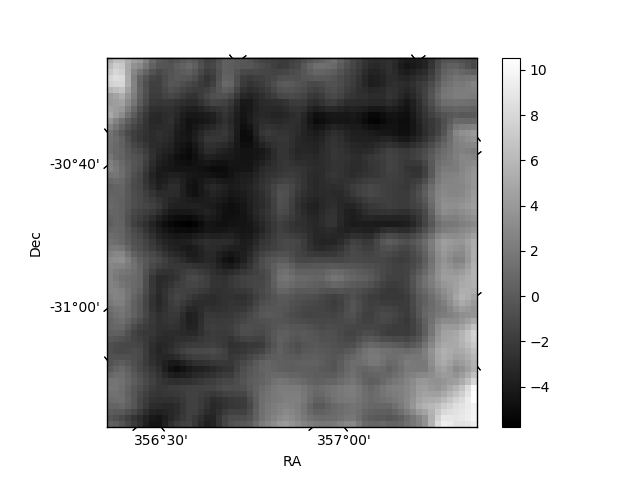
Histogram calculated using DETX and DETY for each event in the final _common_clean file
| Quadrant A | 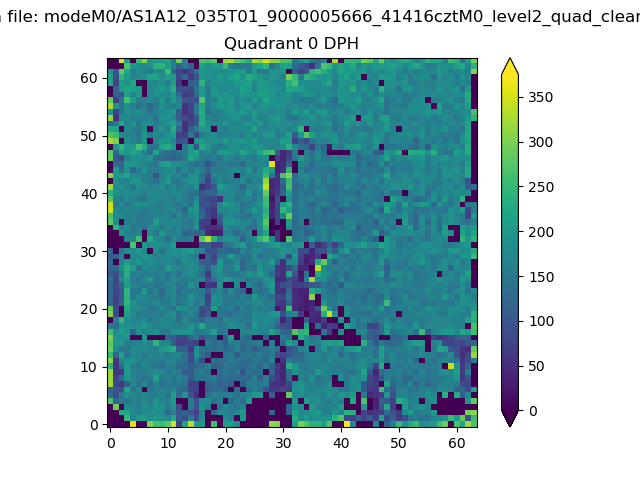 |
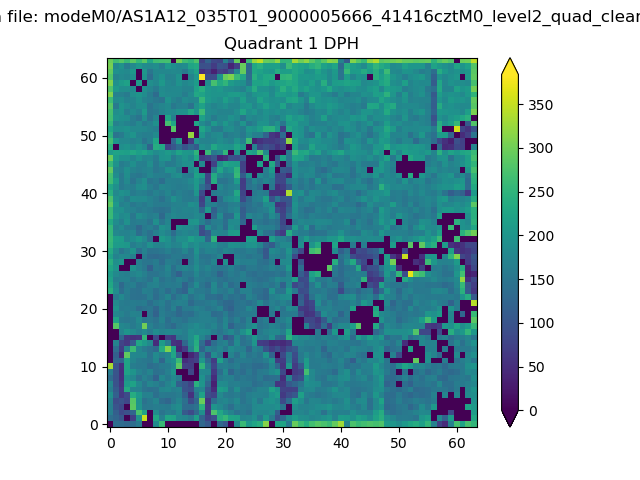 |
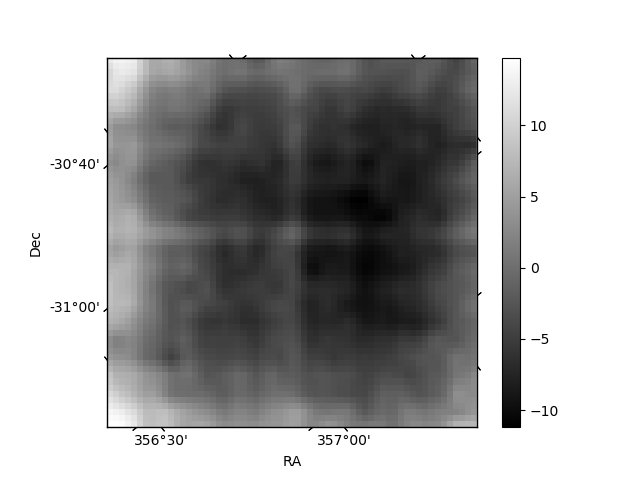
Quadrant B |
|---|---|---|---|
| Quadrant D | 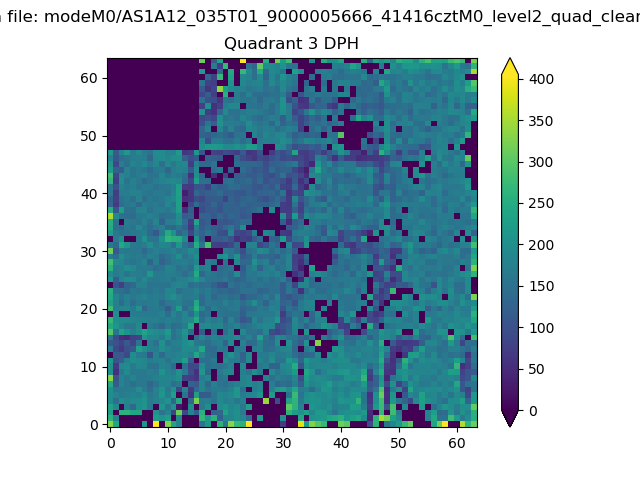 |
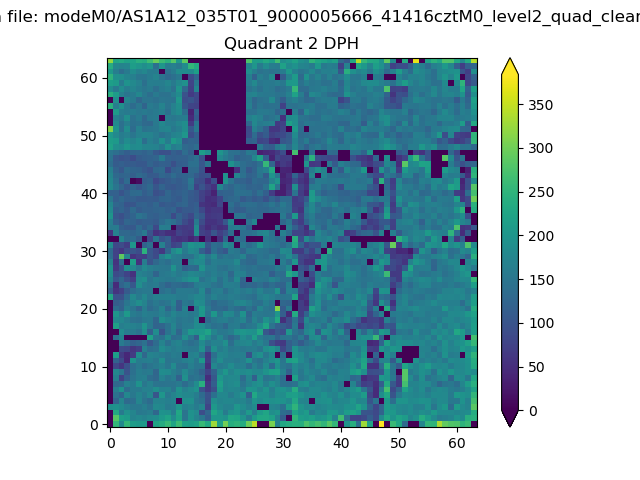 |
Quadrant C |
| Plot type | Count rate plots | Images |
|---|---|---|
| Comparison with Poisson distribution Blue bars denote a histogram of data divided into 1 sec bins. Red curve is a Poisson curve with rate = median count rate of data. |
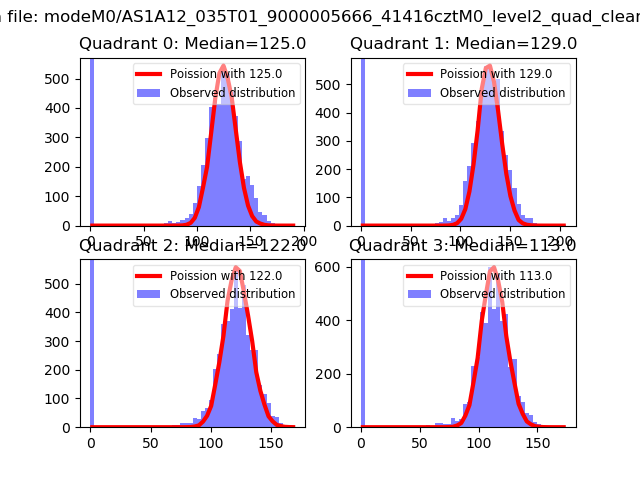 |
 |
| Quadrant-wise count rates Data is divided into 100 sec bins |
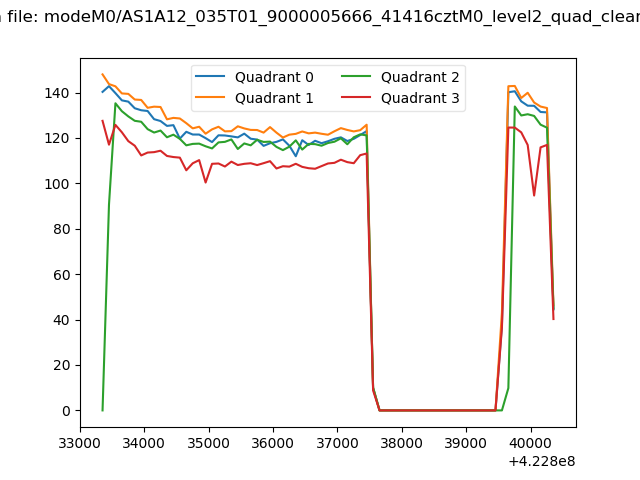 |
|
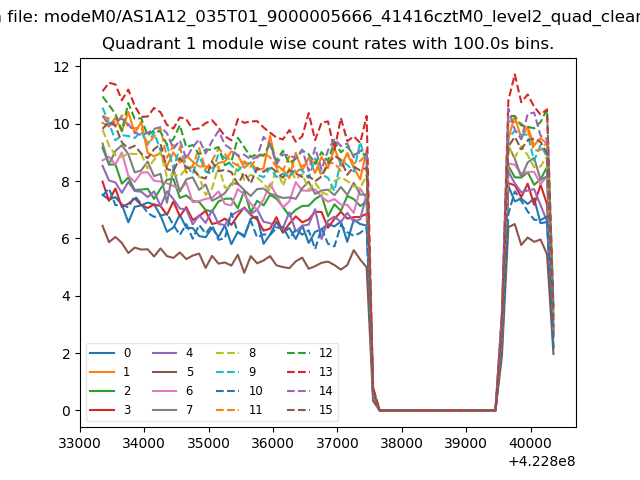
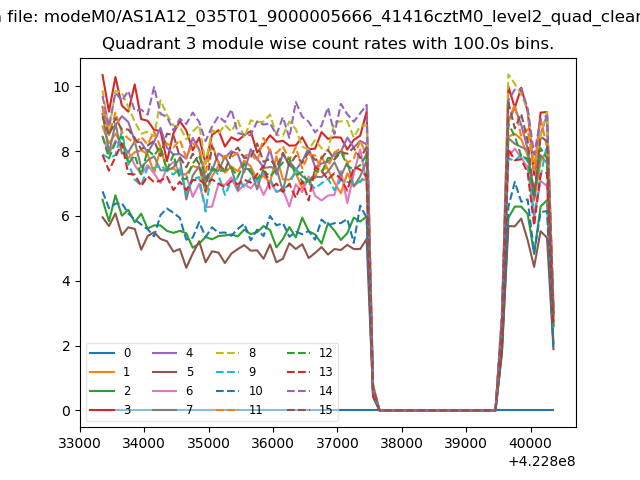
| Module-wise count rates for Quadrant A Data is divided into 100 sec bins |
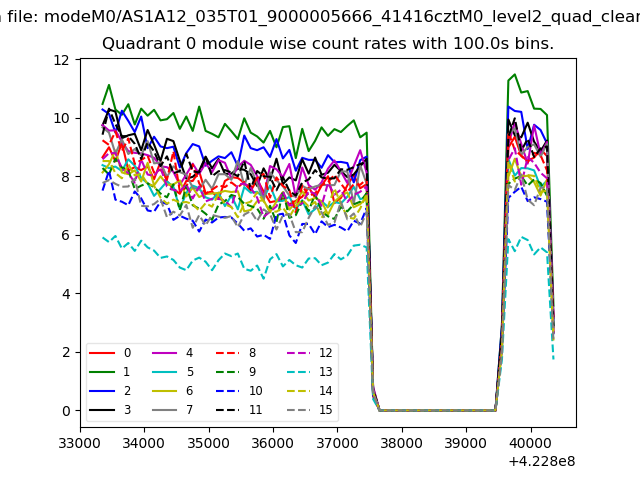 |
 |
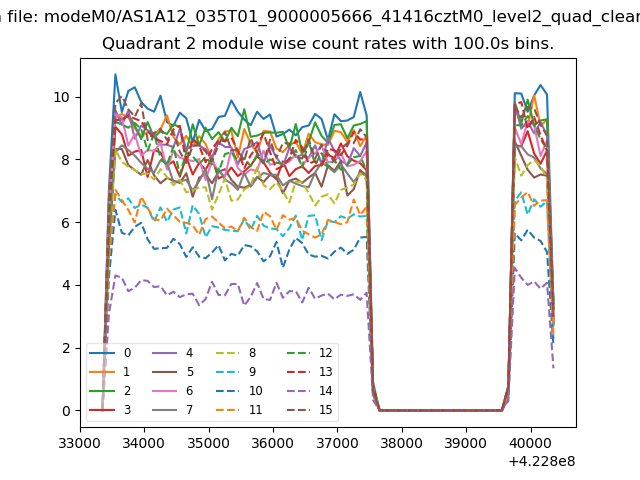
| Module-wise count rates for Quadrant B Data is divided into 100 sec bins |
 |
 |
| Module-wise count rates for Quadrant C Data is divided into 100 sec bins |
 |
 |
| Module-wise count rates for Quadrant D Data is divided into 100 sec bins |
 |
 |
| Parameter | Plot |
|---|---|
| CZT HV Monitor | 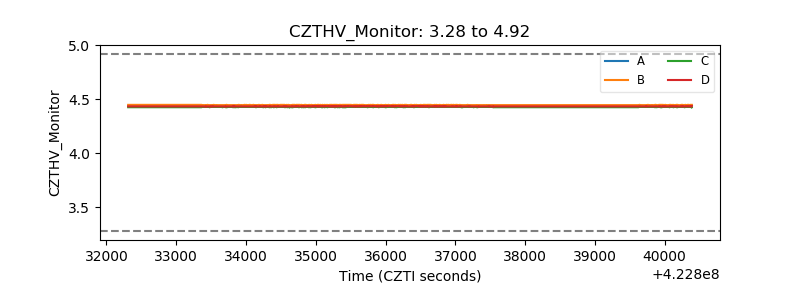 |
| D_VDD | 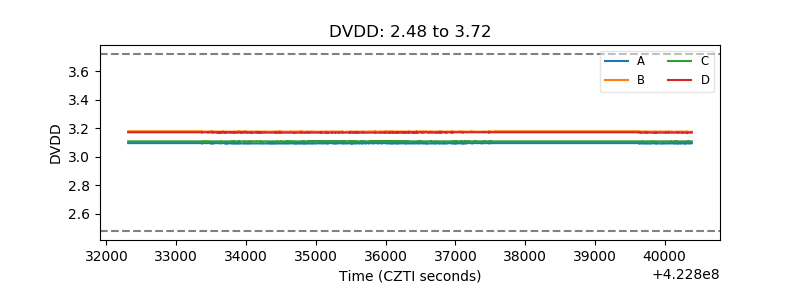 |
| Temperature 1 | 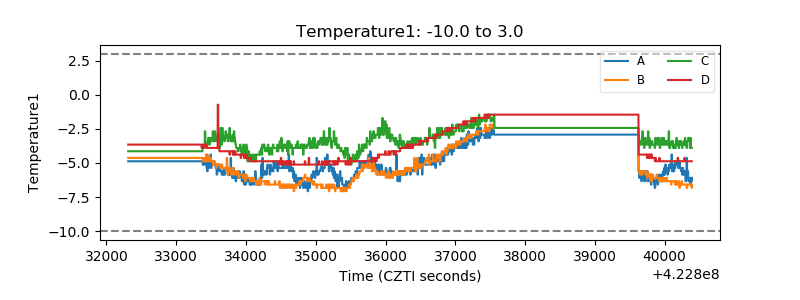 |
| Veto HV Monitor | 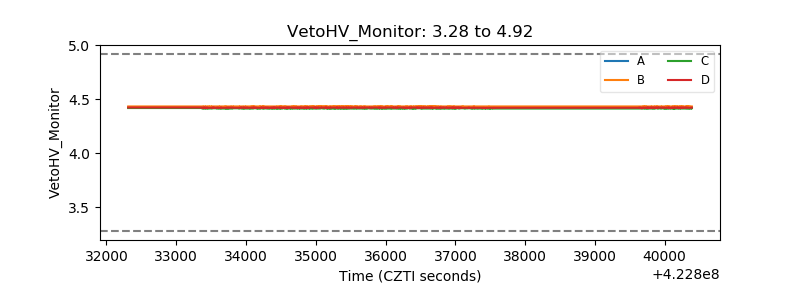 |
| Veto LLD | 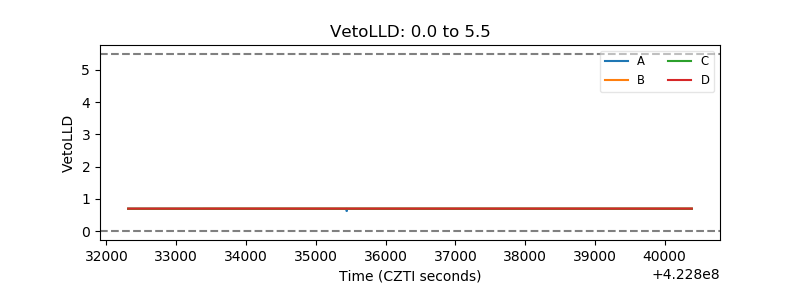 |
| Alpha Counter | 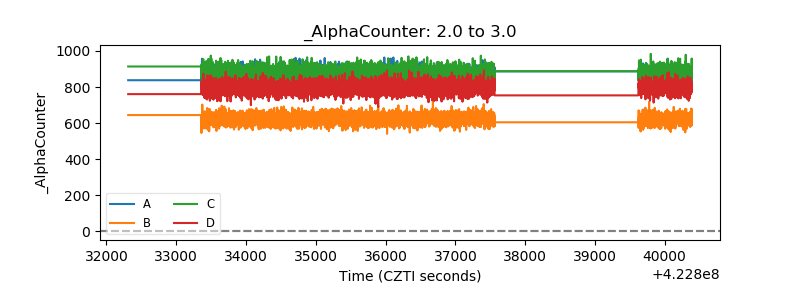 |
| _CPM_Rate | 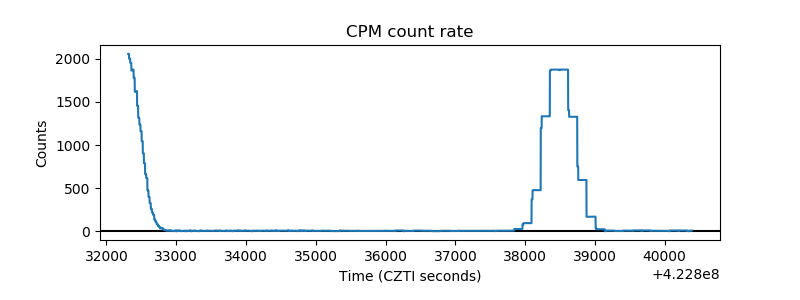 |
| CZT Counter | 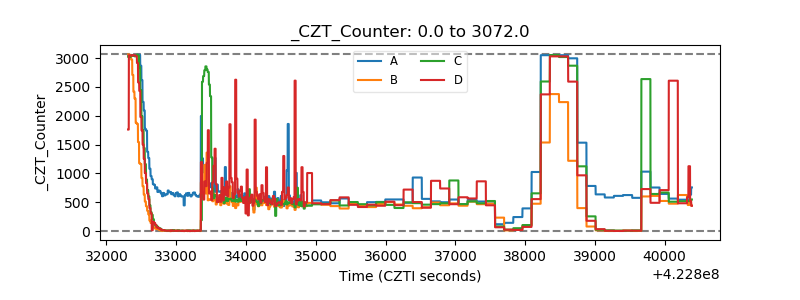 |
| +2.5 Volts monitor | 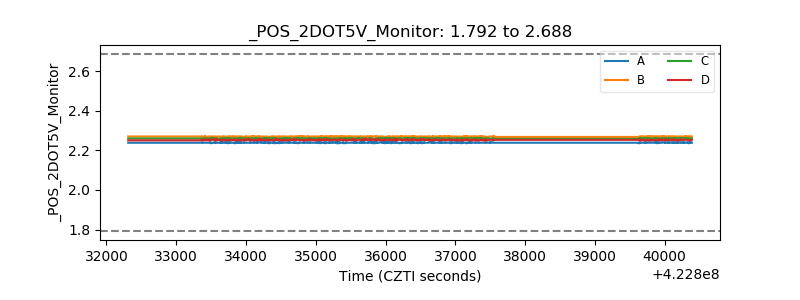 |
| +5 Volts monitor | 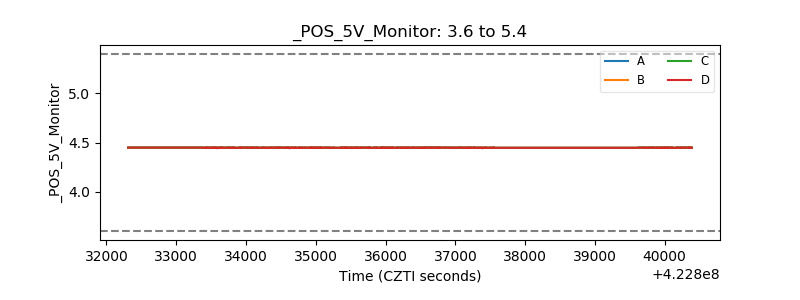 |
| _ROLL_ROT | 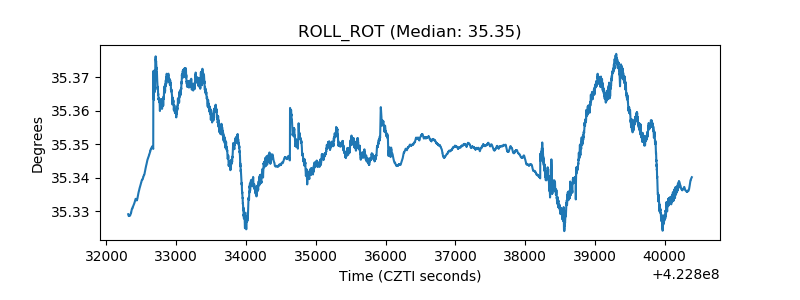 |
| _Roll_DEC | 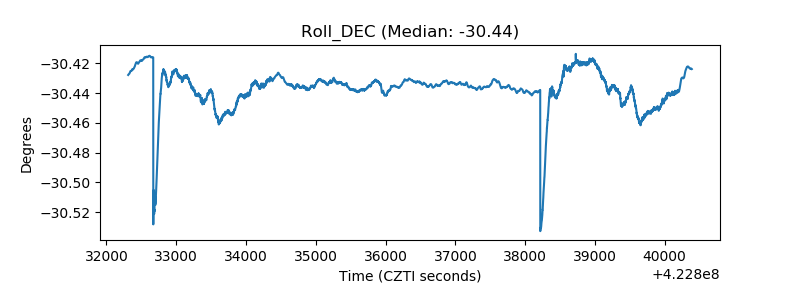 |
| _Roll_RA | 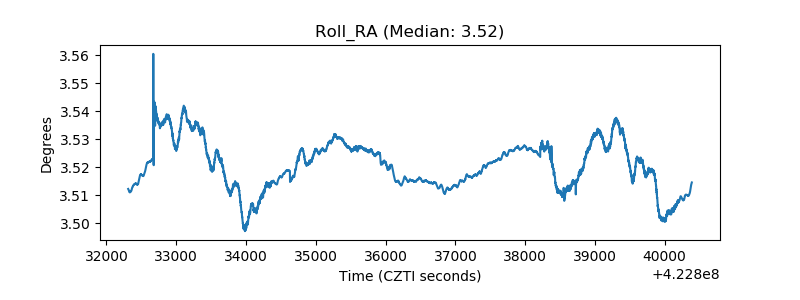 |
| Veto Counter | 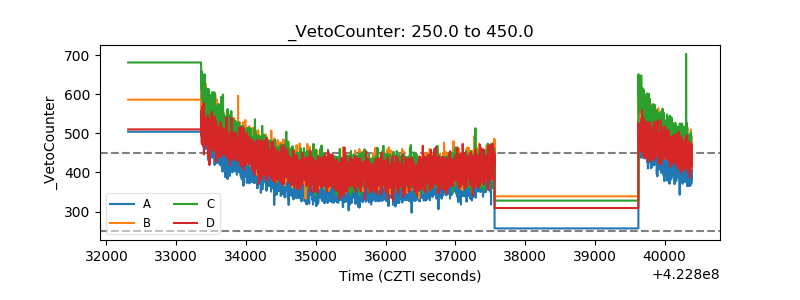 |