| Param | Original file | Final file |
|---|---|---|
| Filename | modeM0/AS1A12_035T01_9000005666_41418cztM0_level2.fits | modeM0/AS1A12_035T01_9000005666_41418cztM0_level2_quad_clean.evt |
| Size (bytes) | 311,889,600 | 84,329,280 |
| Size | 297.4 MB | 80.4 MB |
| Events in quadrant A | 2,663,570 | 573,682 |
| Events in quadrant B | 2,253,839 | 592,929 |
| Events in quadrant C | 3,042,921 | 537,245 |
| Events in quadrant D | 3,202,485 | 505,460 |
| Mode M0 | |||
|---|---|---|---|
| Quadrant | BADHDUFLAG | Total packets | Discarded packets |
| A | 0 | 10872 | 3 |
| B | 0 | 10025 | 2 |
| C | 0 | 11932 | 2 |
| D | 0 | 12905 | 2 |
| Mode SS | |||
|---|---|---|---|
| Quadrant | BADHDUFLAG | Total packets | Discarded packets |
| A | 0 | 102 | 0 |
| B | 0 | 102 | 0 |
| C | 0 | 102 | 0 |
| D | 0 | 102 | 0 |
| Mode M9 | |||
|---|---|---|---|
| Quadrant | BADHDUFLAG | Total packets | Discarded packets |
| A | 0 | 34 | 0 |
| B | 0 | 34 | 0 |
| C | 0 | 34 | 0 |
| D | 0 | 35 | 0 |
| Quadrant | Total seconds | Saturated seconds | Saturation percentage |
|---|---|---|---|
| A | 4903 | 12 | 0.244748% |
| B | 4903 | 7 | 0.142770% |
| C | 4903 | 279 | 5.690394% |
| D | 4903 | 222 | 4.527840% |
Noise dominated data is calculated using 1-second bins in cleaned event files. If a bin has >2000 counts, and if more than 50% of those come from <1% of pixels, then it is considered to be noise-dominated and hence unusable.
| Quadrant | # 1 sec bins | Bins with >0 counts | Bins with >2000 counts | High rate bins dominated by noise | Noise dominated (total time) | Noise dominated (detector-on time) | Marked lightcurve |
|---|---|---|---|---|---|---|---|
| A | 7025 | 4904 | 3 | 3 | 0.04% | 0.06% | 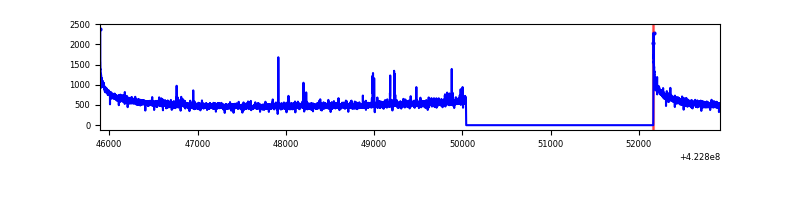 |
| B | 7025 | 4904 | 0 | 0 | 0.00% | 0.00% | 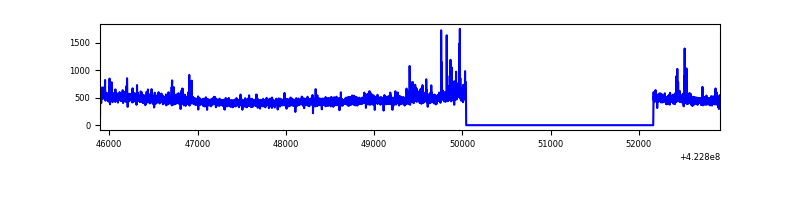 |
| C | 7025 | 4904 | 269 | 269 | 3.83% | 5.49% | 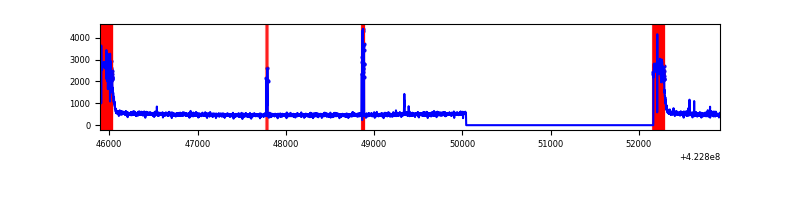 |
| D | 7025 | 4904 | 163 | 163 | 2.32% | 3.32% | 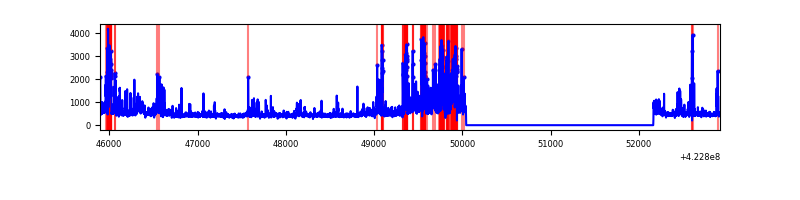 |
Top three noisy pixels from each quadrant. If the there are fewer than three noisy pixels in the level2.evt file, extra rows are filled as -1
| Pixel properties | Quadrant properties | ||||||
|---|---|---|---|---|---|---|---|
| Quadrant | DetID | PixID | Counts | Sigma | Mean | Median | Sigma |
| A | 10 | 83 | 480647 | 4222.14 | 553 | 541 | 113.7 |
| A | 13 | 248 | 17380 | 148.09 | 553 | 541 | 113.7 |
| A | 2 | 79 | 16698 | 142.09 | 553 | 541 | 113.7 |
| B | 0 | 190 | 57698 | 543.05 | 550 | 535 | 105.3 |
| B | 12 | 111 | 13347 | 121.71 | 550 | 535 | 105.3 |
| B | 11 | 111 | 12444 | 113.14 | 550 | 535 | 105.3 |
| C | 0 | 10 | 686972 | 5562.51 | 530 | 535 | 123.4 |
| C | 15 | 214 | 212135 | 1714.69 | 530 | 535 | 123.4 |
| C | 0 | 15 | 65988 | 530.39 | 530 | 535 | 123.4 |
| D | 2 | 249 | 759676 | 5784.36 | 541 | 527 | 131.2 |
| D | 5 | 222 | 119888 | 909.48 | 541 | 527 | 131.2 |
| D | 1 | 52 | 109413 | 829.66 | 541 | 527 | 131.2 |
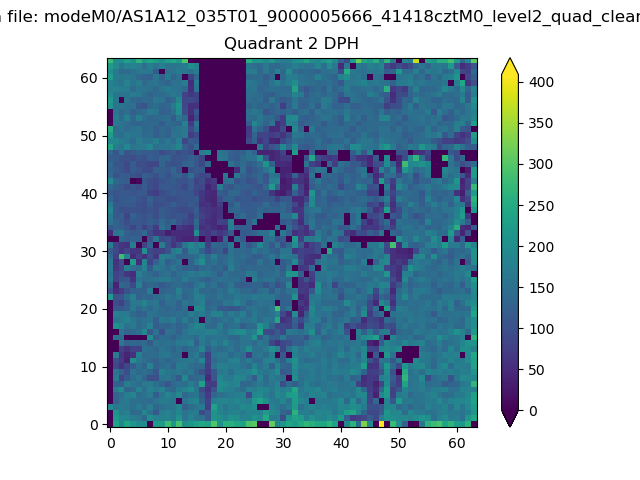
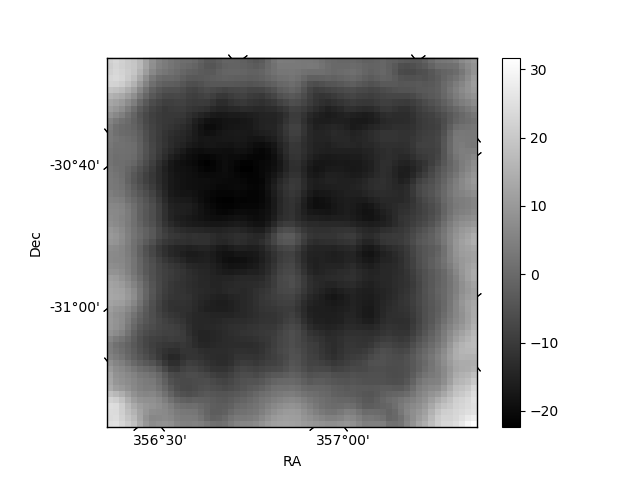
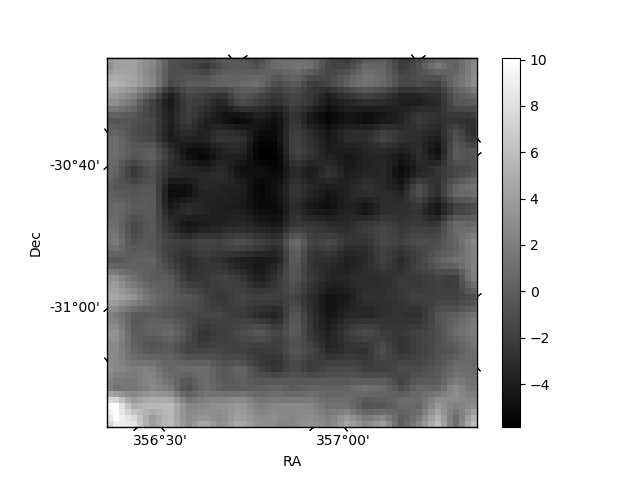
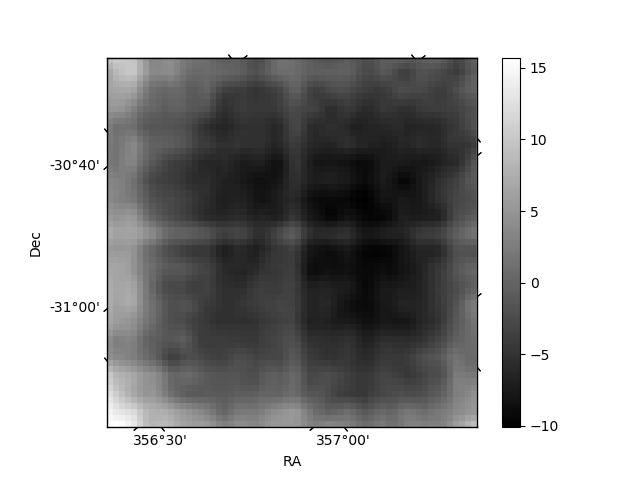
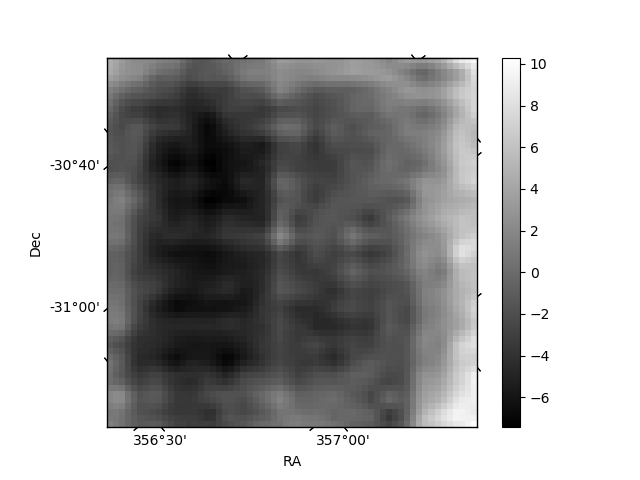
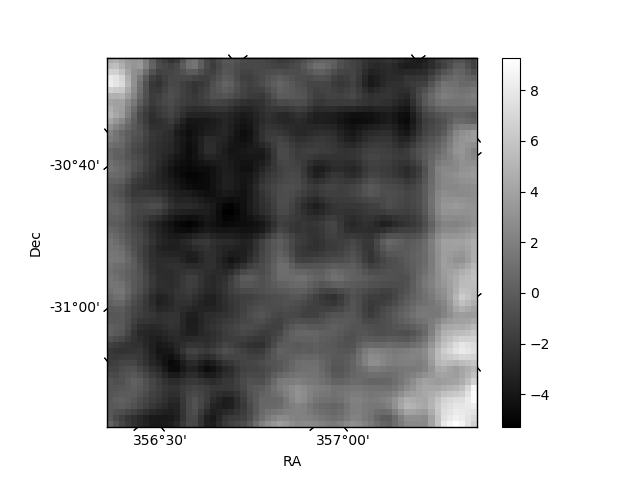
Histogram calculated using DETX and DETY for each event in the final _common_clean file
| Quadrant A | 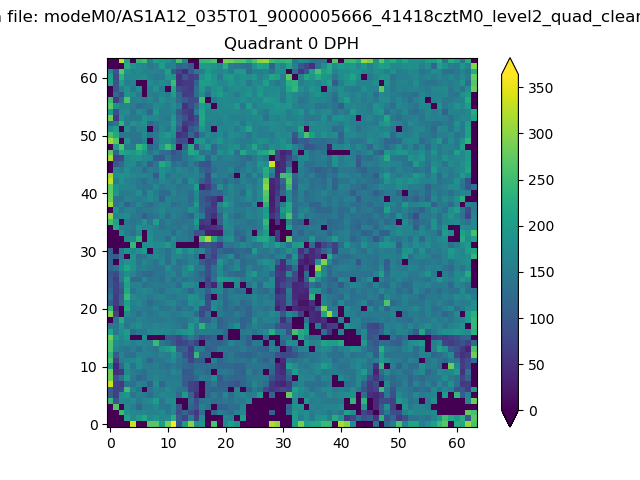 |
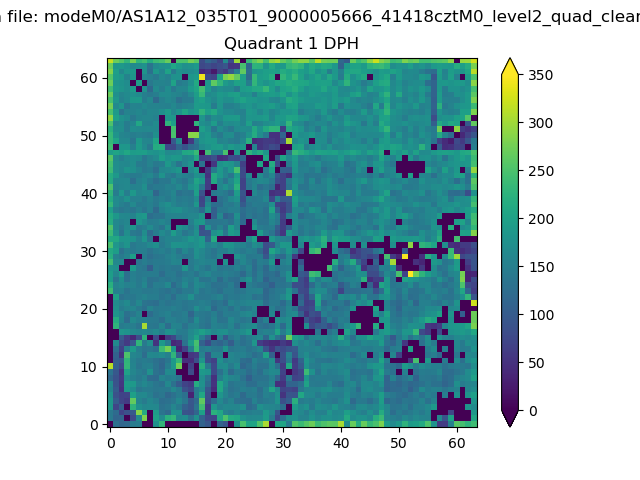 |
Quadrant B |
|---|---|---|---|
| Quadrant D | 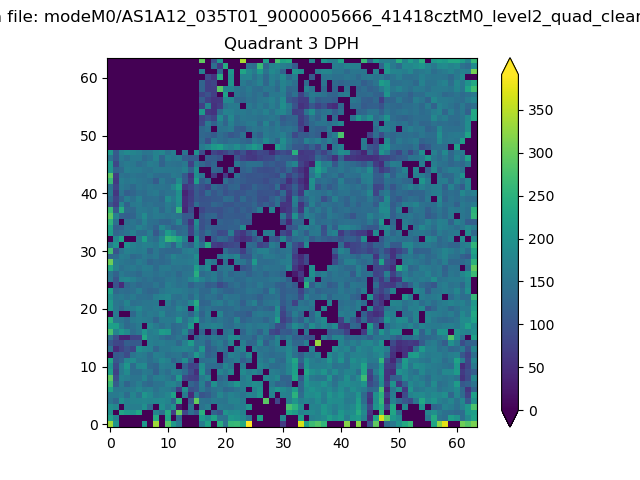 |
 |
Quadrant C |
| Plot type | Count rate plots | Images |
|---|---|---|
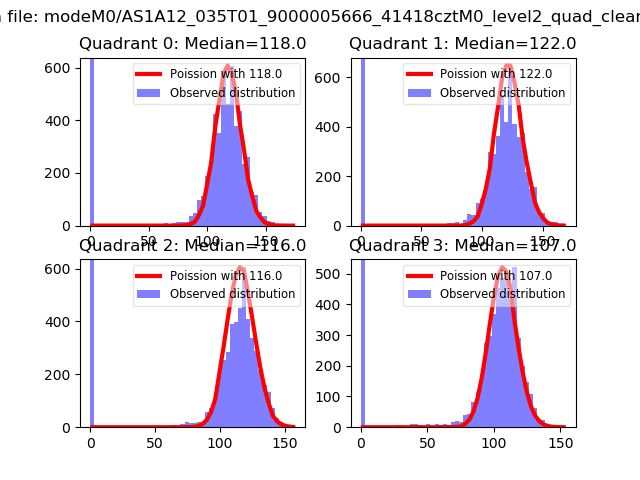
| Comparison with Poisson distribution Blue bars denote a histogram of data divided into 1 sec bins. Red curve is a Poisson curve with rate = median count rate of data. |
 |
 |
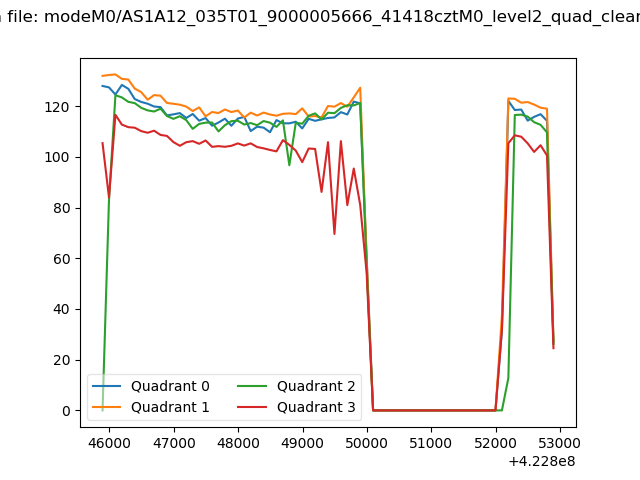
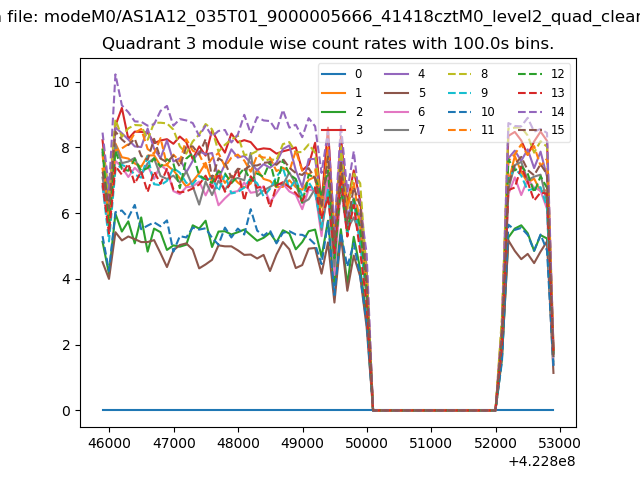
| Quadrant-wise count rates Data is divided into 100 sec bins |
 |
|
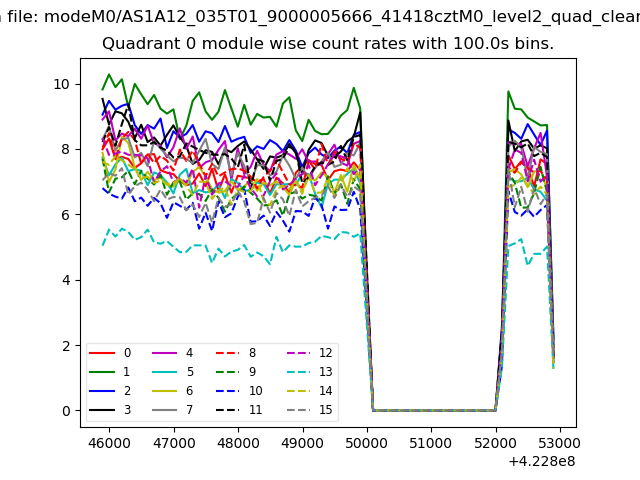
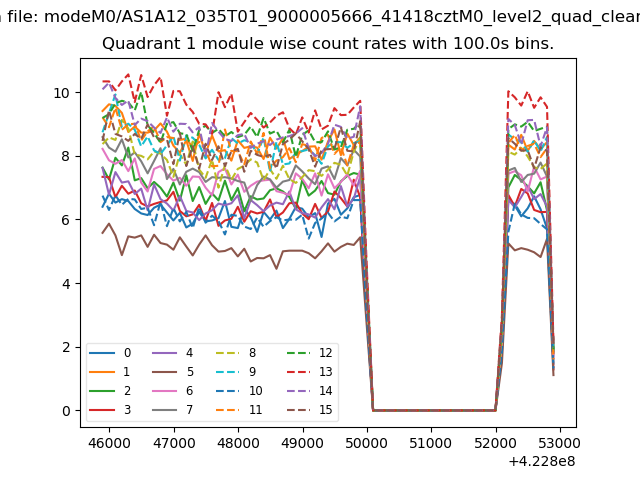
| Module-wise count rates for Quadrant A Data is divided into 100 sec bins |
 |
 |
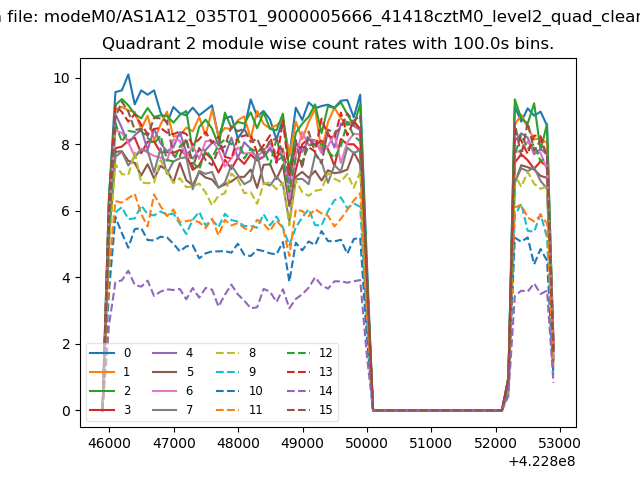
| Module-wise count rates for Quadrant B Data is divided into 100 sec bins |
 |
 |
| Module-wise count rates for Quadrant C Data is divided into 100 sec bins |
 |
 |
| Module-wise count rates for Quadrant D Data is divided into 100 sec bins |
 |
 |
| Parameter | Plot |
|---|---|
| CZT HV Monitor | 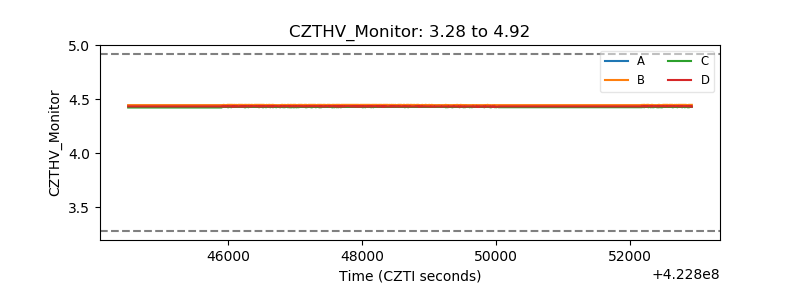 |
| D_VDD | 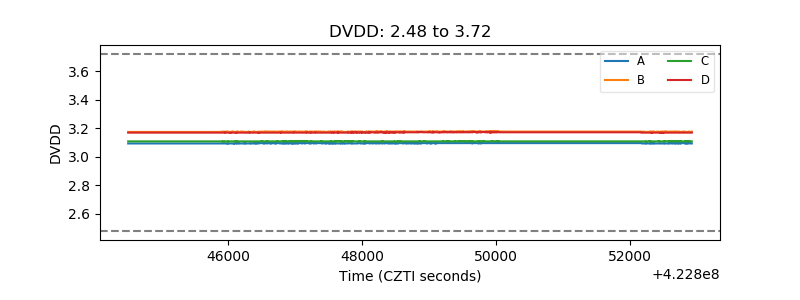 |
| Temperature 1 | 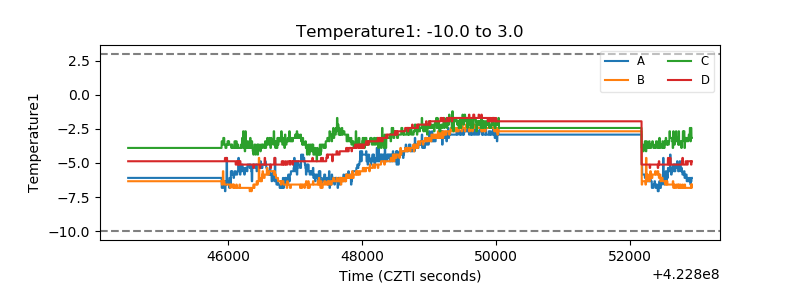 |
| Veto HV Monitor | 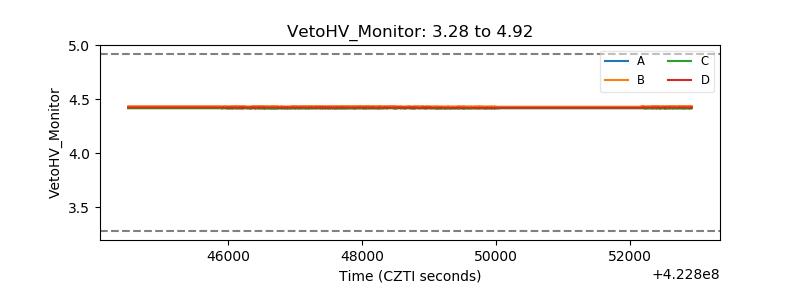 |
| Veto LLD | 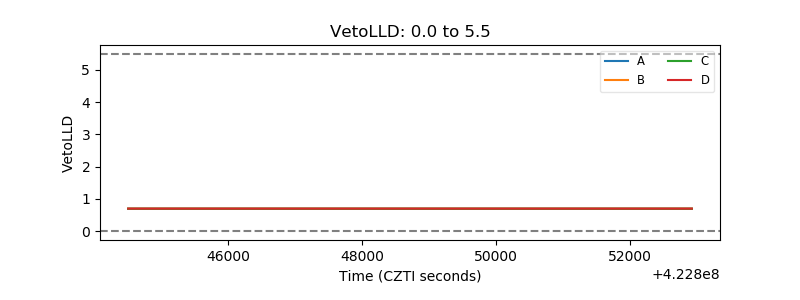 |
| Alpha Counter | 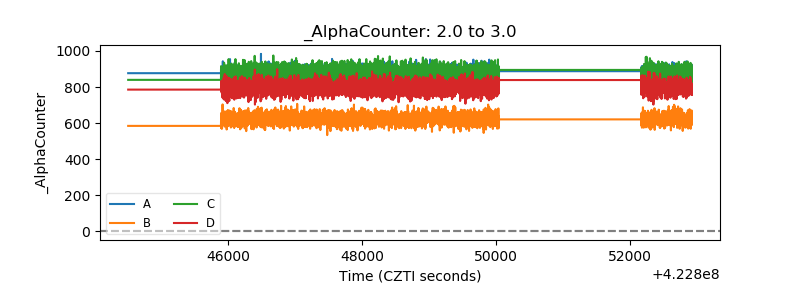 |
| _CPM_Rate | 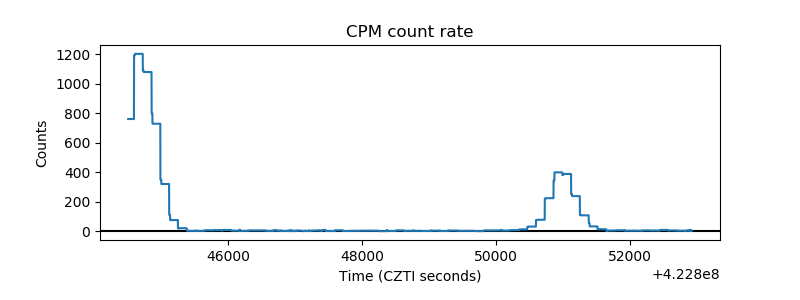 |
| CZT Counter | 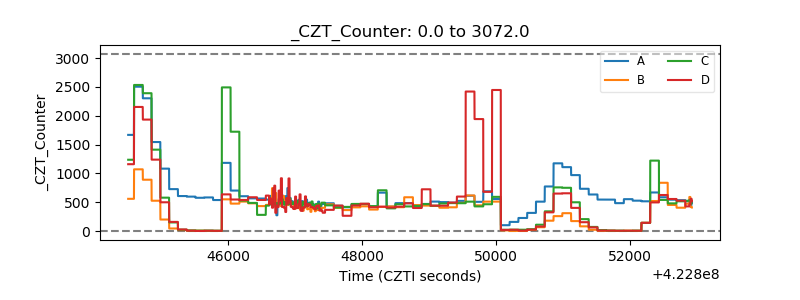 |
| +2.5 Volts monitor |  |
| +5 Volts monitor | 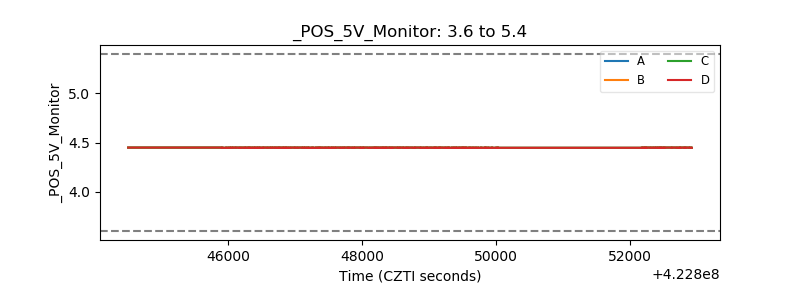 |
| _ROLL_ROT | 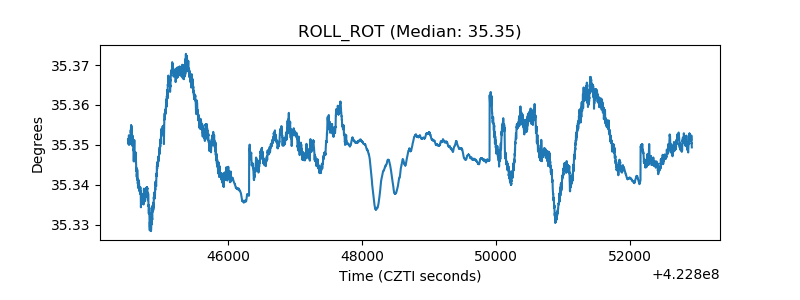 |
| _Roll_DEC | 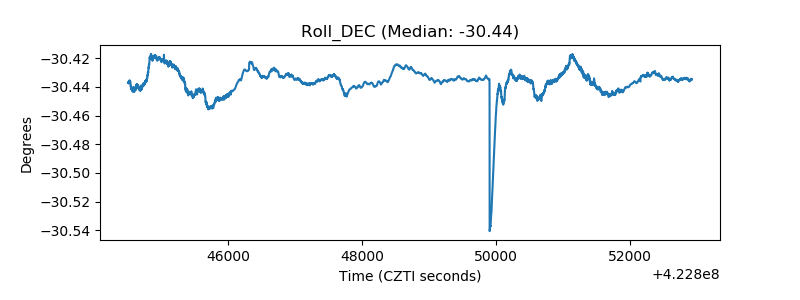 |
| _Roll_RA | 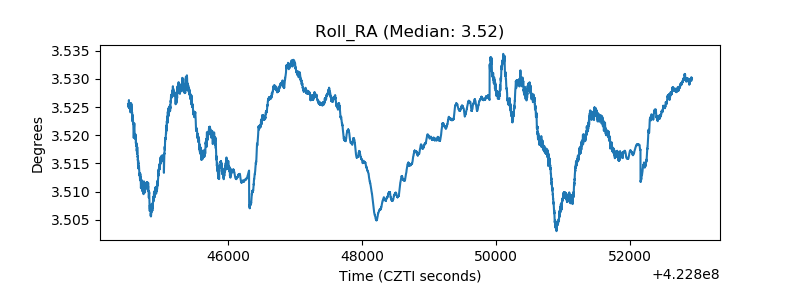 |
| Veto Counter | 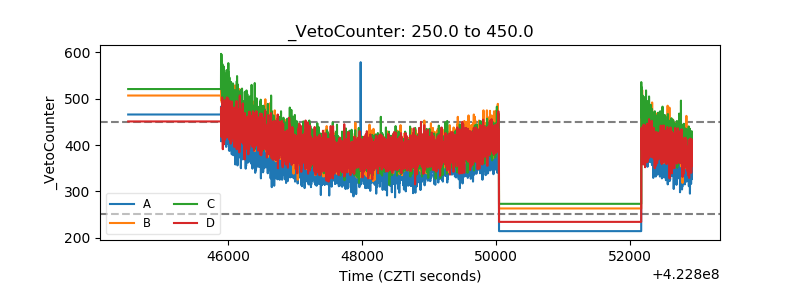 |