| Param | Original file | Final file |
|---|---|---|
| Filename | modeM0/AS1A12_035T01_9000005666_41419cztM0_level2.fits | modeM0/AS1A12_035T01_9000005666_41419cztM0_level2_quad_clean.evt |
| Size (bytes) | 328,397,760 | 86,296,320 |
| Size | 313.2 MB | 82.3 MB |
| Events in quadrant A | 2,770,579 | 580,372 |
| Events in quadrant B | 2,403,948 | 600,554 |
| Events in quadrant C | 3,073,555 | 551,100 |
| Events in quadrant D | 3,503,708 | 517,899 |
| Mode M0 | |||
|---|---|---|---|
| Quadrant | BADHDUFLAG | Total packets | Discarded packets |
| A | 0 | 11351 | 3 |
| B | 0 | 10802 | 2 |
| C | 0 | 12274 | 2 |
| D | 0 | 13854 | 2 |
| Mode SS | |||
|---|---|---|---|
| Quadrant | BADHDUFLAG | Total packets | Discarded packets |
| A | 0 | 106 | 0 |
| B | 0 | 106 | 0 |
| C | 0 | 106 | 0 |
| D | 0 | 106 | 0 |
| Mode M9 | |||
|---|---|---|---|
| Quadrant | BADHDUFLAG | Total packets | Discarded packets |
| A | 0 | 42 | 0 |
| B | 0 | 42 | 0 |
| C | 0 | 42 | 0 |
| D | 0 | 42 | 0 |
| Quadrant | Total seconds | Saturated seconds | Saturation percentage |
|---|---|---|---|
| A | 5188 | 15 | 0.289129% |
| B | 5188 | 16 | 0.308404% |
| C | 5188 | 245 | 4.722436% |
| D | 5188 | 204 | 3.932151% |
Noise dominated data is calculated using 1-second bins in cleaned event files. If a bin has >2000 counts, and if more than 50% of those come from <1% of pixels, then it is considered to be noise-dominated and hence unusable.
| Quadrant | # 1 sec bins | Bins with >0 counts | Bins with >2000 counts | High rate bins dominated by noise | Noise dominated (total time) | Noise dominated (detector-on time) | Marked lightcurve |
|---|---|---|---|---|---|---|---|
| A | 9342 | 5190 | 4 | 4 | 0.04% | 0.08% | 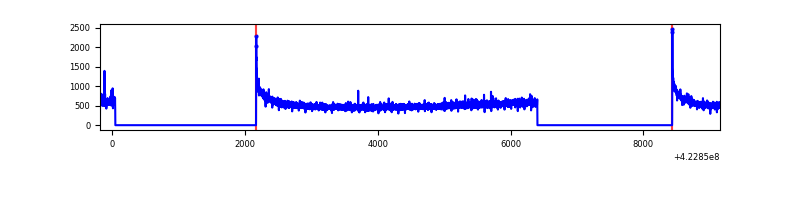 |
| B | 9342 | 5190 | 7 | 7 | 0.07% | 0.13% | 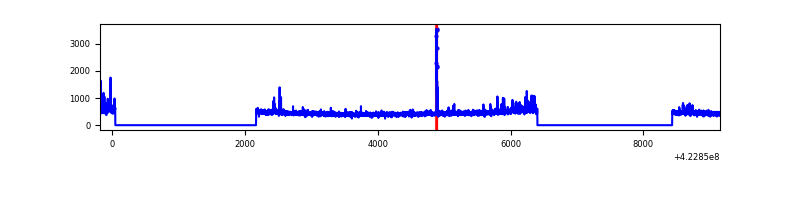 |
| C | 9342 | 5190 | 239 | 239 | 2.56% | 4.61% | 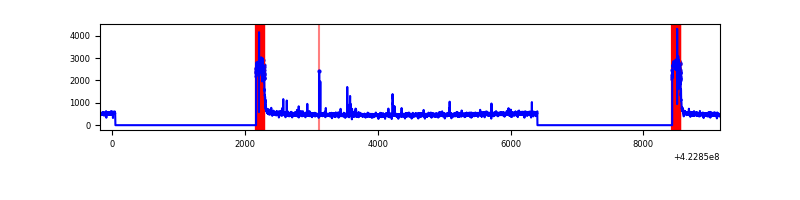 |
| D | 9342 | 5190 | 181 | 181 | 1.94% | 3.49% | 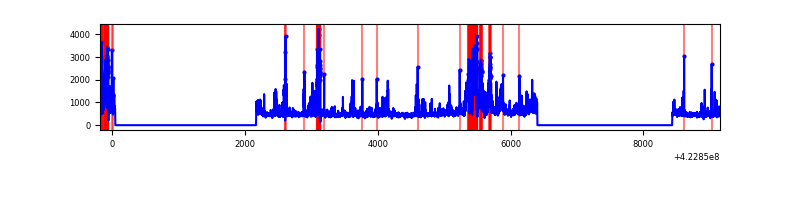 |
Top three noisy pixels from each quadrant. If the there are fewer than three noisy pixels in the level2.evt file, extra rows are filled as -1
| Pixel properties | Quadrant properties | ||||||
|---|---|---|---|---|---|---|---|
| Quadrant | DetID | PixID | Counts | Sigma | Mean | Median | Sigma |
| A | 10 | 83 | 511316 | 4261.22 | 577 | 566 | 119.9 |
| A | 2 | 79 | 13315 | 106.36 | 577 | 566 | 119.9 |
| A | 13 | 6 | 7289 | 56.09 | 577 | 566 | 119.9 |
| B | 0 | 190 | 94465 | 845.88 | 572 | 556 | 111.0 |
| B | 5 | 255 | 38246 | 339.49 | 572 | 556 | 111.0 |
| B | 12 | 111 | 14025 | 121.32 | 572 | 556 | 111.0 |
| C | 0 | 10 | 653925 | 5089.67 | 551 | 554 | 128.4 |
| C | 15 | 214 | 227597 | 1768.64 | 551 | 554 | 128.4 |
| C | 15 | 111 | 42864 | 329.59 | 551 | 554 | 128.4 |
| D | 2 | 249 | 518062 | 3718.2 | 563 | 546 | 139.2 |
| D | 1 | 47 | 403311 | 2893.75 | 563 | 546 | 139.2 |
| D | 12 | 79 | 217441 | 1558.33 | 563 | 546 | 139.2 |
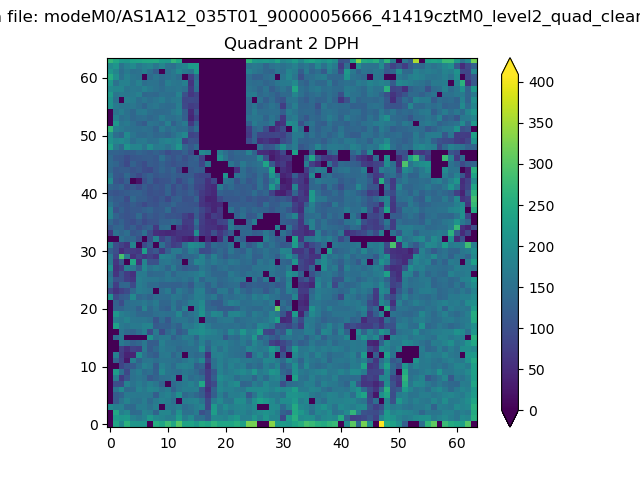
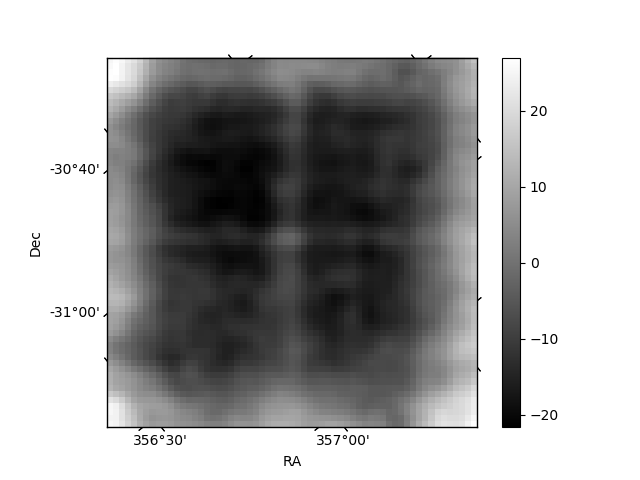
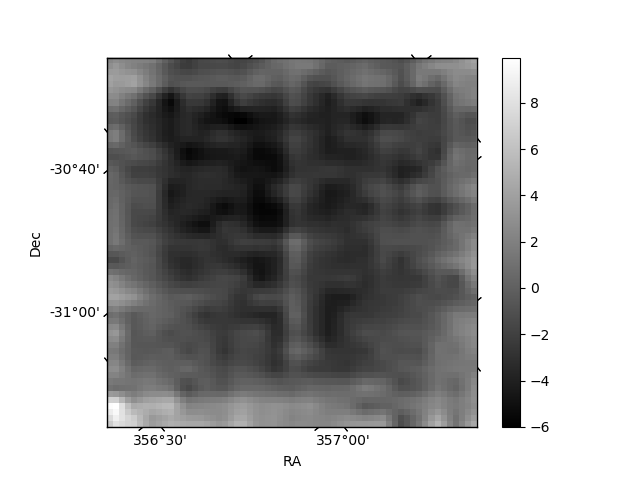
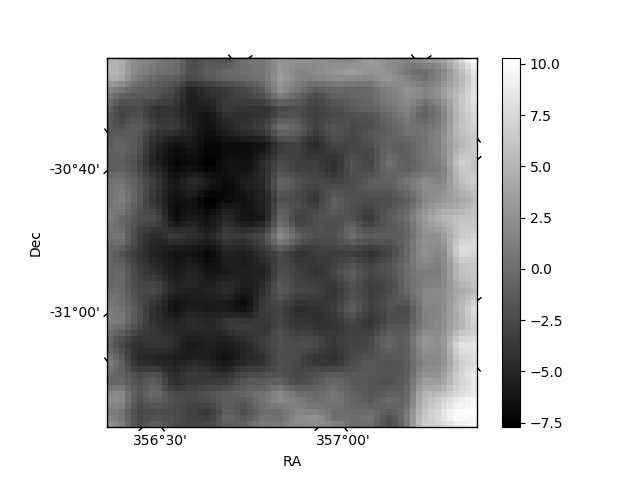
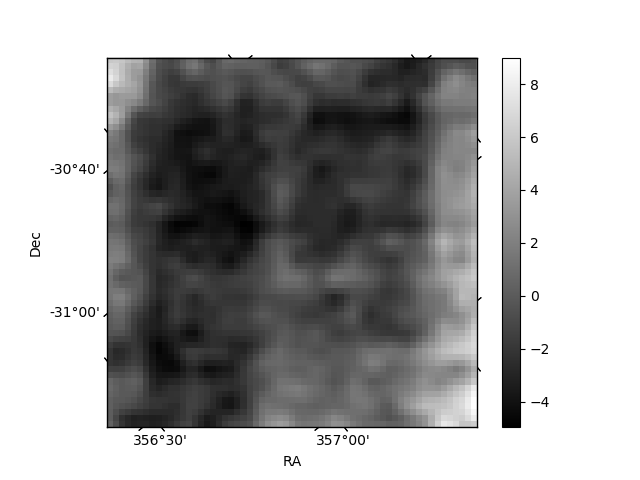
Histogram calculated using DETX and DETY for each event in the final _common_clean file
| Quadrant A | 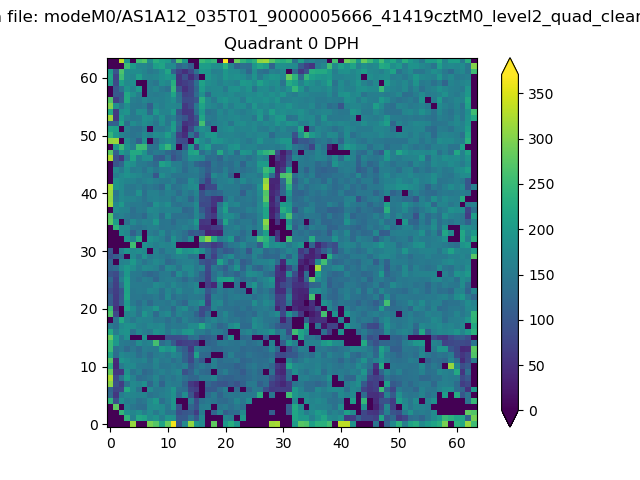 |
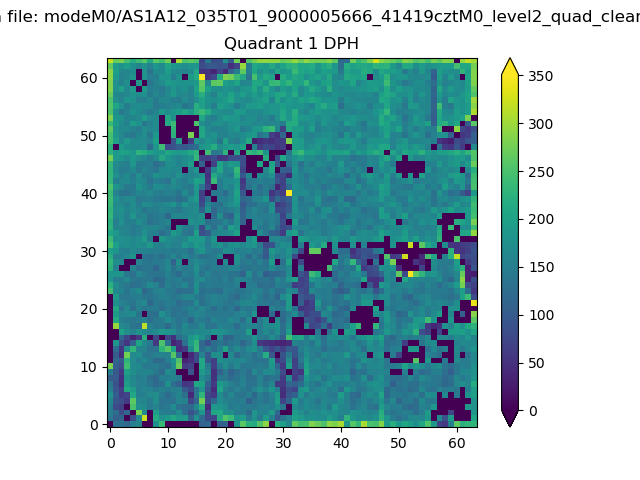 |
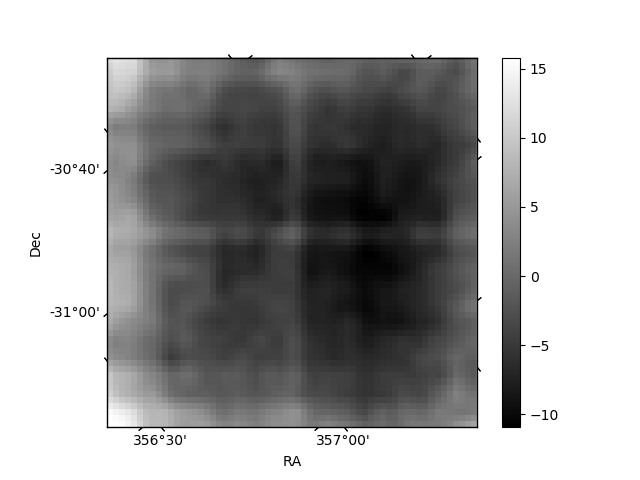
Quadrant B |
|---|---|---|---|
| Quadrant D | 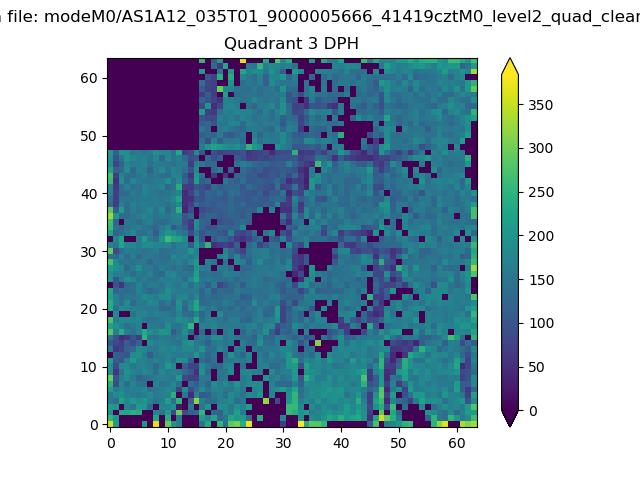 |
 |
Quadrant C |
| Plot type | Count rate plots | Images |
|---|---|---|
| Comparison with Poisson distribution Blue bars denote a histogram of data divided into 1 sec bins. Red curve is a Poisson curve with rate = median count rate of data. |
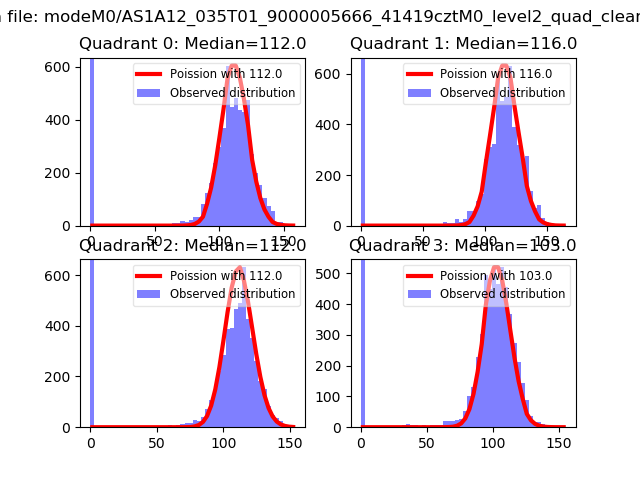 |
 |
| Quadrant-wise count rates Data is divided into 100 sec bins |
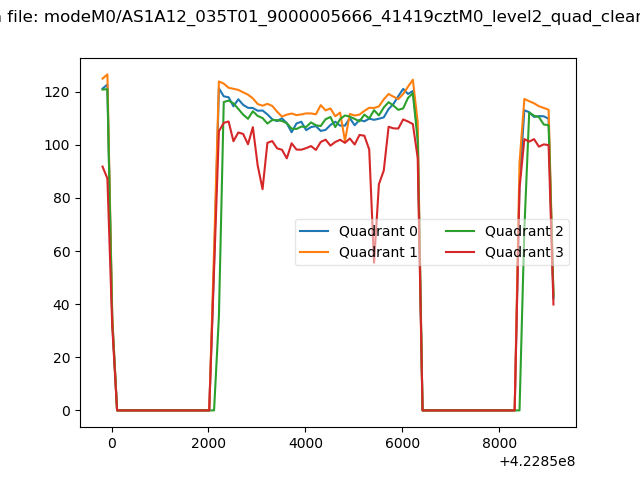 |
|
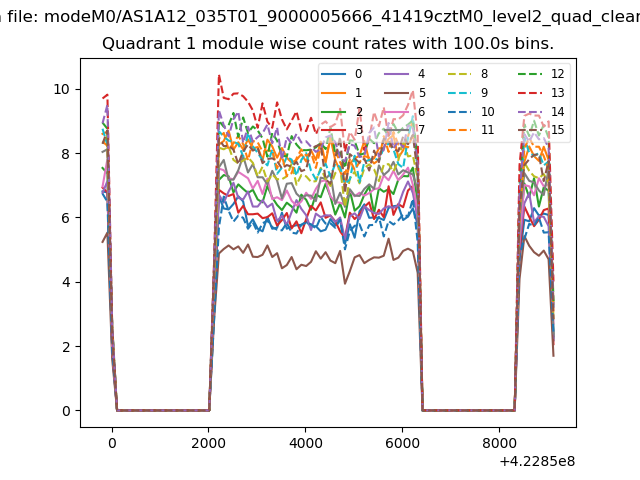
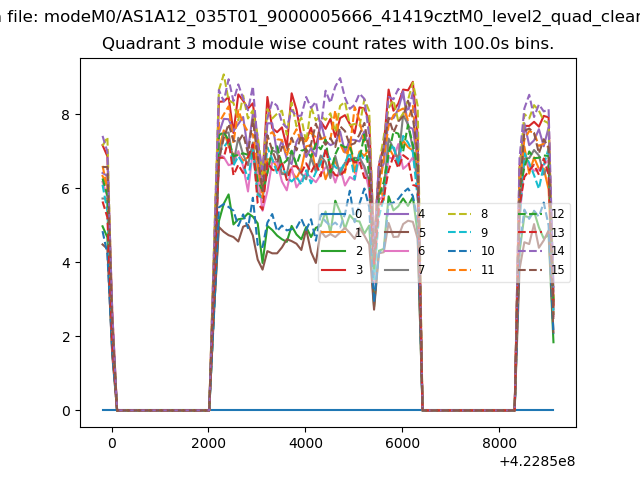
| Module-wise count rates for Quadrant A Data is divided into 100 sec bins |
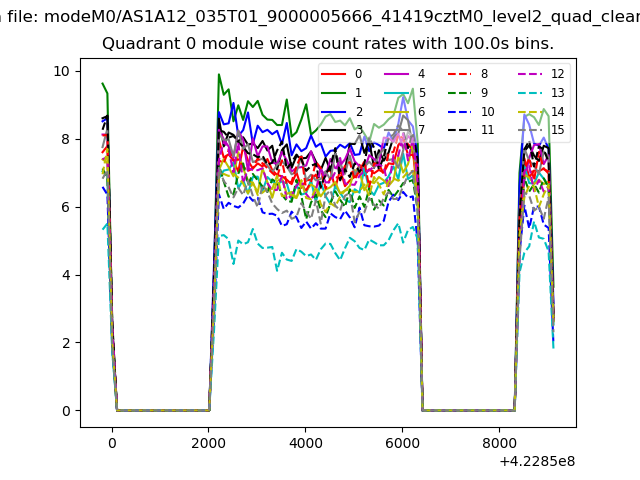 |
 |
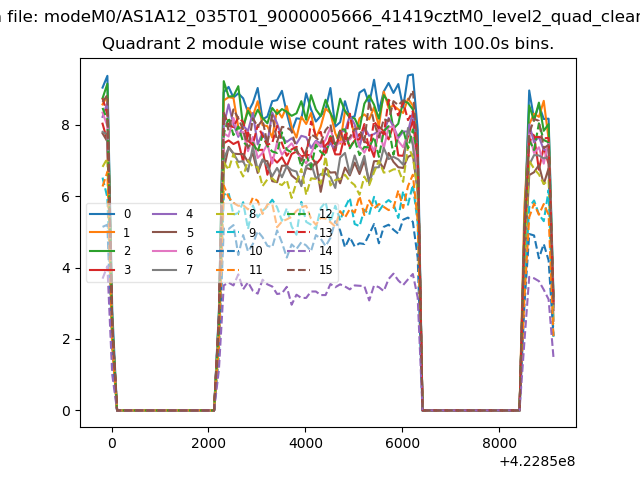
| Module-wise count rates for Quadrant B Data is divided into 100 sec bins |
 |
 |
| Module-wise count rates for Quadrant C Data is divided into 100 sec bins |
 |
 |
| Module-wise count rates for Quadrant D Data is divided into 100 sec bins |
 |
 |
| Parameter | Plot |
|---|---|
| CZT HV Monitor | 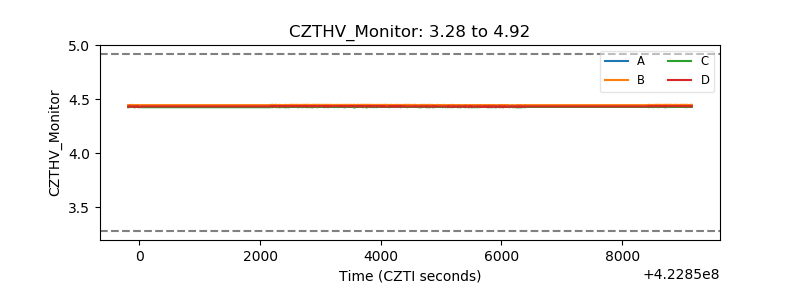 |
| D_VDD | 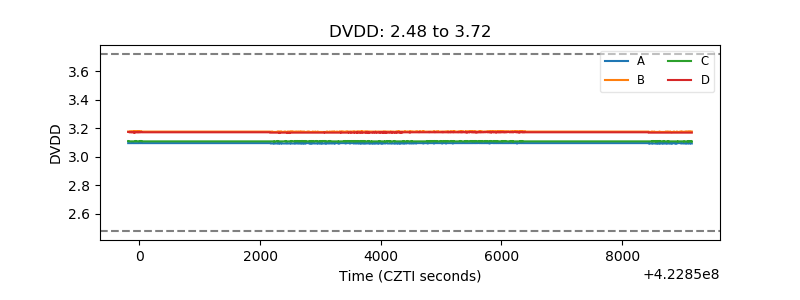 |
| Temperature 1 | 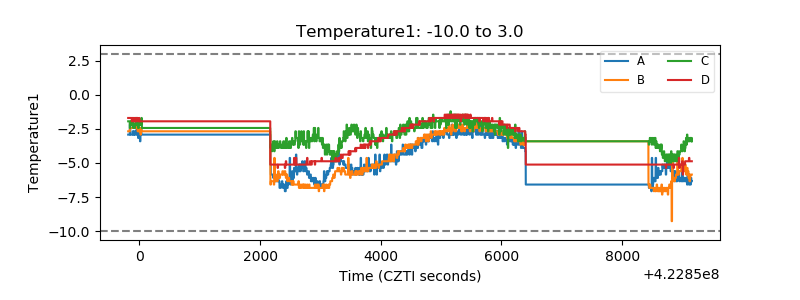 |
| Veto HV Monitor | 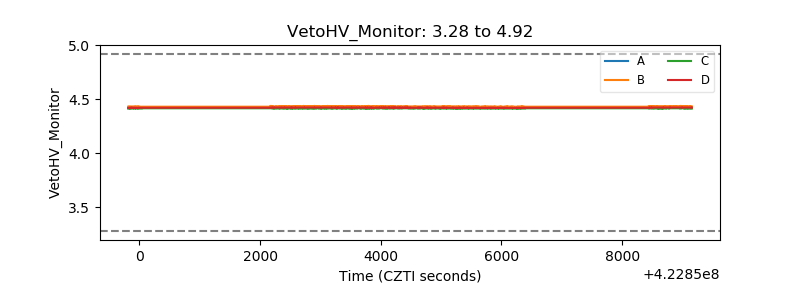 |
| Veto LLD | 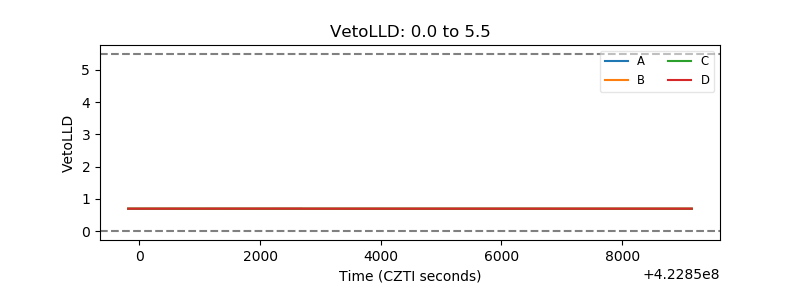 |
| Alpha Counter | 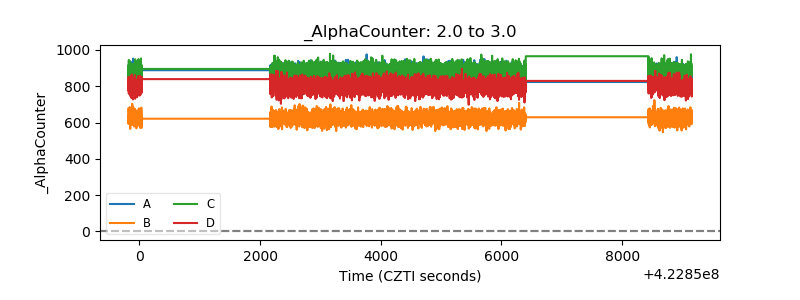 |
| _CPM_Rate | 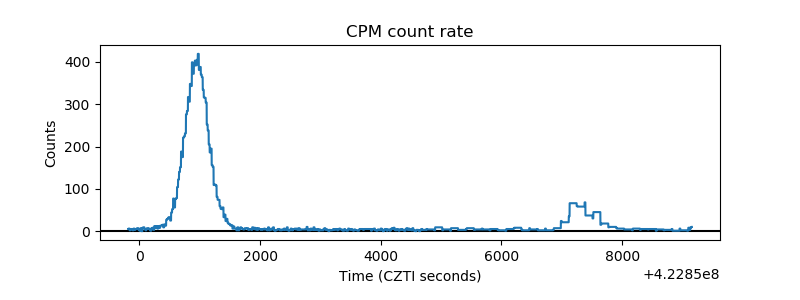 |
| CZT Counter | 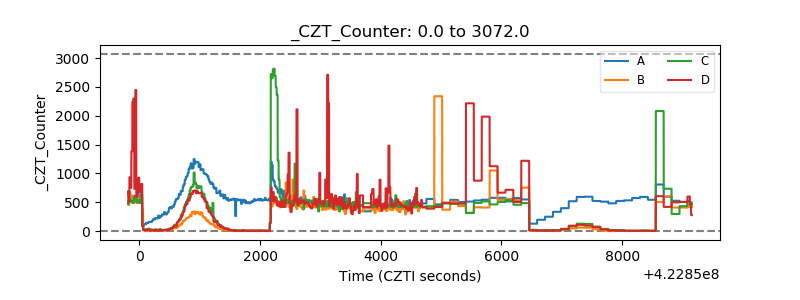 |
| +2.5 Volts monitor | 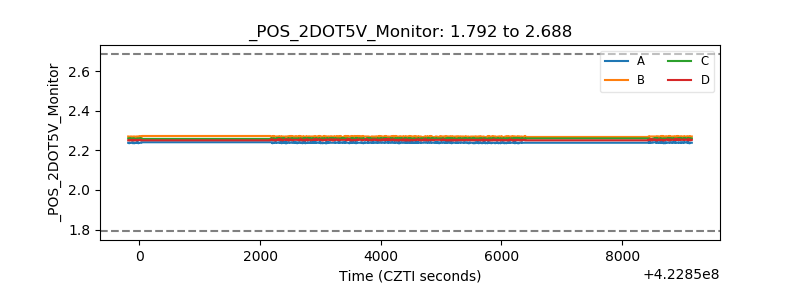 |
| +5 Volts monitor | 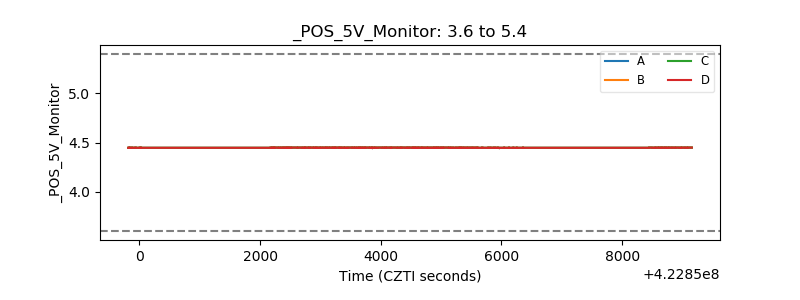 |
| _ROLL_ROT | 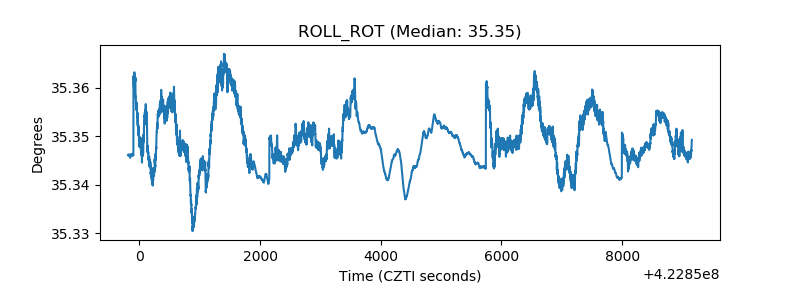 |
| _Roll_DEC | 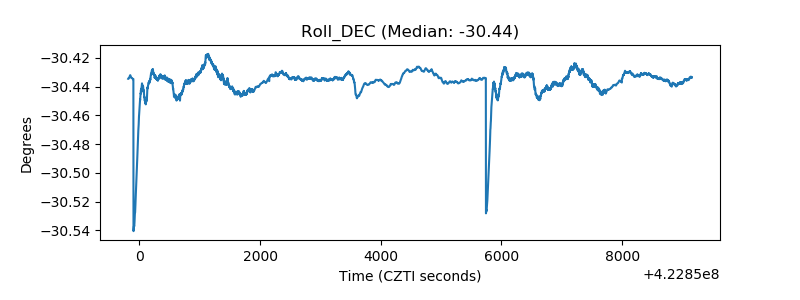 |
| _Roll_RA | 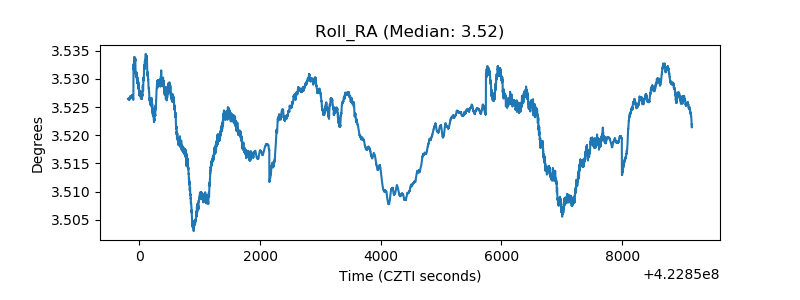 |
| Veto Counter | 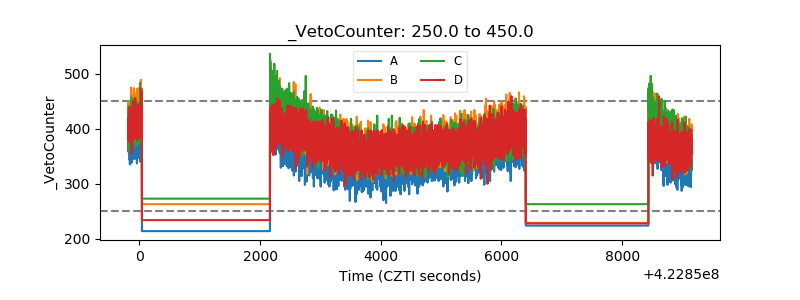 |