| Param | Original file | Final file |
|---|---|---|
| Filename | modeM0/AS1A12_035T01_9000005666_41420cztM0_level2.fits | modeM0/AS1A12_035T01_9000005666_41420cztM0_level2_quad_clean.evt |
| Size (bytes) | 376,522,560 | 85,809,600 |
| Size | 359.1 MB | 81.8 MB |
| Events in quadrant A | 2,887,166 | 585,682 |
| Events in quadrant B | 3,397,690 | 564,350 |
| Events in quadrant C | 3,022,827 | 558,231 |
| Events in quadrant D | 4,211,674 | 514,369 |
| Mode M0 | |||
|---|---|---|---|
| Quadrant | BADHDUFLAG | Total packets | Discarded packets |
| A | 0 | 11737 | 3 |
| B | 0 | 13891 | 2 |
| C | 0 | 12336 | 2 |
| D | 0 | 16094 | 2 |
| Mode SS | |||
|---|---|---|---|
| Quadrant | BADHDUFLAG | Total packets | Discarded packets |
| A | 0 | 108 | 0 |
| B | 0 | 108 | 0 |
| C | 0 | 108 | 0 |
| D | 0 | 108 | 0 |
| Mode M9 | |||
|---|---|---|---|
| Quadrant | BADHDUFLAG | Total packets | Discarded packets |
| A | 0 | 32 | 0 |
| B | 0 | 32 | 0 |
| C | 0 | 32 | 0 |
| D | 0 | 33 | 0 |
| Quadrant | Total seconds | Saturated seconds | Saturation percentage |
|---|---|---|---|
| A | 5370 | 18 | 0.335196% |
| B | 5370 | 422 | 7.858473% |
| C | 5370 | 215 | 4.003724% |
| D | 5370 | 295 | 5.493482% |
Noise dominated data is calculated using 1-second bins in cleaned event files. If a bin has >2000 counts, and if more than 50% of those come from <1% of pixels, then it is considered to be noise-dominated and hence unusable.
| Quadrant | # 1 sec bins | Bins with >0 counts | Bins with >2000 counts | High rate bins dominated by noise | Noise dominated (total time) | Noise dominated (detector-on time) | Marked lightcurve |
|---|---|---|---|---|---|---|---|
| A | 7072 | 5371 | 7 | 7 | 0.10% | 0.13% | 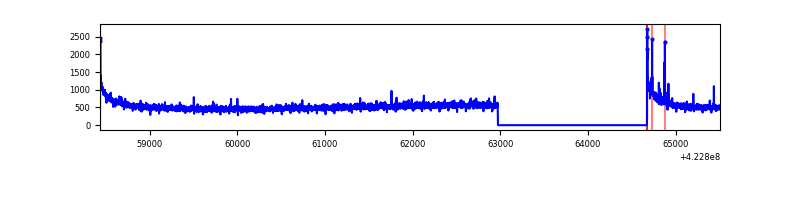 |
| B | 7072 | 5371 | 280 | 280 | 3.96% | 5.21% | 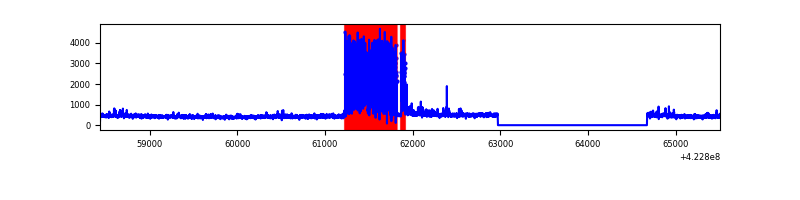 |
| C | 7072 | 5371 | 216 | 216 | 3.05% | 4.02% | 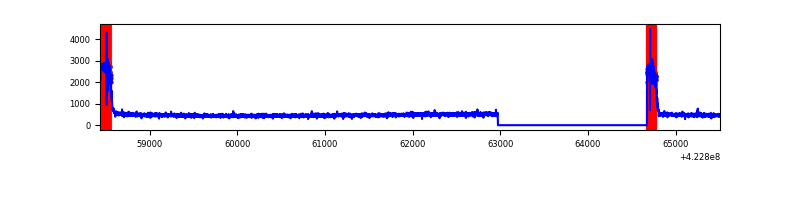 |
| D | 7072 | 5371 | 260 | 260 | 3.68% | 4.84% | 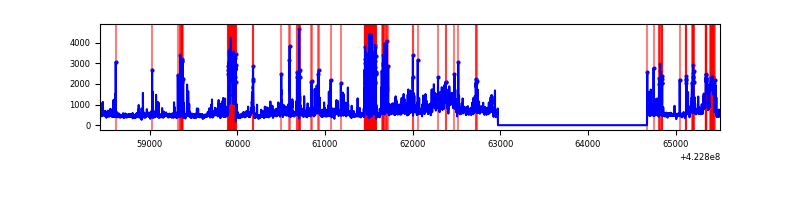 |
Top three noisy pixels from each quadrant. If the there are fewer than three noisy pixels in the level2.evt file, extra rows are filled as -1
| Pixel properties | Quadrant properties | ||||||
|---|---|---|---|---|---|---|---|
| Quadrant | DetID | PixID | Counts | Sigma | Mean | Median | Sigma |
| A | 10 | 83 | 538225 | 4389.35 | 591 | 578 | 122.5 |
| A | 13 | 248 | 26111 | 208.45 | 591 | 578 | 122.5 |
| A | 12 | 189 | 12622 | 98.33 | 591 | 578 | 122.5 |
| B | 0 | 186 | 1049512 | 9516.5 | 562 | 546 | 110.2 |
| B | 0 | 190 | 95102 | 857.84 | 562 | 546 | 110.2 |
| B | 12 | 111 | 13895 | 121.11 | 562 | 546 | 110.2 |
| C | 0 | 10 | 580508 | 4369.92 | 565 | 567 | 132.7 |
| C | 15 | 214 | 237811 | 1787.66 | 565 | 567 | 132.7 |
| C | 13 | 61 | 3689 | 23.52 | 565 | 567 | 132.7 |
| D | 1 | 52 | 487366 | 3475.75 | 568 | 551 | 140.1 |
| D | 2 | 249 | 484578 | 3455.84 | 568 | 551 | 140.1 |
| D | 1 | 47 | 378715 | 2700.01 | 568 | 551 | 140.1 |
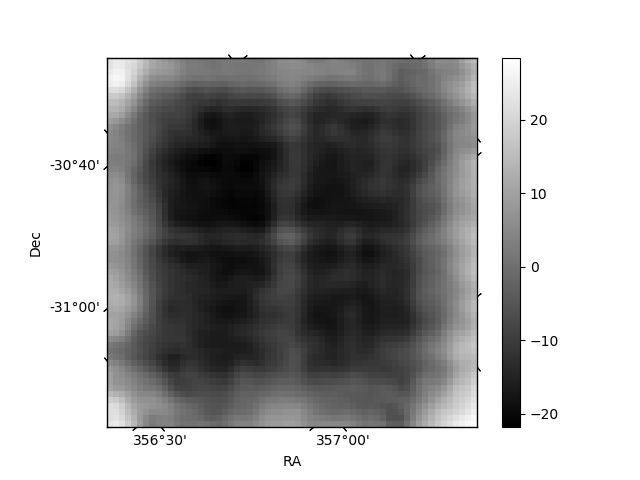
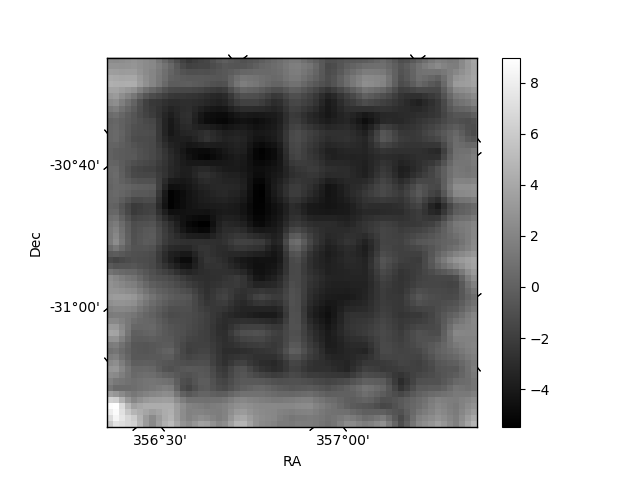
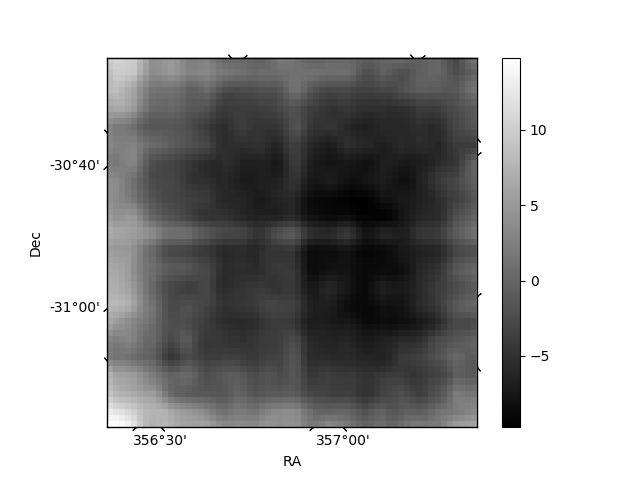
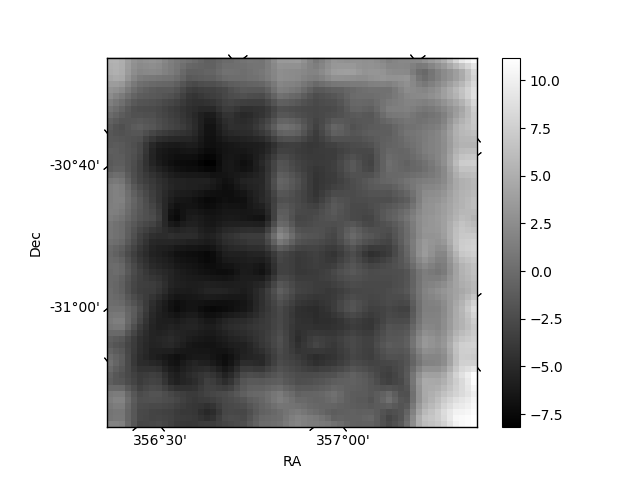
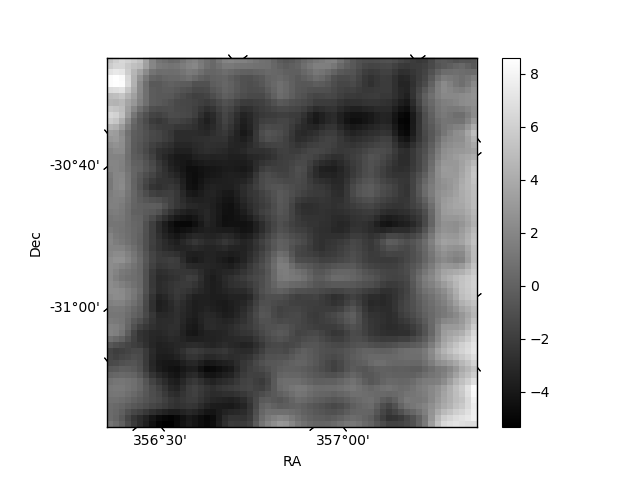
Histogram calculated using DETX and DETY for each event in the final _common_clean file
| Quadrant A | 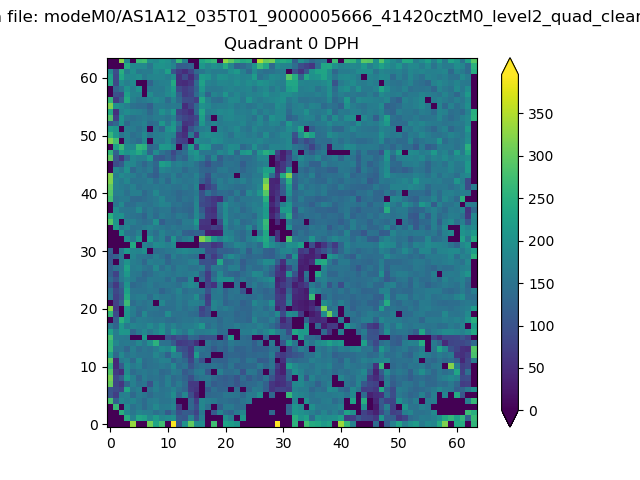 |
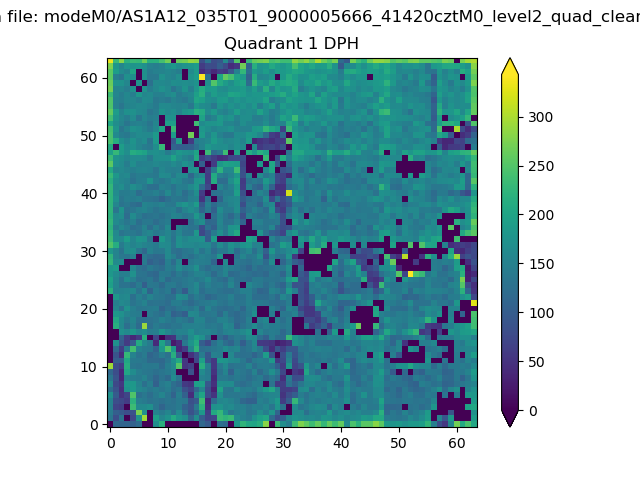 |
Quadrant B |
|---|---|---|---|
| Quadrant D | 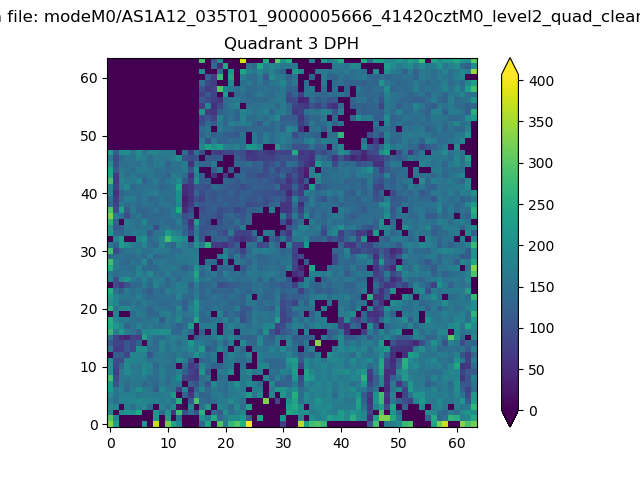 |
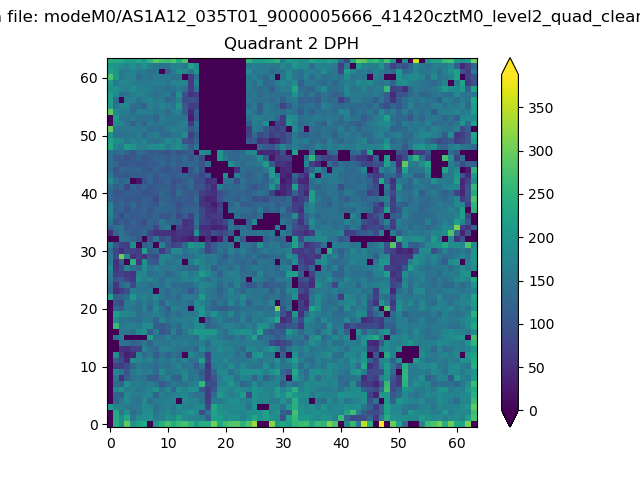 |
Quadrant C |
| Plot type | Count rate plots | Images |
|---|---|---|
| Comparison with Poisson distribution Blue bars denote a histogram of data divided into 1 sec bins. Red curve is a Poisson curve with rate = median count rate of data. |
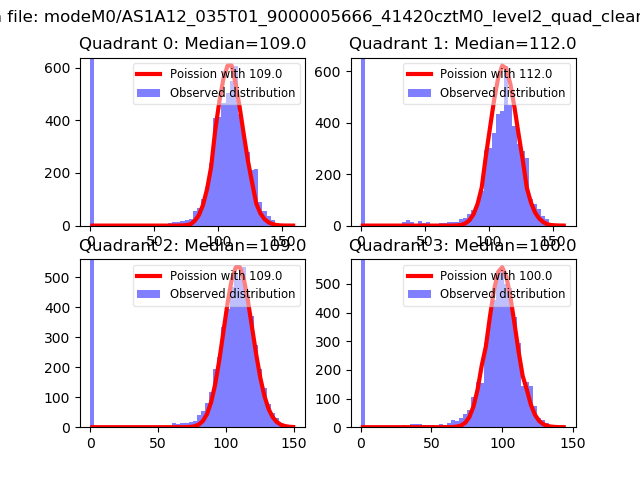 |
 |
| Quadrant-wise count rates Data is divided into 100 sec bins |
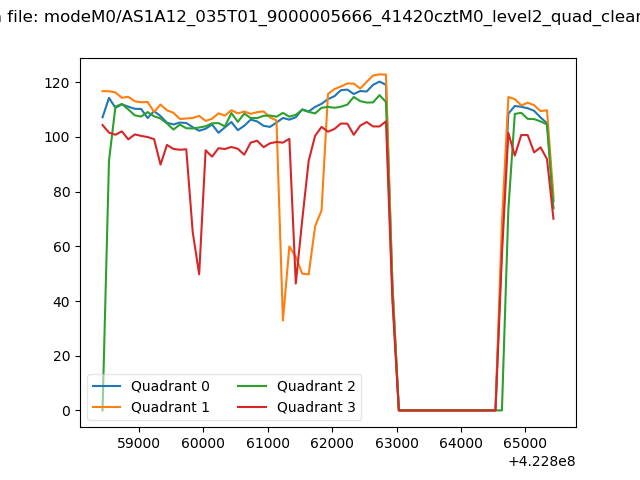 |
|
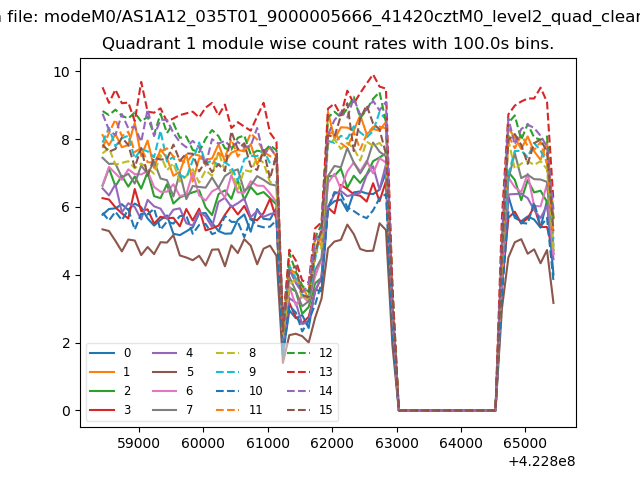
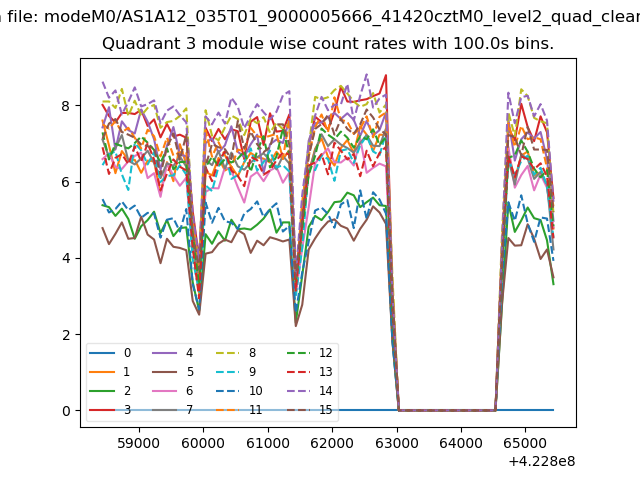
| Module-wise count rates for Quadrant A Data is divided into 100 sec bins |
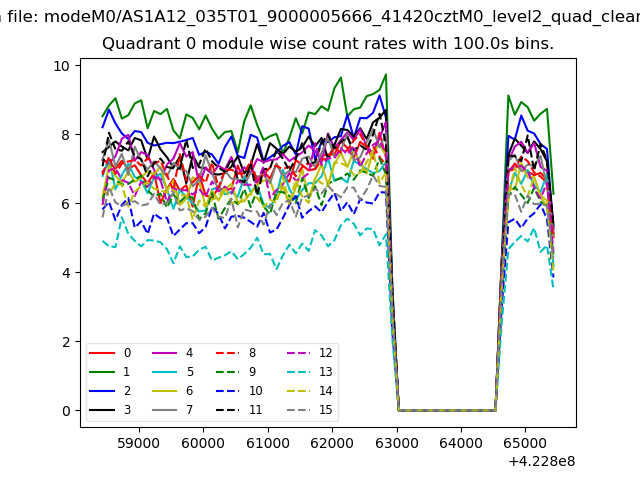 |
 |
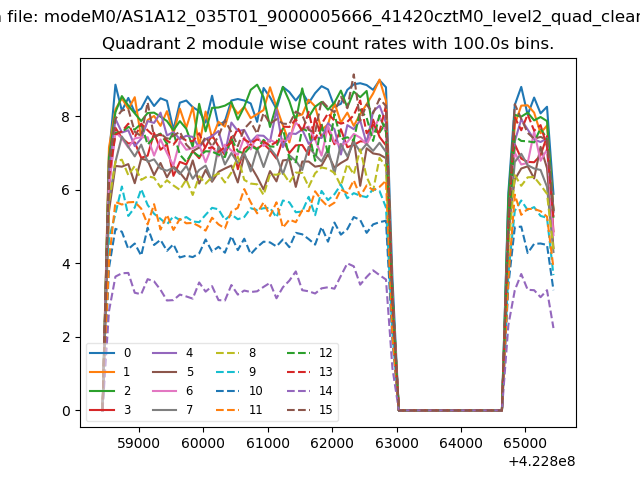
| Module-wise count rates for Quadrant B Data is divided into 100 sec bins |
 |
 |
| Module-wise count rates for Quadrant C Data is divided into 100 sec bins |
 |
 |
| Module-wise count rates for Quadrant D Data is divided into 100 sec bins |
 |
 |
| Parameter | Plot |
|---|---|
| CZT HV Monitor | 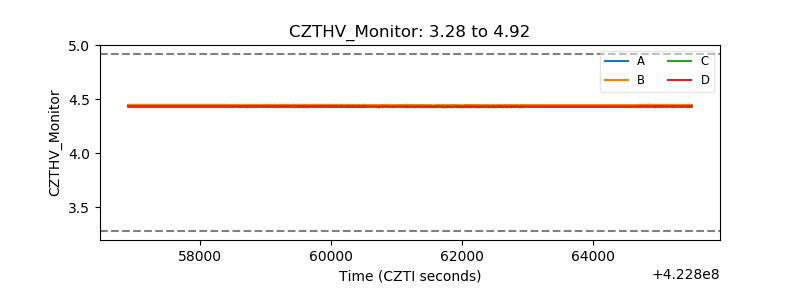 |
| D_VDD | 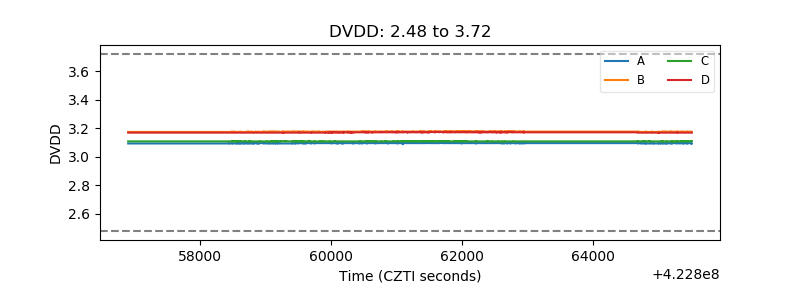 |
| Temperature 1 | 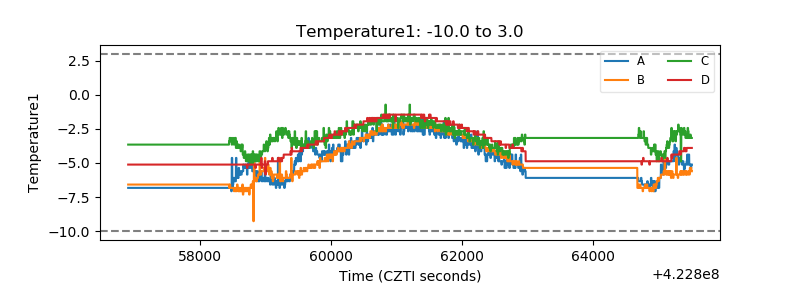 |
| Veto HV Monitor |  |
| Veto LLD | 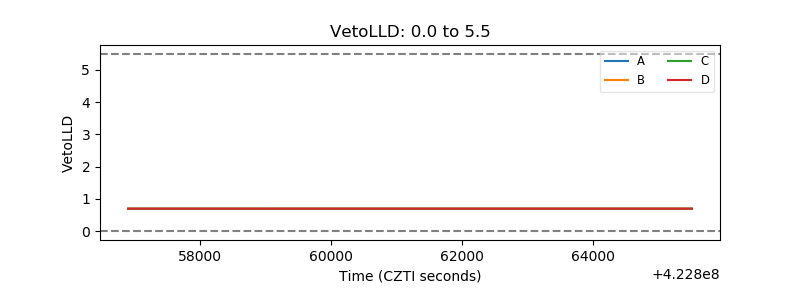 |
| Alpha Counter | 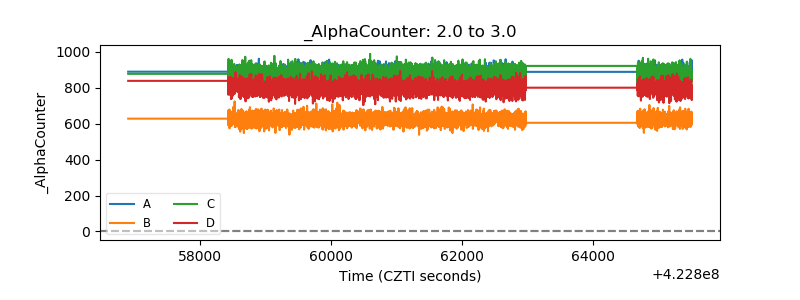 |
| _CPM_Rate | 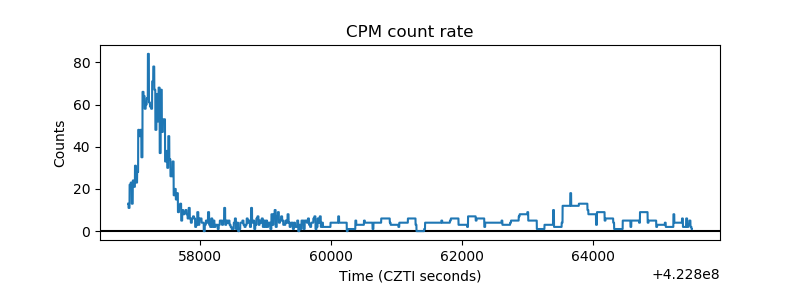 |
| CZT Counter | 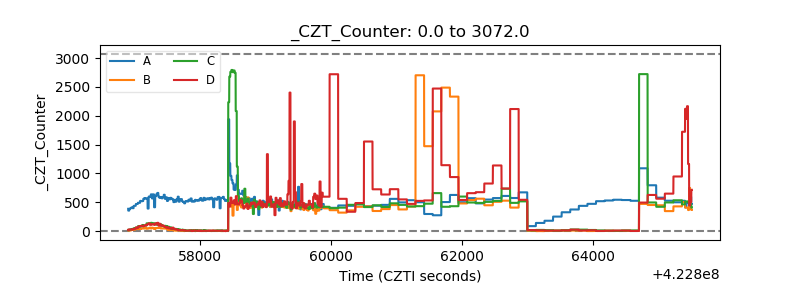 |
| +2.5 Volts monitor | 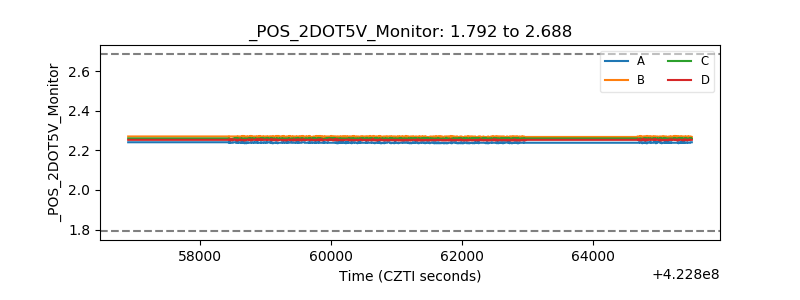 |
| +5 Volts monitor | 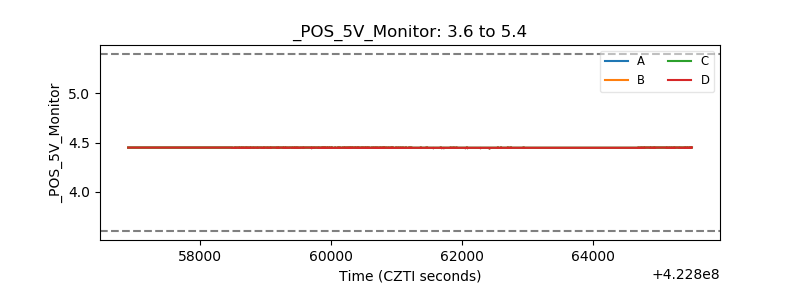 |
| _ROLL_ROT | 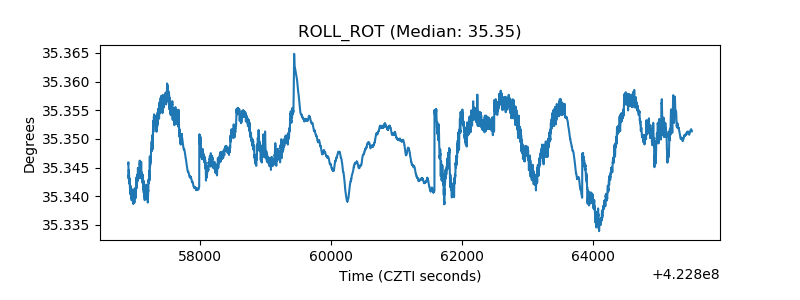 |
| _Roll_DEC |  |
| _Roll_RA | 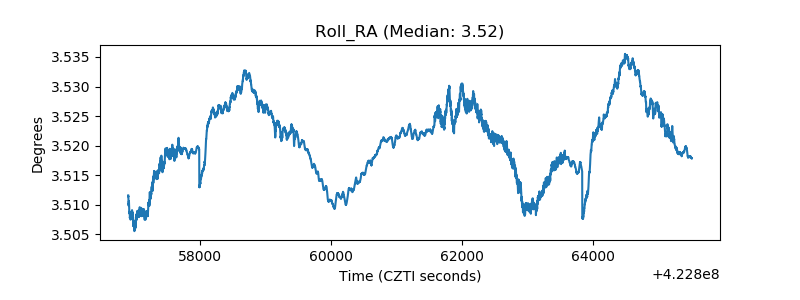 |
| Veto Counter | 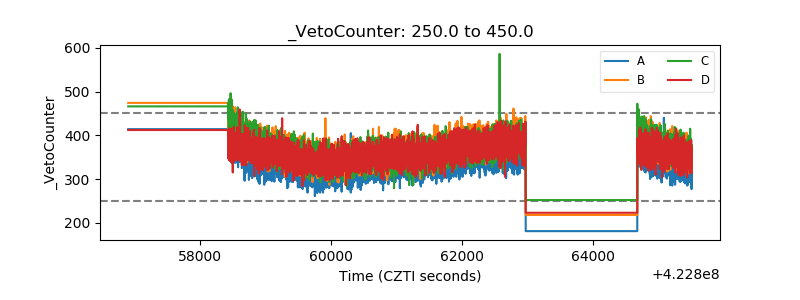 |