| Param | Original file | Final file |
|---|---|---|
| Filename | modeM0/AS1A12_035T01_9000005666_41421cztM0_level2.fits | modeM0/AS1A12_035T01_9000005666_41421cztM0_level2_quad_clean.evt |
| Size (bytes) | 432,838,080 | 91,457,280 |
| Size | 412.8 MB | 87.2 MB |
| Events in quadrant A | 3,190,212 | 625,586 |
| Events in quadrant B | 2,710,562 | 640,906 |
| Events in quadrant C | 3,122,611 | 604,418 |
| Events in quadrant D | 6,548,143 | 493,158 |
| Mode M0 | |||
|---|---|---|---|
| Quadrant | BADHDUFLAG | Total packets | Discarded packets |
| A | 0 | 12882 | 3 |
| B | 0 | 12118 | 2 |
| C | 0 | 12929 | 2 |
| D | 0 | 23412 | 2 |
| Mode SS | |||
|---|---|---|---|
| Quadrant | BADHDUFLAG | Total packets | Discarded packets |
| A | 0 | 118 | 0 |
| B | 0 | 118 | 0 |
| C | 0 | 118 | 0 |
| D | 0 | 118 | 0 |
| Mode M9 | |||
|---|---|---|---|
| Quadrant | BADHDUFLAG | Total packets | Discarded packets |
| A | 0 | 23 | 0 |
| B | 0 | 23 | 0 |
| C | 0 | 23 | 0 |
| D | 0 | 24 | 0 |
| Quadrant | Total seconds | Saturated seconds | Saturation percentage |
|---|---|---|---|
| A | 5796 | 27 | 0.465839% |
| B | 5796 | 26 | 0.448585% |
| C | 5796 | 151 | 2.605245% |
| D | 5796 | 957 | 16.511387% |
Noise dominated data is calculated using 1-second bins in cleaned event files. If a bin has >2000 counts, and if more than 50% of those come from <1% of pixels, then it is considered to be noise-dominated and hence unusable.
| Quadrant | # 1 sec bins | Bins with >0 counts | Bins with >2000 counts | High rate bins dominated by noise | Noise dominated (total time) | Noise dominated (detector-on time) | Marked lightcurve |
|---|---|---|---|---|---|---|---|
| A | 7200 | 5797 | 11 | 11 | 0.15% | 0.19% | 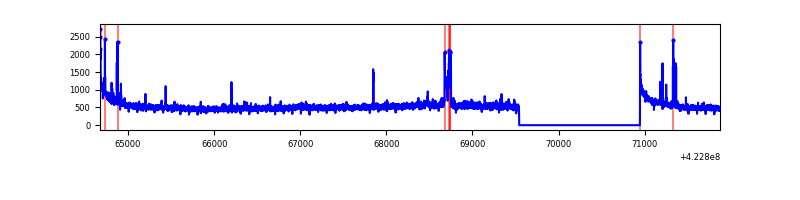 |
| B | 7200 | 5797 | 10 | 10 | 0.14% | 0.17% | 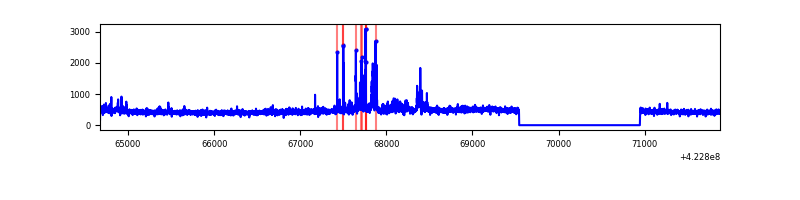 |
| C | 7200 | 5797 | 151 | 151 | 2.10% | 2.60% | 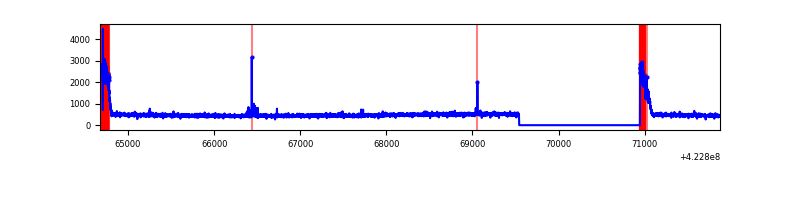 |
| D | 7200 | 5797 | 871 | 871 | 12.10% | 15.03% | 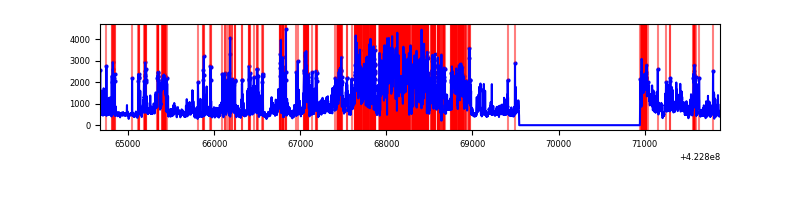 |
Top three noisy pixels from each quadrant. If the there are fewer than three noisy pixels in the level2.evt file, extra rows are filled as -1
| Pixel properties | Quadrant properties | ||||||
|---|---|---|---|---|---|---|---|
| Quadrant | DetID | PixID | Counts | Sigma | Mean | Median | Sigma |
| A | 10 | 83 | 558087 | 4230.61 | 639 | 628 | 131.8 |
| A | 12 | 189 | 90137 | 679.29 | 639 | 628 | 131.8 |
| A | 13 | 248 | 38201 | 285.14 | 639 | 628 | 131.8 |
| B | 0 | 186 | 98283 | 793.77 | 632 | 615 | 123.0 |
| B | 0 | 190 | 74874 | 603.52 | 632 | 615 | 123.0 |
| B | 5 | 255 | 23761 | 188.11 | 632 | 615 | 123.0 |
| C | 0 | 10 | 445596 | 3062.78 | 616 | 619 | 145.3 |
| C | 15 | 214 | 257742 | 1769.78 | 616 | 619 | 145.3 |
| C | 15 | 111 | 12767 | 83.61 | 616 | 619 | 145.3 |
| D | 1 | 52 | 3259288 | 22143.89 | 590 | 572 | 147.2 |
| D | 13 | 249 | 350382 | 2377.06 | 590 | 572 | 147.2 |
| D | 12 | 79 | 236112 | 1600.56 | 590 | 572 | 147.2 |
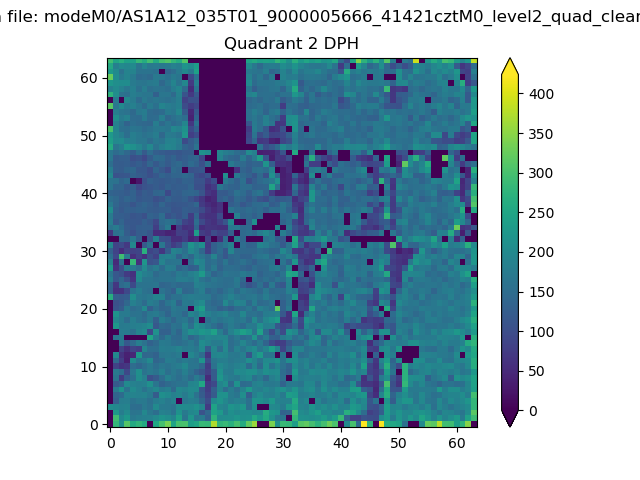
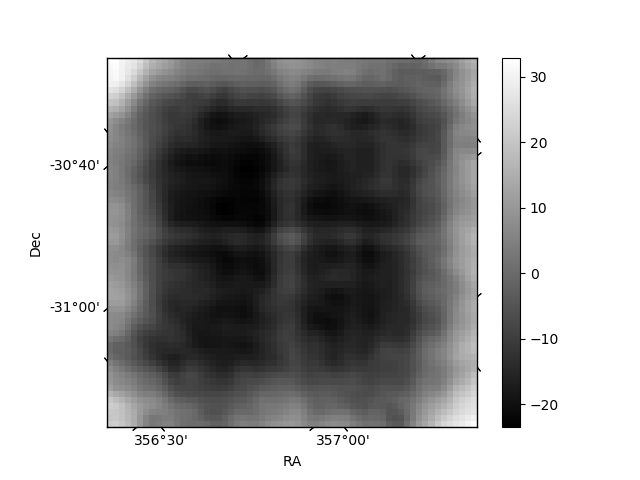
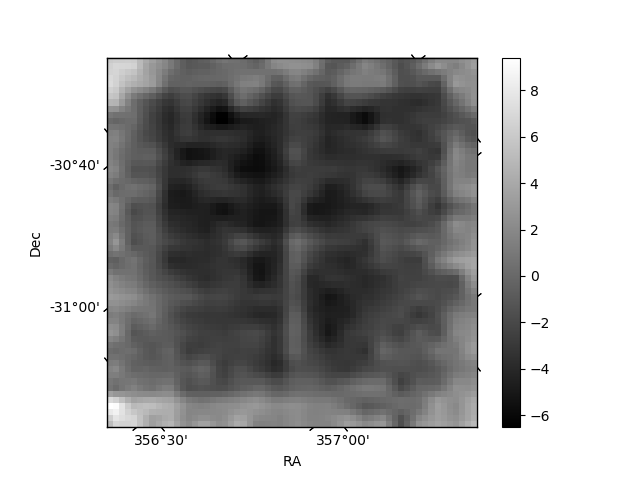
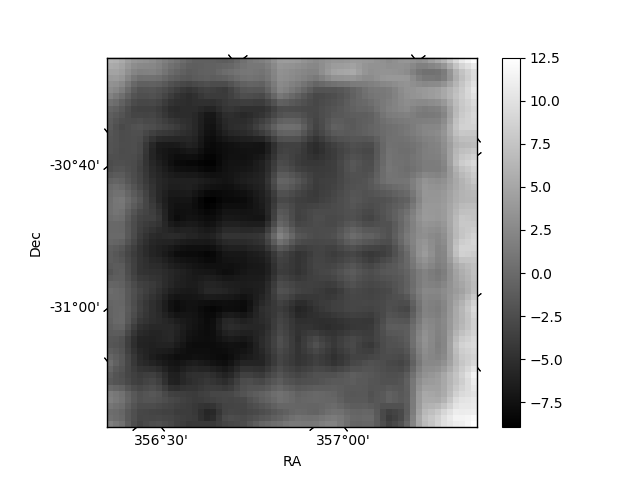
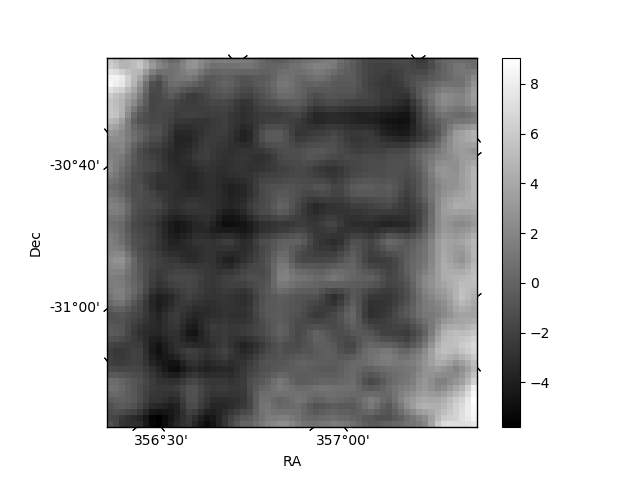
Histogram calculated using DETX and DETY for each event in the final _common_clean file
| Quadrant A | 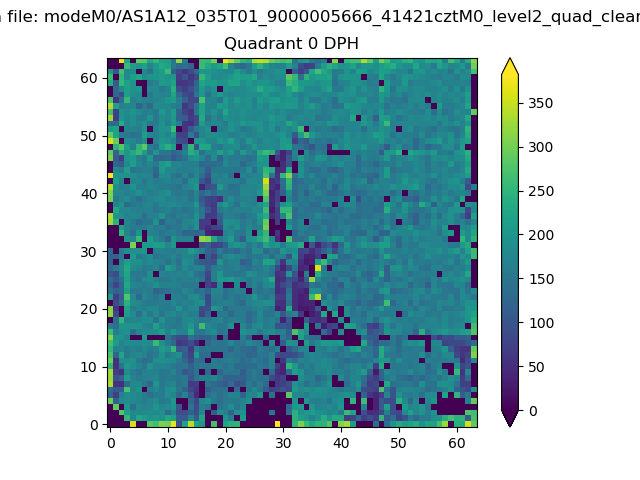 |
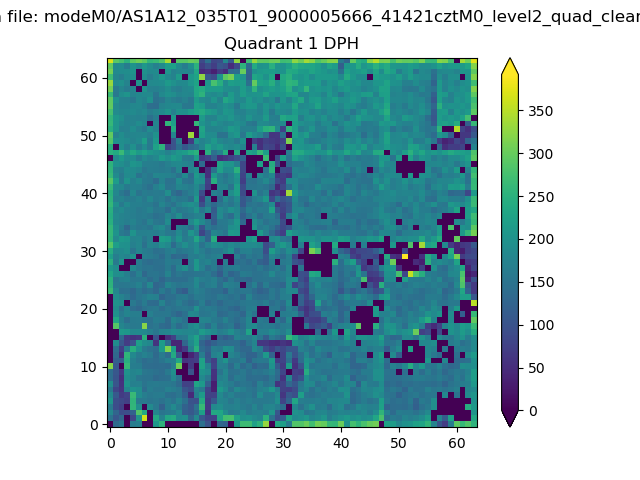 |
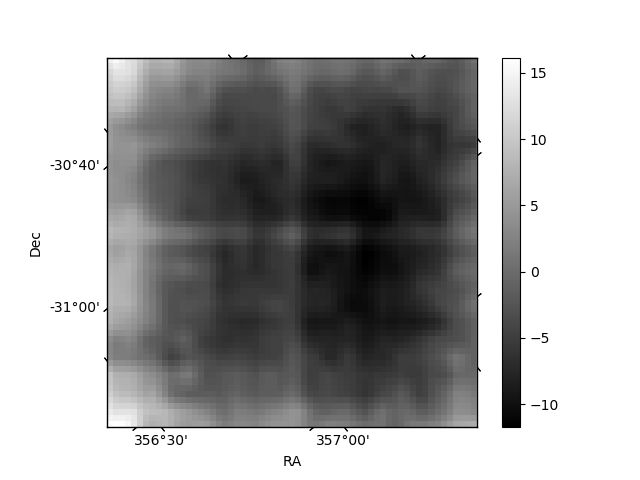
Quadrant B |
|---|---|---|---|
| Quadrant D | 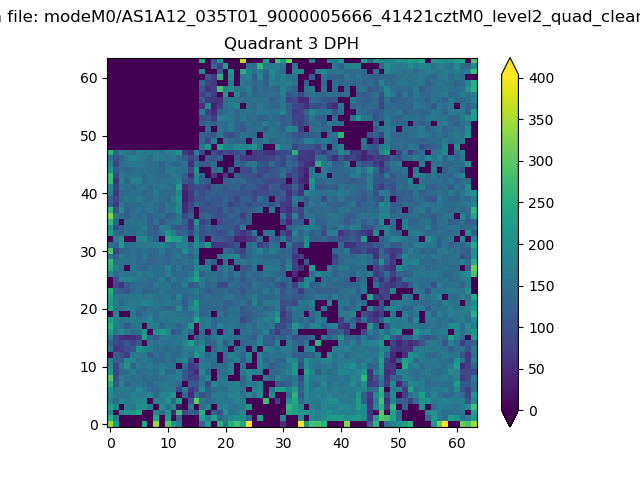 |
 |
Quadrant C |
| Plot type | Count rate plots | Images |
|---|---|---|
| Comparison with Poisson distribution Blue bars denote a histogram of data divided into 1 sec bins. Red curve is a Poisson curve with rate = median count rate of data. |
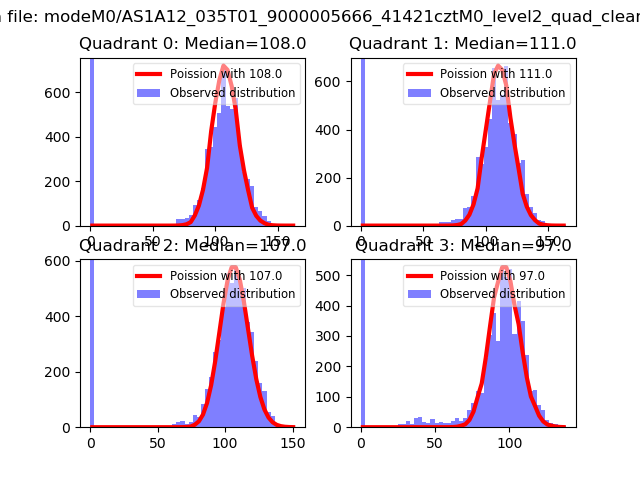 |
 |
| Quadrant-wise count rates Data is divided into 100 sec bins |
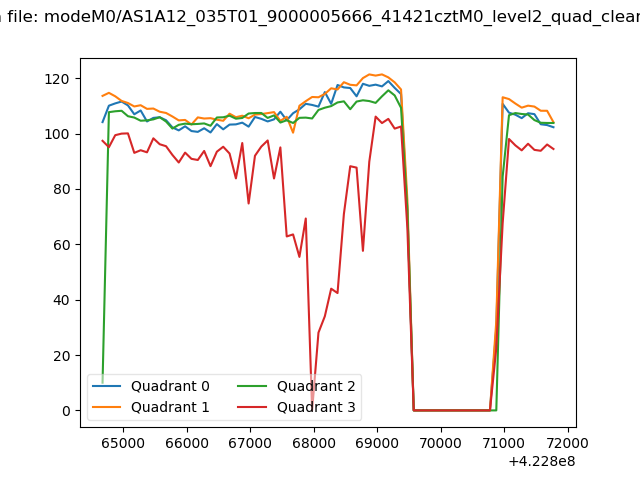 |
|
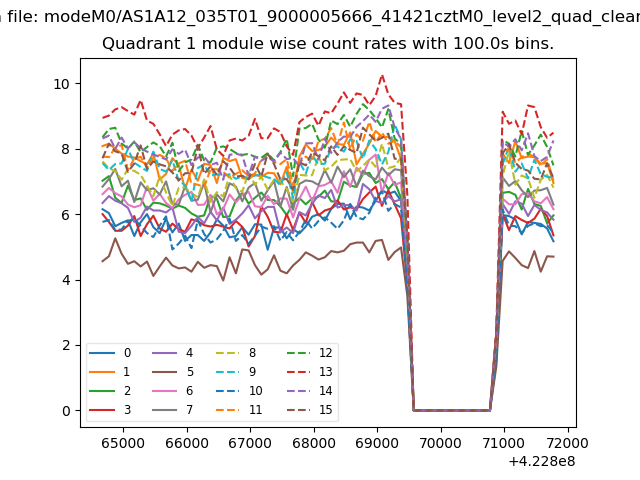
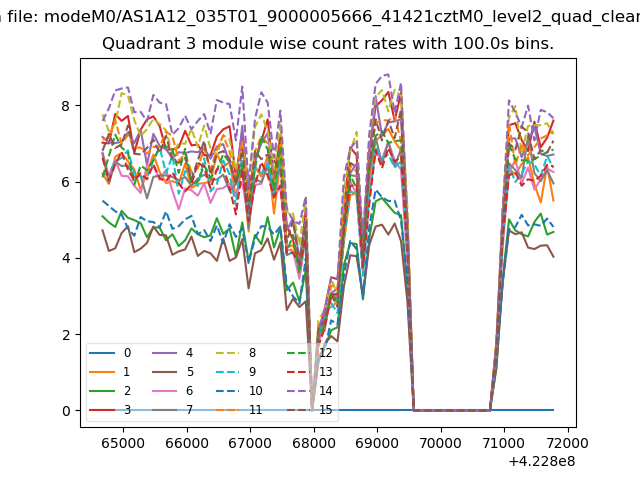
| Module-wise count rates for Quadrant A Data is divided into 100 sec bins |
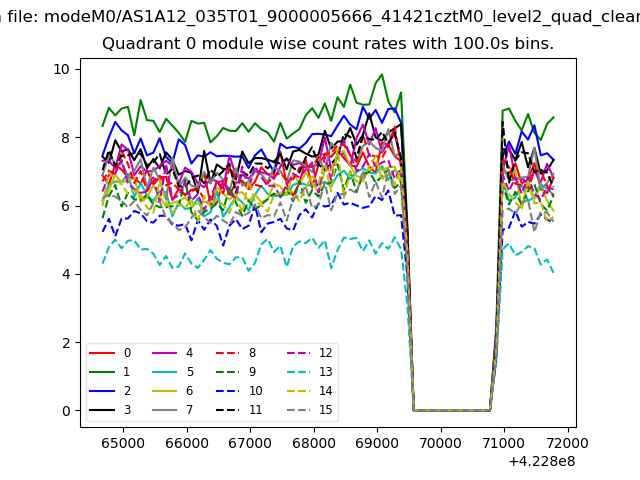 |
 |
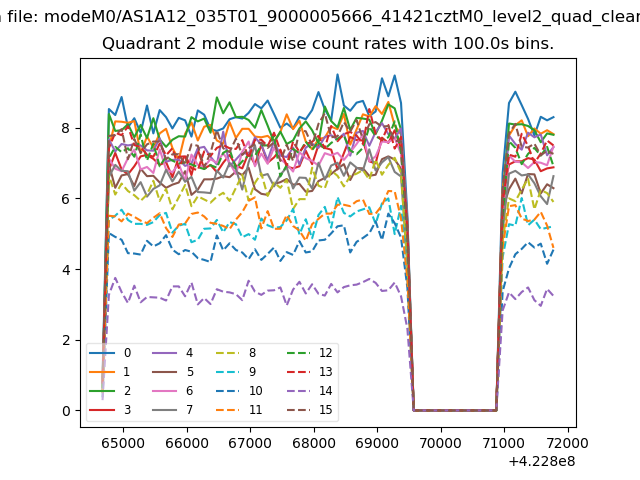
| Module-wise count rates for Quadrant B Data is divided into 100 sec bins |
 |
 |
| Module-wise count rates for Quadrant C Data is divided into 100 sec bins |
 |
 |
| Module-wise count rates for Quadrant D Data is divided into 100 sec bins |
 |
 |
| Parameter | Plot |
|---|---|
| CZT HV Monitor | 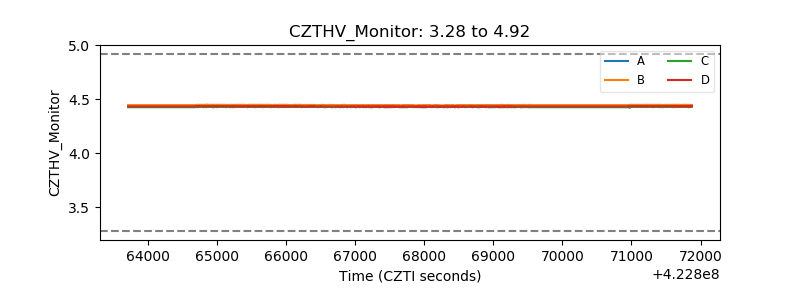 |
| D_VDD | 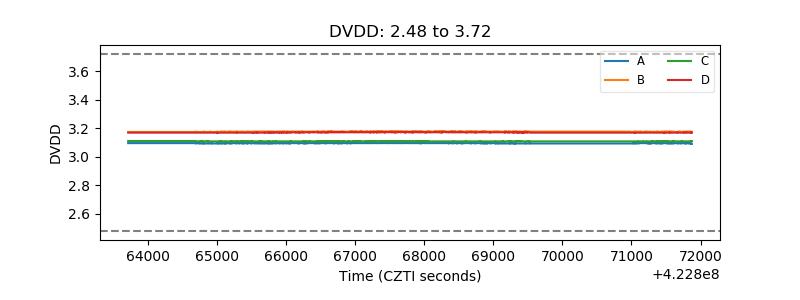 |
| Temperature 1 | 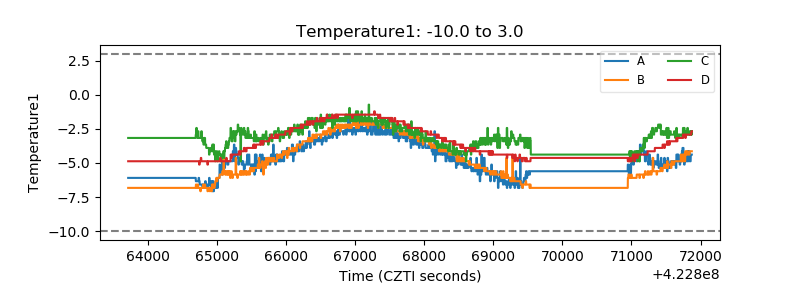 |
| Veto HV Monitor | 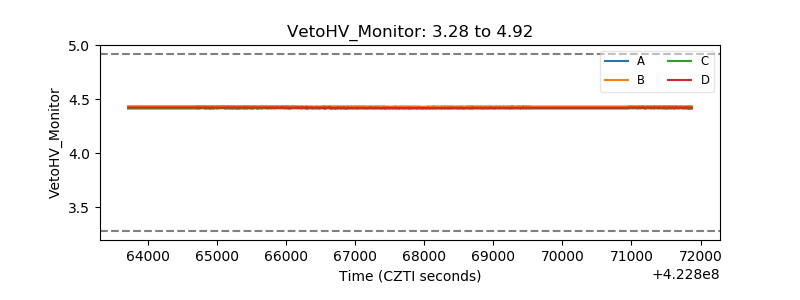 |
| Veto LLD | 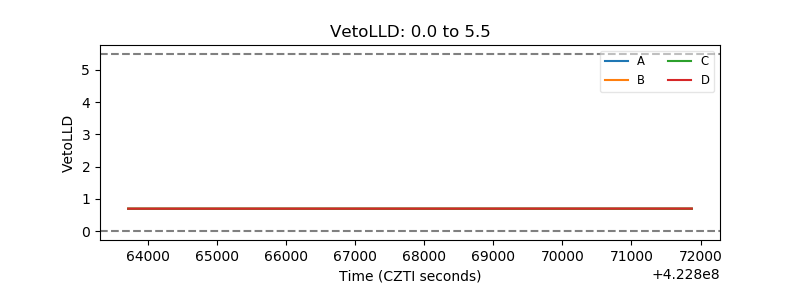 |
| Alpha Counter | 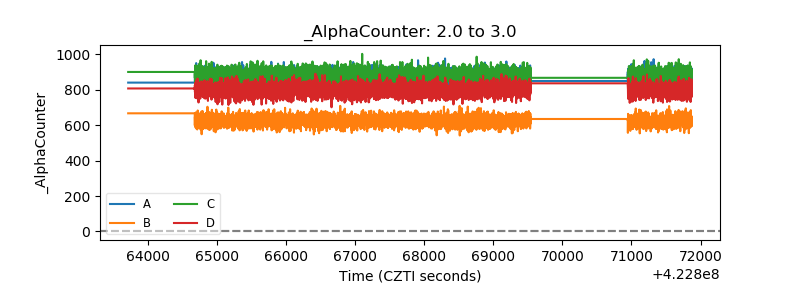 |
| _CPM_Rate | 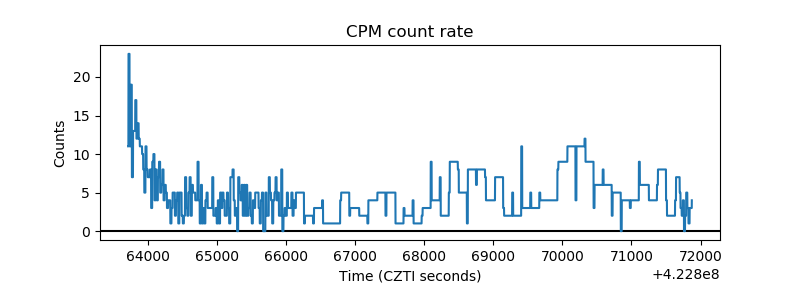 |
| CZT Counter | 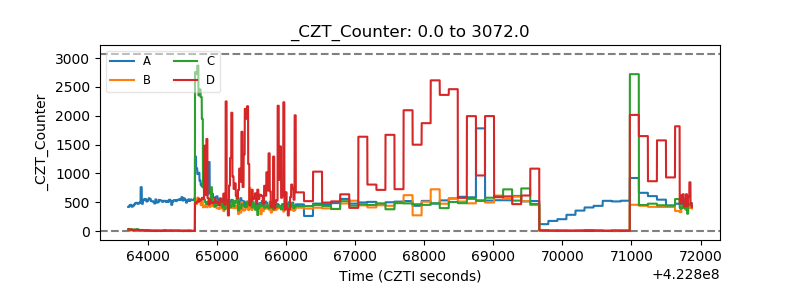 |
| +2.5 Volts monitor | 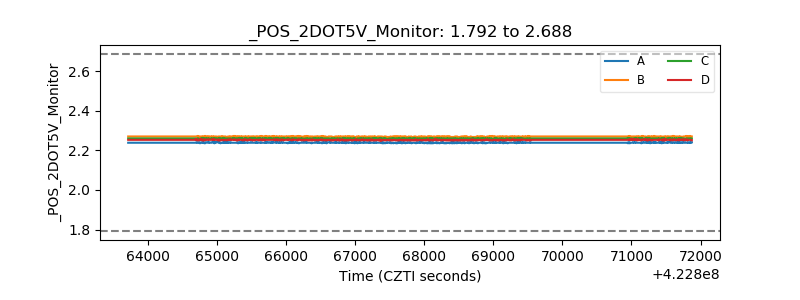 |
| +5 Volts monitor | 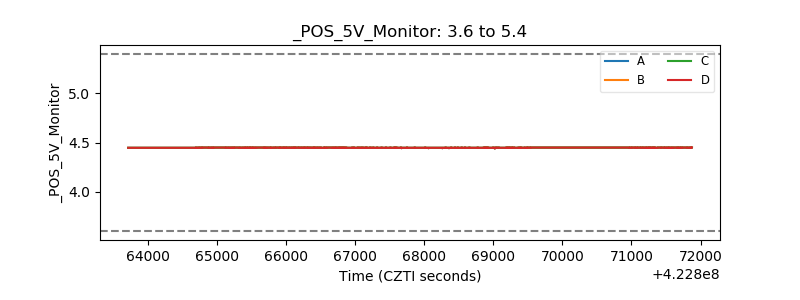 |
| _ROLL_ROT | 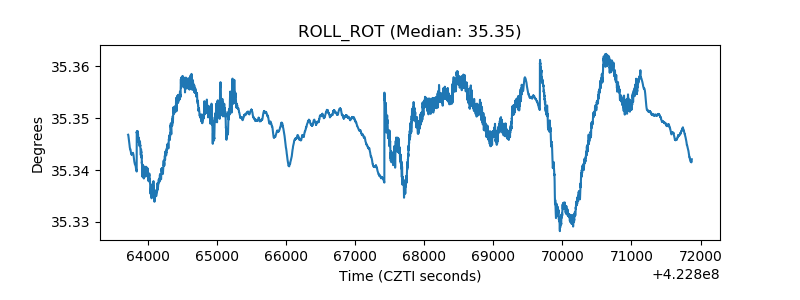 |
| _Roll_DEC | 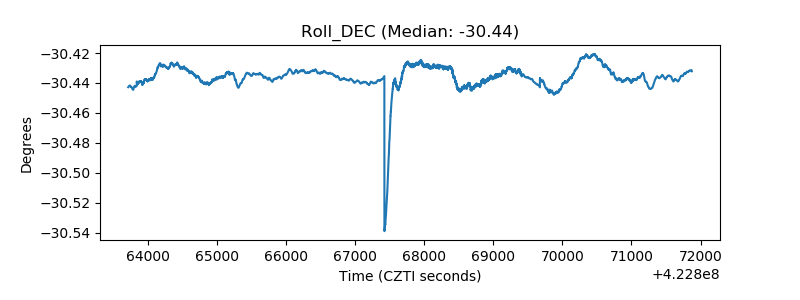 |
| _Roll_RA | 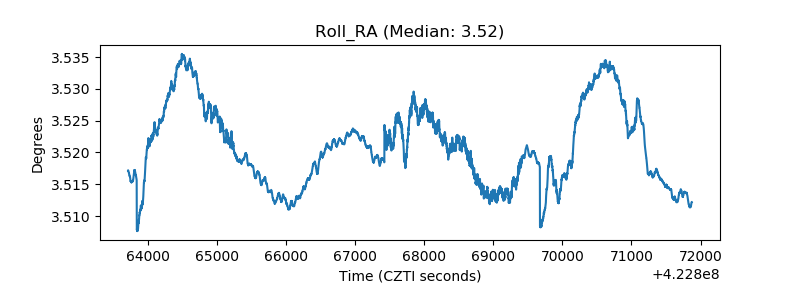 |
| Veto Counter | 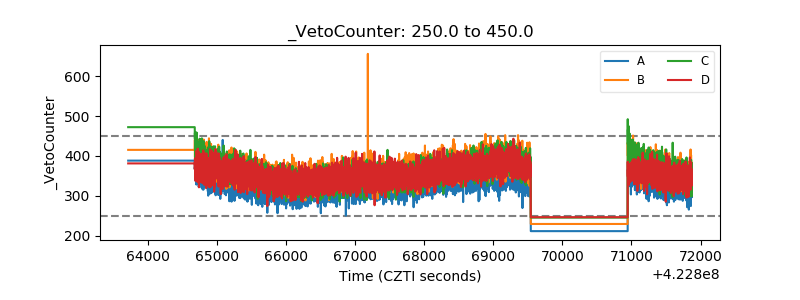 |